Guarda i video tutorial del Market su YouTube
Come acquistare un Robot di Trading o un indicatore
Esegui il tuo EA
hosting virtuale
hosting virtuale
Prova un indicatore/robot di trading prima di acquistarlo
Vuoi guadagnare nel Market?
Come presentare un prodotto per venderlo con successo
Indicatori tecnici a pagamento per MetaTrader 4 - 106

RaysFX Dynamic Cycle Explorer (DCE) RaysFX Dynamic Cycle Explorer (DCE) è un potente indicatore di trading sviluppato per la piattaforma MetaTrader 4. Progettato con l’obiettivo di fornire ai trader un vantaggio competitivo, DCE utilizza algoritmi avanzati per identificare e segnalare le opportunità di trading più promettenti. Caratteristiche principali Multi-periodo: DCE utilizza sei periodi diversi per calcolare i suoi segnali, offrendo una visione completa del mercato. Super Trend Price: DCE
Welcome to the world of advanced trading with the MACD Multicurrency Scanner! Maximize your trading experience with our powerful MT4 indicator designed for seamless analysis and real-time insights. Key Features: Effortless MACD Scanning: Unlock the full potential of the MACD Multicurrency Scanner by effortlessly scanning multiple currency pairs. Receive instant alerts when specific Moving Average Convergence Divergence (MACD) conditions are met, ensuring you stay ahead of market movements. Comp

RaysFX Candlestick Signals
RaysFX Candlestick Signals è un potente strumento progettato per migliorare la tua esperienza di trading su MT4. Questo indicatore personalizzato è stato sviluppato con l’obiettivo di fornire segnali di trading precisi e tempestivi basati su specifiche configurazioni di candele e l’indicatore RSI. Caratteristiche principali : Segnali di acquisto e vendita : L’indicatore genera segnali di acquisto e vendita basati su specifiche configurazioni di candele e valori dell’

Up Down trend - determines the trend itself. Correct identification of the trend determines 95% of trading efficiency. And if a trader always accurately determines the direction of the trend, then he will only have to wait for corrections in the direction of the trend and open trades. In any trading strategy you need to correctly identify the trend. If the trend is not defined correctly, the trader will not be able to effectively enter the market and most likely the trading result will be negat

Pivot Points และระดับ (Support) และ(Resistance) บนแผนภูมิการเทรดใน MetaTrader 4 สำหรับตลาด Forex : คำนวณ Pivot Points : สคริปต์คำนวณจุด Pivot โดยใช้ข้อมูลราคาประวัติศาสตร์ เช่น ราคาเปิด, ราคาสูงสุด, ราคาต่ำสุด, และราคาปิด จากช่วงเวลาที่กำหนด (เช่น วัน, ชั่วโมง, ฯลฯ) จุด Pivot และระดับต่างๆ เช่น R1, R2, R3 (ระดับการต้านทาน) และ S1, S2, S3 (ระดับการสนับสนุน) ถูกคำนวณออกมา แสดงบนแผนภูมิ : หลังจากคำนวณจุด Pivot และระดับต่างๆ, สคริปต์จะแสดงเส้นเหล่านี้บนแผนภูมิ MT4 เพื่อช่วยให้นักเทรดสามารถเห็นจุดที่

RaysFX Master Inside Bars Master Inside Bars : L’indicatore identifica una serie di “Inside Bars” consecutive, formando un “Master Inside Bar”. Puoi personalizzare il numero minimo di “Inside Bars” consecutive necessarie per formare un “Master Inside Bar”, così come il colore e la larghezza dell’istogramma del “Master Inside Bar”. Inside Bars : L’indicatore identifica le “Inside Bars”, candele che si trovano completamente all’interno dell’intervallo della candela precedente. Puoi personalizzare

RaysFX Auto Fibo
RaysFX Auto Fibo v2.1 è un indicatore di trading essenziale per tutti i trader che utilizzano la piattaforma MetaTrader 4. Questo strumento automaticamente disegna i ritracciamenti di Fibonacci sul tuo grafico, risparmiando tempo e fatica. Caratteristiche principali: Disegno automatico : Non dovrai più tracciare manualmente i livelli di Fibonacci. L’indicatore lo fa per te, risparmiandoti tempo e garantendo precisione. Personalizzabile : Puoi personalizzare il colore, lo stile

indicator named "MTRADER" designed to be used with the MetaTrader 4 trading platform. It appears to be a technical analysis tool for forex or stock market trading. Here's a breakdown of its key components and functionalities: Indicator Properties and Inputs : The code begins by setting up basic properties of the indicator, such as its name, version, and drawing styles. It defines two indicator buffers with blue and red colors, likely used for graphical representation on charts. Input parameters

RaysFX Auto TrendLine Linee di tendenza automatiche : L’indicatore disegna automaticamente le linee di tendenza sul tuo grafico, risparmiandoti tempo e fatica. Personalizzabile : Periodo (nPeriod) : Questo parametro determina il numero di barre che l’indicatore considera per il calcolo delle linee di tendenza. Ad esempio, se imposti nPeriod a 10, l’indicatore considererà le ultime 10 barre per disegnare le linee di tendenza. Un periodo più lungo renderà l’indicatore meno sensibile

RaysFX Reversal Bar RaysFX Reversal Bar è un potente strumento di trading progettato per la piattaforma MetaTrader 4. Questo indicatore è stato sviluppato per individuare le inversioni di mercato basate su un modello di candela specifico.
Caratteristiche principali: Rilevamento di inversioni : L’indicatore cerca specifici modelli di inversione di 2 barre nel mercato. Questi modelli includono una barra rialzista seguita da due barre ribassiste per un segnale di acquisto, e una barra ribassist

RaysFX 3 Stoch!
Sei un trader alla ricerca di un vantaggio competitivo? L’indicatore RaysFX 3 Stoch è l’aggiunta perfetta al tuo arsenale di trading. Caratteristiche principali: Stocastico a 3 livelli : L’indicatore RaysFX 3 Stoch utilizza tre livelli di stocastico per fornire segnali di trading accurati e tempestivi. Personalizzabile : Puoi personalizzare i periodi di K, D e Slowing, così come i periodi dei tre stocastici, per adattarsi al tuo stile di trading. Allerta integrata : L’in

forex indicator GRAY ZONE for gold xauusd use with price action and Breakout time frame 15 and 30 m platform mt4 use with price action and break good tp 20 use sl warning only for one account mt4 Trading risks must be taken into account New traders are always excited to jump into action. When you’re putting your hard earned money on the line, it’s important to make sure you’re equipped with a strong foundation. Learn the ins and outs of the market and test yourself with paper trading before

RaysFX Supertrend Bar RaysFX Supertrend Bar è un indicatore personalizzato per MetaTrader 4. Utilizza l'indice di canale delle materie prime (CCI) per generare segnali di trading. L'indicatore mostra dei puntini in una finestra separata sotto il grafico principale per indicare i segnali di trading. Caratteristiche principali: Calcola il CCI per diversi periodi temporali. Visualizza puntini per indicare i segnali di trading. Permette all'utente di modificare i periodi temporali e la distanza tra

RaysFX Candlestick Exit
Il RaysFX Candlestick Exit è un indicatore di trading avanzato progettato per i trader che desiderano avere un controllo preciso sulle loro uscite di trading. Questo indicatore utilizza una combinazione di tecniche di trading per fornire segnali di uscita accurati e tempestivi. Caratteristiche principali: Range : Questo parametro consente di impostare il range di candele considerate per il calcolo dell’indicatore. Shift : Questo parametro consente di spostare l’indicato

Subscribe to the 'MA7 Trading' channel to receive notifications about new programs, updates and other information. Ask questions in the profile on the MQL5 .
Description of work
The 'MA7 Ixora' indicator is based on the standard Moving Average (MA) indicator. Shows the intersection of the fast and slow moving averages. Detailed information about the 'MA7 Ixora' indicator.
Indicator settings
General settings: Consider the direction of the candle .
Fast moving average settings: Period – M

RaysFX Intraday Fibo RaysFX Intraday Fibo è un indicatore di trading Forex di alta qualità, progettato con precisione e attenzione ai dettagli. Questo indicatore è il risultato di anni di esperienza nel trading Forex e nella programmazione MQL4, ed è stato creato con l’obiettivo di fornire ai trader un vantaggio competitivo nel mercato. Caratteristiche principali: Precisione : L’indicatore RaysFX Intraday Fibo utilizza un algoritmo avanzato per identificare i punti di ingresso e di uscita ottima

RaysFX MACD Divergence
Presentiamo RaysFX MACD Divergence, un indicatore di trading avanzato progettato per i trader moderni. Questo indicatore utilizza la divergenza MACD, uno dei metodi più affidabili nel mondo del trading, per fornirti segnali di trading precisi e tempestivi. Caratteristiche principali: Divergenza MACD: L’indicatore identifica e traccia le divergenze MACD, fornendo segnali di trading potenzialmente redditizi. Personalizzabile: Puoi personalizzare i parametri dell’EMA veloce

Master Trend is a complete trading system for day traders, scalp traders and swing traders. The system consists of two indicators. A simple, clear set of rules ideal for both beginners and experienced traders. The Master Trend Strategy helps you to always be on the right side. It helps filter out the strongest trends and prevents you from trading in a directionless market. If the market is too weak or is in sideways phases, then the Magic Band shows different color It works well on all instrume

RaysFX WPR Strategy Indicator RaysFX WPR Strategy è un indicatore di strategia di trading basato sul calcolo del WPR (Williams Percent Range). Questo indicatore utilizza tre lunghezze diverse per il calcolo del WPR e pesa i risultati per fornire un valore complessivo del WPR.
Caratteristiche: - Calcola il WPR utilizzando tre lunghezze diverse (9, 33, 77) - Utilizza un sistema di pesi per combinare i tre valori del WPR in un unico valore - Genera alert in base al numero di alert impostato dall

This indicator accurately identifies and informs market reversals and continuation patterns by analyzing and signaling the Three White Soldiers / Three Black Crows pattern. It also offers a "real-time backtesting" panel in the indicator itself in a way that every change made on the indicator parameters will immediately show the user how many signals are occurred, how many take profits and stop losses were hit and, by having these informations, the Win Rate and the Profit Factor of the setup ba
Ciao commercianti.
Ti presento il mio miglior strumento di trading.
MTF PPAAF Modello T.
Multi time frame Freccia precisa dell'azione del prezzo filtrata Modello T.
Questo strumento di trading è il mio miglior lavoro dopo anni trascorsi a creare vari strumenti di trading.
Perché questo strumento di trading è il migliore e affidabile?
1. Questo strumento utilizza 6 indicatori:
Doppio CCI = CCI veloce x CCI lento Doppio stocastico = stocastico veloce (linea principale stoca

introduzione The Mighty Alligator - un indicatore che segue il trend che segue la premessa che i mercati finanziari e i singoli titoli presentano un trend solo dal 15% al 30% delle volte, mentre si muovono lateralmente nel restante 70% -85% delle volte. L'indicatore Mighty Alligator utilizza tre medie mobili livellate, fissate a cinque, otto e 13 periodi, che sono tutti numeri di Fibonacci. La media livellata iniziale viene calcolata con una media mobile semplice (SMA), aggiungendo ulteriori me
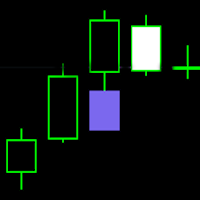
FVG - Fair Value Gap indicator is a three candle pattern indicator . It find inefficiencies or imbalances in market. It act as magnet before continue the trend.
indicator key function
1. No object is used to draw the plot. You can use this to build EA and backtest also.
2. Min and max value to Filter-out the noises .
It use as retest zone and can be use as entry price also. It popular among price action traders. your suggestion and comments are welcome and hopping that you will find th

Presentiamo HorizonFX, un oscillatore di mercato innovativo, progettato con precisione per i trader Forex alla ricerca di un vantaggio competitivo. Sviluppato a partire da una formula proprietaria, HorizonFX supera le metriche tradizionali, fornendo segnali di acquisto e vendita assertivi che aiutano a identificare i movimenti di mercato con maggiore precisione. Caratteristiche di HorizonFX: Calcolo Unico: Utilizza una combinazione esclusiva di variabili di mercato e matematica avanzata per gene

Subscribe to the 'MA7 Trading' channel to receive notifications about new programs, updates and other information. Ask questions in the profile on the MQL5 .
Description of work
The 'MA7 Hypnum' indicator is based on the standard Commodity Channel Index (CCI) indicator. Shows overbought and oversold zones. Detailed information about the 'MA7 Hypnum' indicator.
Indicator settings
General settings: Period – period of the CCI indicator; Apply to – price type for calculating the CCI indicator

The Positive Trend indicator is very reliable because it is based on moving averages. A feature of Trend Positive is the presence of a signal for entry/exit - the indicator line in a certain color indicates the signals "buy" or "sell". The accuracy of this signal is very high, matching 95% success to 5% failure. Trend Positive is also suitable for exiting a position. The indicator captures the trend almost completely, but during the flat it is necessary to use filters. When entering a positi

Creato utilizzando l'intelligenza artificiale, AI, per incorporare i modelli di comportamento visibili di un organismo vivente nell'analisi delle tendenze. La Teoria del Caos incontra la Media Mobile. L'anemone di mare filtratore estende i suoi viticci in un mare di sostanze nutritive per arricchirsi. Non vi farò perdere tempo con descrizioni troppo lunghe, il concetto è comprensibile in questi termini. Si tratta di una media mobile rotante di periodo personalizzabile che passa da semplice, espo

Volume indicator Effect Volume , in the Forex market volumes are unique (tick). This volume indicator demonstrates the level of financial and emotional involvement. When the indicator forms a new top, it indicates that buyers are stronger than sellers over a certain period of time. If the indicator decreases, this indicates that the bears are stronger.
Why is it impossible to track normal volumes in Forex? The fact is that this is an over-the-counter market. Consequently, it is practically im

The Trend Bureaucrat indicator helps analyze the market on a selected time interval. They define the prevailing trend. Easy to set up and works on all pairs and all time intervals. Trend indicators make it possible to classify the direction of price movement, determining its strength. Solving this problem helps investors enter the market on time and get good returns. For any trader, it is extremely important to correctly determine the direction and strength of trend movement. Unfortunately, ther
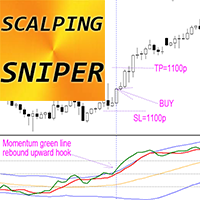
Forex Indicator SCALPING SNIPER for MT4 , No Repaint Trading System Scalping Sniper - is advanced system (indicator) showing accurate price momentum! Upgrade your trading methods with the professional Scalping Sniper Indicator for MT4. This system provide very accurate but rare sniping signals, with win rate up to 90% System suppose to use many pairs to search for signals to compensate low number of signals per one pair. Scalping Sniper consist of: Top & Bottom Volatility lines (Blue colo
Introducing the Ultimate Beast Super Signal Indicator Scanner Dashboard!
Are you tired of missing out on profitable trading opportunities in the fast-paced world of Forex? Say goodbye to guesswork and hello to precision with our cutting-edge Beast Super Signal Indicator Scanner Dashboard!
What is it?
Our Beast Super Signal Scanner Dashboard is the game-changer you've been waiting for. It is designed to work seamlessly with the renowned Beast Super Signal Indicator, a trusted tool among

--- INTRODUCTION ---- This indicator is to measure the strength of BULL and BEAR. The formulars are based on Price Change and Volume for period of time.
---- HOW TO READ ---- GREEN BAR = BULL is stronger than BEAR ----> Strong GREEN = Strong Buying Volume ----> Light GREEN = Weakening Buying Volume (BULL Still in control)
RED BAR = BEAR is stronger than BULL ----> Strong RED = Strong Selling Volume ----> Light RED = Weakening Selling Volume (BEAR Still in control)

Данный индикатор представляет из себя комплекс из 4 индикаторов в правом углу состоящий из RSI,Stochastic,Envelope и MACD, показывающий данные на различных таймфреймах, настройки данных индикаторов вы можете изменить в параметрах, сигналы на вход основан на индикаторах силы быков и медведей, данные сигналы используются и в роботах, скрины прилагаю, желающим, скину бесплатно

Exclusive Limited Time Offer! Grab this useful indicator for a lifetime at just $65. Elevate your trading experience with the IQ RSI Dashboard Indicator, your go-to tool for monitoring RSI value and Overbought, and Oversold signals across 10 currency pairs and all timeframes starting from 1M to Monthly. Indicator Features:
Comprehensive Signal Display: Effortlessly track RSI values for 10 symbols across 9 different timeframes, providing a comprehensive overview of market conditions. Flexible
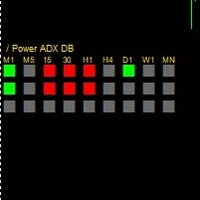
This is a trend indicator based on ADX and some other oscillators, the indicator change colors on strong trend directions, this indicator is most suitable for scalping purposes, if the lower timeframe shows opposite direction to the higher timeframe direction , the move may act as a retracement. And the lower squares of the indicator uses a higher ADX period, upon their change on color move may be exhausted.
The "Scalper M5 system" is a powerful tool designed for scalping strategies in the forex market. With an accuracy of up to 95%, this indicator provides reliable signals for opening trades without repainting. It employs a simple yet effective approach to identify short-term trading opportunities, making it suitable for traders of all levels. The indicator's algorithm considers various factors such as price momentum, volatility, and market trends to filter out false signals and deliver high-prob

TrendCompass is a powerful indicator for trading in the currency and cryptocurrency markets on the MetaTrader 4 platform. This innovative tool is designed to simplify analysis and decision-making in trading. The indicator combines various technical indicators and algorithms to provide accurate and timely trading signals. Key Features:
Multilevel Strategy: TrendCompass is based on a comprehensive strategy that includes analyzing major trends, support and resistance levels, and various technical

Volume Horizon is a horizontal volume indicator that allows you to observe the density of market participants' volumes across various price and time intervals. Volume histograms can be constructed based on ascending or descending market waves, as well as individual bars. This tool enables more precise determination of entry or exit points, relying on levels of maximum volumes or volume-weighted average prices (VWAP).
What makes Volume Horizon unique? 1. Segmentation into ascending and descend
The Xeon indicator was created to display the trend in a visual form. One of the main definitions for monitoring the currency market is trend. A trend is a stable direction of price movement. To find it, the indicator uses calculations designed to smooth out sharp fluctuations that do not affect the overall picture of price movement.
The indicator was created for those who value their time and money.
A trend can be increasing (bullish trend) or decreasing (bearish trend). In most cases, a t

The Trend Prior indicator ignores sharp fluctuations and market noise and tracks market trends. Suitable for trading on small and large time frames, it ignores sudden price jumps or corrections in price movements by reducing market noise around the average price value. The indicator works on all timeframes and currency pairs. The indicator gives fairly accurate signals and is commonly used in both trend and flat markets. It is advisable to use the indicator in conjunction with other tools for m
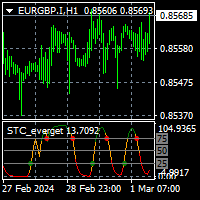
To get access to MT5 version please click here . This is the exact conversion from TradingView: "Schaff Trend Cycle" by "everget". This is a light-load processing indicator. This is a non-repaint indicator. Buffers are available for processing in EAs. All input fields are available except fillings(due to MT4 graphical restrictions). You can message in private chat for further changes you need. Thanks for downloading
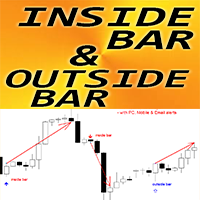
Forex Indicator " Inside Bar & Outside bar Patterns" for MT4 Indicator " Inside Bar & Outside Bar Patterns " is very powerful for Price Action trading Indicator detects Inside Bar and Outside bar Patterns on chart: Bullish pattern - Blue arrow signal on chart (see pictures) Bearish pattern - Red arrow signal on chart (see pictures) No repaint; No delays; Inside Bar itself has High R/R ratio (reward/risk) with PC, Mobile & Email alerts Indicator " Inside Bar & Outside Bar Patterns

RiKen: Rivoluzionare l'analisi tecnica con precisione e affidabilità provate Scopri RiKen, uno strumento di analisi tecnica innovativo progettato per trasformare la tua esperienza di trading. Questo indicatore ridefinisce il mercato finanziario elevando lo standard dell'analisi tecnica grazie alle sue caratteristiche uniche: Impressionante precisione del 70% : RiKen si distingue fornendo segnali di acquisto e vendita con un tasso di precisione notevole del 70%. Questa precisione è un bene inesti

Renko Star è un indicatore di tipo freccia mt4 progettato per scambiare grafici renko, questo indicatore ha un dashboard di backtest che fornisce al trader informazioni utili come tasso di vincita e punti vinti, fornisce anche tp e sl nella moltiplicazione atr x, questo indicatore dà il suo segnale sulla barra aperta o intra bar e ha un segno giallo che segnerà il prezzo esatto in cui è stato dato il segnale, il modo per utilizzare questo indicatore è aprire un acquisto o una vendita secondo la
This indicator is based on the work of legendary trader William Gann, specifically using mathematical models and data from past days. It calculates potential time for a reversal based on selected parameters for the current day. The time is displayed in the future, at the opening of the day and does not change thereafter. The indicator also includes alerts when potential reversal time approaches. An algorithm for possible price movement is built into the indicator. When the time comes, an alert i

This indicator identifies and displays zones, as it were areas of strength, where the price will unfold. The indicator can work on any chart, any instrument, at any timeframe. The indicator has two modes. The indicator is equipped with a control panel with buttons for convenience and split into two modes. Manual mode: To work with manual mode, you need to press the NEW button, a segment will appear. This segment is stretched over the movement and the LVL button is pressed. The level is displayed

The indicator is designed to work on any trading platform. The program is based on proprietary algorithms and W.D.Ganna's mathematics, allowing you to calculate target levels of price movement based on three points with the highest degree of certainty. It is a great tool for stock trading. The indicator has three buttons: NEW - call up a triangle for calculation. DEL - delete the selected triangle. DELS - completely remove all constructions. The probability of achieving the goals is more than 80

The " Unforgettable Trend " indicator is a hybrid trend indicator that combines signals from elementary indicators with a special analysis algorithm. Its main task is to show the moments most favorable for entering the market, based on the current trend.
Main characteristics:
Algorithm and noise filtering: The indicator works as the main tool for determining the current trend in the market. Built-in intelligent algorithm allows you to filter out market noise and generate accurate input sign
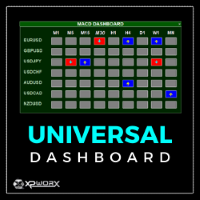
The UNIVERSAL DASHBOARD indicator will eliminate the need of using dozens of indicators on dozens of charts. From one place you can monitor all the pairs and all the timeframes for each of the following indicators: MACD STOCHASTIC WPR RSI CCI You can also use any Custom indicator in the dashboard as long as it has a readable buffer. With a single click you can quickly navigate between charts, pairs and timeframes. Alerts will provide clear indication about what happens for your favorite pairs on

The trading indicator we've developed analyzes real-time price action to identify bullish or bearish trends in the financial market. Using advanced algorithms, the indicator automatically plots an upward line when it detects a bullish trend and a downward line in the case of a bearish trend. These lines provide traders with a quick and clear view of the potential direction of market movement, helping them make informed decisions in their trades. Each time a new candle forms on the chart, the ind

L'indicatore mostra i punti pivot giornalieri. È possibile specificare il numero di giorni da visualizzare. Per il forex non considera i dati della sessione domenicale. È possibile modificare il colore, lo stile e la larghezza per ogni livello. È meglio utilizzare questo indicatore con un intervallo di tempo non superiore a Н1. 4 Livelli di supporto e resistenza con anche Livelli Intermedi che è possibile nascondere.
Trading sui pivot:
Perno 1.pp
2. r1 r2 r3, s1 s2 s3
I punti pivot so

Subscribe to the 'MA7 Trading' channel to receive notifications about new programs, updates and other information. Ask questions in the profile on the MQL5 .
Description of work
The 'MA7 Aster' indicator is based on the standard Moving Average (MA) indicator. Shows the price deviation from the moving average. Detailed information about the 'MA7 Aster' indicator.
Indicator settings
General settings: Period – MA period; Method – MA method; Apply to – price type; Minimum distance – minimum d

Forex Indicator PINBAR Pattern for MT4 Indicator " PINBAR Pattern " is very powerful indicator for Price Action trading: No repaint, No delays; Indicator detects PinBars on chart: Bullish PinBar - Blue arrow signal on chart (see pictures) Bearish PinBar - Red arrow signal on chart (see pictures) P C, Mobile & Email alerts are included Indicator "PINBAR Pattern" is excellent to combine with Support/Resistance Levels: https://www.mql5.com/en/market/product/100903 // More gre
Introduzione all'Indicatore di Intervallo di Coerenza Definitivo per le persone che utilizzano una Prop Firm con una Regola di Coerenza: Uno Strumento Indispensabile per Navigare le Regole di Coerenza della Prop Firm! Utilizzi una prop firm che applica una regola di coerenza? Il nostro calcolatore di pagamenti all'avanguardia è indispensabile per MetaTrader 4. Questo potente strumento è la chiave per mantenere la disciplina, garantire l'allineamento strategico e massimizzare il tuo potenziale d

WELCOME TO MQ4.ORG. WE ARE HERE TO INTRODUCE THE TRADING RANGE INDICATOR FOR TRADERS FOR ACCURATE ENTRY AND EXIT . GET BETTER RESULTS, USE OUR INDICATORS AND INCREASE THE SCALABILITY. ADVANTAGES OF MQ4.ORG TRADING RANGE INDICATOR Clear Entry and Exit Points : Range trading provides precise entry and exit points based on established support and resistance levels. Traders can use technical indicators to identify these levels, allowing them to enter trades with precision. Reduced Market Noise

Barry Hood's leading trend indicator is designed to more accurately determine the direction of the trend in financial markets. Here are the main characteristics and operating principles of this indicator:
Adaptive Four-Level Smoothing: The indicator uses a mechanism that allows it to effectively adapt to changing market conditions. This allows you to more accurately determine the current trend.
Characteristics and features: Redraws only on the zero candle: This means that the indicator is r

The Angle Prices indicator is a tool that calculates the price angle based on price analysis, interpreting the time vector in the form of price points on the price chart. In other words, the X axis and Y axis are represented as price points, so you can actually calculate the angle with two axes of the same dimension. This allows traders to obtain information about the direction of price movement and possible entry or exit points for trades. Let's look at the main characteristics and interpr

RaysFX DrawProfit RaysFX DrawProfit è un indicatore MQL4 progettato per i trader che desiderano visualizzare in modo efficiente sul grafico tutti i risultati delle posizioni chiuse: profitto o perdita. Se imposti DrawProfit sul tuo grafico gestito da un Expert Advisor (EA), potrai vedere chiaramente le sue prestazioni attraverso i suoi profitti e perdite. Caratteristiche principali Visualizzazione del profitto : Mostra il profitto in valuta, pips o entrambi. Filtro magico : Filtra gli ordini in

1. Going offline means that the market is in a wait-and-see state. In this situation, it is common to choose to wait and see rather than taking immediate action to wait for more market information or trend confirmation in order to make wiser decisions. 2.When there is a trend of going up and down, the market shows a bullish signal. At this point, investors may consider entering the market in hopes of future price increases and profits. 3.When the market situation is online, it will once again t

Indicator for determining the trend. The arrows and lines on the chart show the price reversal and the probable current trend or correction. You should always trade in the direction of the arrow. It is best to use the indicator on several time frames at once and enter the market when all time frames have the same arrow. For example, we open a sell trade if there is a red arrow on the M5, M30 and H4 timeframes. Or we open a buy deal if the indicator shows a blue arrow on all timeframes.
Advant

Super Entry è un indicatore di tipo freccia tutto in uno in cui fornisce segnali lunghi e brevi solo sui livelli tp e sl che si basano sul valore ATR e possono essere modificati e ottimizzati, questo indicatore fornisce un pannello di backtest che mostra il tasso di vincita e altre statistiche per dare una visione chiara di quanta precisione aspettarsi.
questo indicatore non si ridipinge o si retrovernicia e il segnale arriva a barra aperta senza ritardo.
Parametri:
impostazioni: valori d

The well-known ZigZag indicator that draws rays based on the “significant movement” specified by the pips parameter. If a ray appears, it will not disappear (the indicator is not redrawn), only its extremum will be updated until the opposite ray appears. You also can display text labels on each rays describing the width of the ray in bars and the length of the ray in points.

Review your trades is important key to succeeed in trading, with my tool it will be very easy to review all your trades. Just load my tool and load the account history.
It will show where and when entered and exited.
And one of the key ways to continually improve and iterate on our trading is to review our past trades and trading performance as a whole. Because you won’t notice the mistakes in the moment. And you can’t take a big picture view when you’re focusing on the micro aspects of eac

The indicator analyzes the chart as a mathematical function with X-time and Y-price axes. Time is presented in bars, price in pips. The purpose of the analysis is to give the user a signal to action at the moment when the function forms a recoilless movement in one direction over a certain period of time. The indicator parameters must be selected for each currency pair, since the price function is formed differently for each currency pair.
Shows favorable moments for entering the market with
Download the free USDJPY version here.
MACD Indicator The Moving Average Convergence and Divergence (MACD) is a trend following momentum indicator which shows the relationship between two moving averages that we chose and configure them on the indicator. The MACD is calculated by subtracting the 26-period exponential moving average and the 12 period D.A.M. These are the default parameters when you put the MACD indicator on the charts, and the period is usually 9 which means the last 9 candle

This indicator is, without a doubt, the best variation of the Gann Angles among others. It allows traders using Gann methods to automatically calculate the Gann angles for the traded instrument. The scale is automatically calculated when the indicator is attached to the chart. When switching timeframes, the indicator recalculates the scale for the current timeframe. Additionally, you can enter your own scales for the Gann angles. You can enter your own scales either for both vectors or for each

The ZigZag Wave Entry Alert (ZWEA) is a sophisticated technical indicator designed by Azad Gorgis, aiming to assist traders in identifying optimal entry points within the volatile forex market. This indicator specifically targets the EUR currency pairs, leveraging ZigZag patterns to predict future price movements. The ZWEA operates by analyzing historical price data to detect significant price changes that deviate beyond a predefined threshold, effectively filtering out minor price fluctuations
L'indicatore di segnale Space signals è il mio nuovo sviluppo per il trading nei mercati FOREX e delle opzioni binarie. L'algoritmo dell'indicatore è registrato in modo che rintracci la tendenza e segnali alla fine del movimento correttivo dei Prezzi.
Nelle impostazioni, puoi impostare tu stesso il periodo dei segnali. Maggiore è il valore nella variabile "periodo", più rari saranno i segnali. Ma saranno naturalmente di qualità superiore.
Puoi anche selezionare i codici delle frecce sul gr
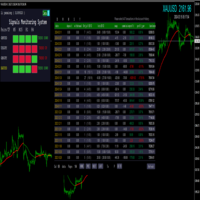
MT4 multi-variety multi-period signal monitoring system
Load to the indicators folder
Recommended loading chart: GBPUSD/XAUUSD/GBPJPY/USDJPY
Recommended loading period: M5/M15/H1/H4
Select all history by account history
- Statistics: Date, deposit, withdrawal, total number of transactions, number of transactions - long, number of transactions - short, total number of transactions, number of transactions - long, number of transactions - short, interest, commission, profit and loss, pro

Smooth Heikin Ashi provides a more smoothed signal of bull or bearish trends than regular Japanese candlesticks, or even the standard Heikin Ashi candles. Heikin Ashi as an alternative candlestick pattern that has been in use since its invention in Japan back in the 1700s. On normal Japanese candlesticks, there is a lot noise with mixed bearish and bullish candles side by side, even during trends. Heikin Ashi reduces this noise leaving an easier visual representation of trends. This indicator is
MetaTrader Market - i robot di trading e gli indicatori tecnici per trader sono disponibili nel tuo terminale di trading.
Il sistema di pagamento MQL5.community è disponibile per tutti gli utenti registrati sul sito MQL5.com che effettuano transazioni su MetaTrader Services. Puoi depositare e prelevare denaro usando WebMoney, PayPal o una carta di credito.
Ti stai perdendo delle opportunità di trading:
- App di trading gratuite
- Oltre 8.000 segnali per il copy trading
- Notizie economiche per esplorare i mercati finanziari
Registrazione
Accedi
Se non hai un account, registrati
Consenti l'uso dei cookie per accedere al sito MQL5.com.
Abilita le impostazioni necessarie nel browser, altrimenti non sarà possibile accedere.