Regardez les tutoriels vidéo de Market sur YouTube
Comment acheter un robot de trading ou un indicateur
Exécutez votre EA sur
hébergement virtuel
hébergement virtuel
Test un indicateur/robot de trading avant d'acheter
Vous voulez gagner de l'argent sur Market ?
Comment présenter un produit pour qu'il se vende bien
Nouveaux indicateurs techniques pour MetaTrader 5 - 12

Indicator Name: Probability Indicator Description: The Probability Indicator is a powerful tool for traders who want to identify buying and selling opportunities based on the analysis of previous candles. This indicator calculates the probability of rise (CALL) and fall (PUT) based on the number of candles analyzed and displays arrows on the chart to signal possible entry points. Features: Candle Analysis: Analyzes a configurable number of candles to calculate the probability of rise and fall. V
Heat Map Indicator - Advanced Volume Analysis
Introducing the Heat Map Indicator - A Professional Tool for Market Volume Analysis!
**Key Features**
**Visual Heat Map** - Instant volume intensity visualization through colors - Blue: Low volume - Green: Medium volume - Yellow/Orange: Increasing volume - Red: High volume
**Intuitive Interface** - Dynamic color scale - Real-time percentage indicator - Current level indicator - Customizable colors and transparency
**Smart Alert System** - Custo

Switching between charts to analyse market trends across multiple timeframes can quickly become a tiresome task. Finding confluence (alignment across timeframes) is essential to making informed trading decisions. This innovative indicator simplifies the process, allowing you to see trends on multiple lower timeframes directly from a higher timeframe chart. With this indicator, you can monitor four Heiken Ashi setups running simultaneously, each on a different timeframe. The result is a clear, la
Introducing the manual trading system "Flexi trend tracker indicator" — a powerful instrument for hour+ timeframes trading with medium/soft volatility pairs! This system offers unique features: wide range of applications: This strategy can be used on various time intervals: H1, H2, H3, and H4 timeframes, making the trading advisor a highly versatile tool for trading. the system works on comfortable USD crosses: USDCAD, USDCAD, and USDCAD pairs where you won't see overwhelming trends that wipe
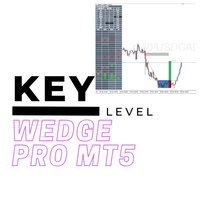
Its our anniversary! To give back enjoy this 60% discount for the next week (original price $239)
We have combined all of our beloved indicators the likes of: Key level order block , Key level supply and demand , Key level liquidity grab and Key level wedge into one single indicator and dashboard.
Whats new Dashboard : There is an easy access dashboard for all your needs. Multi-timeframe button : There is now a multi-timeframe option for Order Blocks and Supply and demand zones, maki
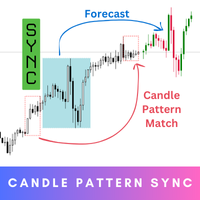
Candle Pattern Sync is your ultimate tool for precision and insight in trading. Step into the future of trading with this innovative indicator that’s designed to help you understand market behavior by analyzing historical patterns and giving you an idea of what might come next. While the forecasts provide valuable probabilities based on history, they’re not guarantees – think of them as a powerful guide to inform your decisions, not a definitive answer. MT4 Version - https://www.mql5.com/en/m
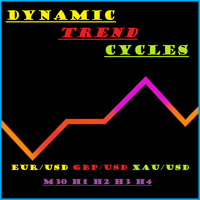
Introducing the unique trading system Dynamic trend cycles oscillator (DTC) — a powerful tool for H1-H4 trading with volatility pairs !
Technical capabilities - pairs to trade : EURUSD,GBPUSD,XAUUSD; - timeframes : M30,H1,H2,H3,H4;
Why Choose DTC? - Accurate Trend Analysis: DTC adapts to current market volatility, providing precise tracking of price trends. This allows you to confidently open positions in line with the main trend and maximize your profits. - Filtering False Signals: In times
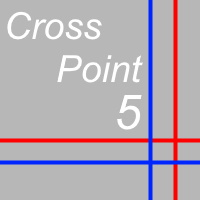
CrossPoint5 is an indicator that helps novice traders.
In addition to the standard "Crosshair" function (Ctrl + F), CrossPoint5 will show you how to set the StopLoss and TakeProfit levels correctly, taking into account the minimum allowable level, calculate the number of points between two points and convert this into the currency of the account, taking into account the expected lot of the transaction.
Sometimes, when opening a deal, a novice trader completely forgets about the spread.

Présentation : Découvrez une version avancée de l'indicateur Stochastic Oscillator, conçue pour les traders exigeants. Cet outil intègre des alertes sonores et visuelles pour des croisements à des niveaux spécifiques, vous offrant une analyse précise et des signaux clairs pour optimiser vos décisions de trading. Caractéristiques Clés : Alertes Sonores : Signal audio automatique lors d'un croisement haussier (%K croisant %D de bas en haut) entre les niveaux 0 et 60. (Paramètre Ajustable) Signal a

If you love this indicator, please leave a positive rating and comment, it will be a source of motivation to help me create more products <3 Key Takeaways Bulls Bears Eyes is another version of Laguerre RSI. Use Bull/Bear Power to calculate. One use of the Bulls Bears Eyes is to identify trends. This is done by looking for sustained periods when the indicator is above or below the 0.5 line. Also, a buy signal is generated when the Bulls Bears Eyes line crosses above the 0.15 level, while a s
FREE
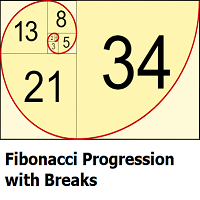
This indicator highlights points where price significantly deviates from a central level. This deviation distance is determined by a user-set value or using a multiple of a period 200 Atr and is multiplied by successive values of the Fibonacci sequence. Settings
Method: Distance method, options include "Manual" or "Atr"
Size: Distance in points if the selected method is "Manual" or Atr multiplier if the selected method is "Atr"
Sequence Length: Determines the maximum number of significant devia
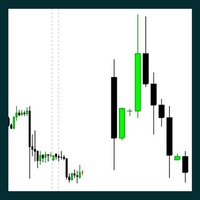
The Indicator is useful for professional trader, such as ICT , Smart Money Concept trader; who do the top-down analysis and want to display the candles of the Higher Timeframe on the Lower Timeframe. It allows you to stay in your entry timeframe while following the narrative of the Higher timeframe. Here are some easy input: Number Of Bars: The total of HTF's candle you want to display. Auto Timeframe: If true, the indicator will recommend the Higher timeframe that suit the current timeframe you

This is the Parabolic Dashboard MT5. This dashboard will scan multiple timeframes and symbols in MT5 platform, from M1 chart to D1 chart. It will send the buy/sell signals by alert on the platform or sending notification to your phone or message you via a email.
The buy signal is generated when the SAR changes its position from above to below of the candle. The sell signal is is generated when the SAR changes its position from below to above of the candle. The up/down trend color will be disp
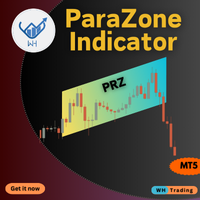
The ParaZone Indicator MT5 helps you spot areas where price trends are likely to reverse. It marks these zones on your chart using a unique parallelogram shape, making it easier to find the best points to enter or exit trades. Whether you’re a beginner or experienced trader, this tool can help improve your trading decisions. Key Features: Accurate Reversal Detection: Identifies key zones where price may change direction. Dynamic Zone Adaptation: Zones adjust in real-time to follow market movemen

The Gann Scalping Gold Indicator is a robust technical analysis tool designed for precision trading in gold markets. It leverages Gann-based methodologies to identify key price levels, enabling traders to anticipate potential market reversals, breakouts, and areas of consolidation. Daily Reset Logic: Automatically resets touch statuses at the start of a new trading day, ensuring that the indicator aligns with fresh daily trends. How It Works: The indicator draws horizontal lines at predefine
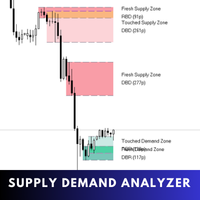
Supply Demand Analyzer is an advanced trading indicator meticulously designed for the precise identification, analysis, and management of supply and demand zones. By integrating real-time data and advanced algorithms, this tool enables traders to recognize market phases, price movements, and structural patterns with unparalleled accuracy. It simplifies complex market dynamics into actionable insights, empowering traders to anticipate market behavior, identify trading opportunities, and make in
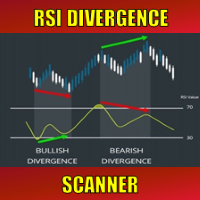
Special offer : ALL TOOLS , just $35 each! New tools will be $30 for the first week or the first 3 purchases ! Trading Tools Channel on MQL5 : Join my MQL5 channel to update the latest news from me Sur les marchés financiers dynamiques, identifier les signaux de renversement de tendance est essentiel pour un trading efficace. Le RSI Divergence Scanner est conçu pour vous aider à détecter avec précision et efficacité les signaux de divergence RSI sur diverses paires de devises et di
FREE
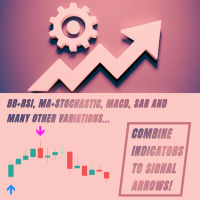
C'est un constructeur. C'est-à-dire le créateur de stratégies. Et pas seulement. Il s'agit d'un indicateur de signal pour la plupart des indicateurs standard intégrés dans MetaTrader 5. Combinez vos indicateurs dans une flèche de signal. Par exemple, vous avez une stratégie et vous devez connaître sa rentabilité, inclure les éléments nécessaires dans le menu et obtenir des statistiques. Et si vous n’avez pas de stratégie, utilisez-la sur Internet ou créez la vôtre. Rigonstruktor vous aidera avec
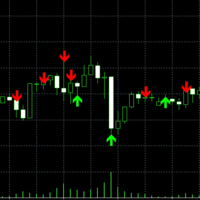
Cet indicateur met en évidence les points où la tendance d'une barre s'inverse en raison d'une pression soudaine, même lorsque la tendance générale est à la hausse ou à la baisse. La flèche affichée par l'indicateur est basée sur l'évaluation de la barre précédente, qui doit répondre à certains critères pour qu'un changement de tendance soit signalé. Lors de l'élaboration de votre stratégie, vous pouvez interpréter 3 ou 4 flèches consécutives dans la même direction comme un signal de possible ca
FREE

Précision des signaux d'entrée : L'indicateur utilise des algorithmes avancés pour identifier les modèles du marché et générer des signaux d'achat et de vente avec une grande précision. Idéal pour le scalping : Parfaitement adapté aux périodes de M15 à H4, fournissant des signaux rapides et efficaces, idéaux pour les transactions à court terme. Analyse automatisée : Le Golden Arrow Scalper effectue une analyse détaillée du marché pour identifier les points d'entrée avantageux. Facile à utiliser
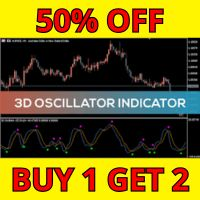
Les 7 Avantages du 3D Oscillator Une Perspective Triple sur le Marché :
Le nom "3D Oscillator" n'est pas un hasard. Il intègre trois indicateurs reconnus (RSI, Stochastique et CCI) dans un seul panneau. Cette combinaison offre une vision tridimensionnelle du marché, vous aidant à repérer les tendances cachées et à éviter les pièges. Paramètres Personnalisables :
Avec des paramètres ajustables tels que D1RSIPer, D2StochPer et D3tunnelPer, cet indicateur s’adapte à tous les styles de trading, qu

Fibonacci Probability : La Puissance de l'Analyse Technique à Votre Portée Transformez votre analyse de marché avec l'indicateur Fibonacci Probability, un outil essentiel pour les traders qui souhaitent identifier des niveaux critiques de support et de résistance avec une précision millimétrique. Développé sur la base des principes de la séquence de Fibonacci, cet indicateur offre une analyse complète des mouvements du marché, vous aidant à prendre des décisions plus informées et stratégiques. F
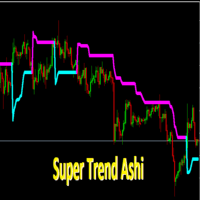
SuperTrendAshi Description SuperTrendAshi is an advanced and optimized version of the SuperTrend indicator that incorporates Heikin Ashi calculation to provide smoother and more reliable signals. This unique combination results in an indicator that reduces false signals and identifies trends with greater precision. Key Features Combines the strength of SuperTrend with Heikin Ashi smoothing More stable signals with less noise Intuitive color system (Aqua for uptrend, Magenta for downtrend) Custo
FREE

The Quantum DELTA indicator for MetaTrader 5 (MT5) – a powerful volume analysis tool that stands out with its capabilities and accuracy. Indicator Description The Quantum DELTA indicator is designed for volume analysis in a separate MT5 window. Its main task is to identify and display divergences, allowing traders to make more informed and timely decisions. Indicator Features Volume Analysis : The indicator analyzes volumes in financial markets, allowing you to see how volumes are distribute
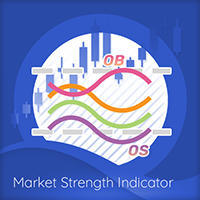
The Market Strength Indicator (MSI) is yet another in our stable of volume-based indicators, and as such, is a must-have tool for trading virtually any type of market and across a myriad of applications from trend trading to swing trading, scalping, and much more. While its sister indicator, the Currency Strength Indicator (CSI), helps you analyze which currencies are oversold, overbought, correlating, and trending, the MSI or Market Strength Indicator does this also, but in this case, for all m

The VRSI indicator is another in the suite of volume indicators we have developed and one that complements our volume price analysis methodology perfectly. and was developed out of a desire to build further on our cornerstone of VPA by peeling back the layers of volume and considering the relative aspect of volume. Hence, the acronym of Volume Relative Strength Index indicator encapsulates what the indicator is all about. By analyzing relative volume, we are able to see a visual representation o

The VWAP indicator is another of our suite of volume indicators and one which was first referred to in 1988 when it appeared in an article entitled “The Total Cost Of Transactions On The NYSE” in the March edition of the Journal Of Finance from that year, which went on to explain its importance, particularly from an institutional perspective, which underpins its significance in appreciating the power and importance of this indicator. In many ways, it is akin to the volume price analysis methodol

In the rapidly changing financial markets, finding reliable trading signals is the key to success!
In trading, the timing of entry is everything!!
Whether you are a short-term trader or a long-term investor, this indicator can provide you with the most accurate entry signals, helping you to seize market opportunities and become your most powerful trading assistant!
MT4: https://www.mql5.com/en/market/product/129945
Features: Accurate Entry Signals: Based on advanced algorithms and real-tim
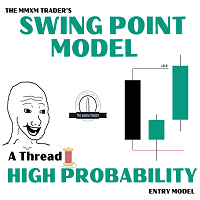
Introducing the Swing Point Model Indicator – A Professional Trading Tool The Swing Point Model Indicator is an innovative tool designed for traders who want to capture market structure and identify potential trading opportunities. With a logical and transparent approach, the Swing Point Model helps you gain deeper market insights and make precise trading decisions. This is multiple Timeframe indicator so you can choose Higher timeframe for detect Swing point model What Is the Swing Point Model?

This strategy focuses on identifying and following clear market trends by filtering out noise and short-term fluctuations. Using advanced algorithms, it highlights significant upward and downward movements, enabling traders to make data-driven decisions. The indicator is designed for simplicity and precision, ideal for traders who prefer a systematic approach to trend trading. Whether you're a beginner or an experienced trader, this tool helps you stay aligned with the dominant market direction

The Fibonacci Confluence Toolkit is a technical analysis tool designed to help traders identify potential price reversal zones by combining key market signals and patterns. It highlights areas of interest where significant price action or reactions are anticipated, automatically applies Fibonacci retracement levels to outline potential pullback zones, and detects engulfing candle patterns. Its unique strength lies in its reliance solely on price patterns, eliminating the need for user-define
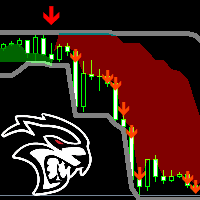
Non repaint color trend channel lower and upper bands show the current support and resistance once price touches the lower band Blue Arrow will appear and a green color indicating a bullish trend is your buy entry. the arrow will not disappear. once price touches the upper band Red Arrow will appear and a red color indicating a bearish trend is your sell entry. the arrow will not disappear. the trend channel is made for all timeframes and works on all pairs.
Simple indicator to show Breakeven line for all orders on attached chart pair. This indicator also comes with additional information such as Total Lot Size, Floating Drawdown in account's currency and Number of open positions and Difference from current price in Points. Do you use DCA (dollar cost average) or Hedging approach on your trading? Then this indicator you MUST have. Really useful, when you have multiple orders (hedging), this can help you quickly identify breakeven point without calc
FREE

Great For Binary options. Works on all timeframes. Recommended for M5 timeframe. one candle expiry. Experienced traders can explore. Strategy is based on price action and multi timeframe analysis. Recommended During high volatility sessions, like the London and new York sessions. For the M1(One minute) timeframe, Traders can use four or five candle expiry, this means it can be applied for 4, 5 or more minutes expiry. For forex traders, I tested the indicator with the JesVersal universal EA:
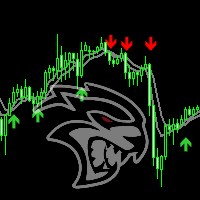
Highly advanced moving average - NON-REPAINT - Fast entries without lag. - Works on all timeframe recommended M5 AND M15 Orange arrow is a sell entry exit on opposite signal with is green arrow. Green arrow is a buy entry exit on opposite signal with is orange arrow. the ma will show double green arrows which indicates a strong up trend. the ma will show red arrows which indicates a strong down trend. Works on all pairs Low spread broker is highly recommended
Engulfing Pattern Indicator Introducing the Engulfing Pattern Indicator! Are you ready to take your trading strategy to the next level? The Engulfing Pattern Indicator is your ultimate tool to spot powerful market reversals and trends based on the time-tested Engulfing Candlestick Pattern. This indicator is crafted to provide you with actionable insights, but remember: it’s not optimized—you have the freedom to optimize it to suit your trading needs! Why the Engulfing Pattern?
The Engulfing Pat

Unlock the Power of Precision with the Storm Peak Indicator! The Visual Storm Peak Indicator is a sophisticated, signal-driven tool designed for traders who seek clear and actionable market insights. It's built on a robust logic foundation, leveraging the Commodity Channel Index (CCI) to identify market peaks and reversals effectively. While the indicator comes with a pre-set structure, it has been specifically created for you to optimize and adapt to your unique trading style. Why Choose the S

Wind Shift Indicator Are you ready to harness market shifts with precision? The Wind Shift Indicator is your tool for identifying potential reversals and trend continuations. Designed for traders who prefer to fine-tune their tools, this indicator is not optimized, giving you the freedom to tailor it to your unique trading style. Logic Behind the Strategy: The Wind Shift Indicator employs a combination of Commodity Channel Index (CCI) logic and visual signal plotting to detect shifts in market

Unoptimized and Designed for You to Customize
The Mercury Track Indicator is a powerful trading tool created with flexibility in mind, allowing you to tailor it to your trading strategies and market conditions. Out of the box, it provides insightful signals, but it’s meant for traders to optimize and enhance according to their unique preferences and trading styles. Logic Behind the Strategy
At its core, the Mercury Track Indicator employs a combination of signal generation and dynamic band plot

Unleash the Power of the Neptune Blast Indicator!
The Neptune Blast indicator is your ultimate tool for identifying market breakouts and trend directions. Built on the proven Donchian Channel strategy, it combines visual clarity with precise logic to help you spot potential trading opportunities. Not Optimized, Built for YOU to Optimize!
This indicator is intentionally left unoptimized, empowering you to fine-tune it to match your trading style and strategy. Whether you’re a seasoned trader or

Take control of your trading decisions with the 'Visual Venus Guard Indicator'! This advanced indicator offers a versatile framework designed to assist you in identifying potential market turning points. Created with a focus on customization, it empowers YOU to optimize it according to your unique trading strategy. The Strategy Behind the 'Visual Venus Guard Indicator'
The 'Visual Venus Guard Indicator' uses a comprehensive algorithm to identify critical price zones and reversal patterns, provi

Bronze Path Indicator The Bronze Path Indicator is a powerful yet customizable trading tool designed to help traders identify potential market opportunities using advanced technical analysis. This indicator provides a clear visual representation of buy and sell signals, ensuring traders can make informed decisions based on market conditions. Please note that this indicator is not optimized; it is created for you to fine-tune and optimize it according to your trading strategy and preferences. Ho

Diamond Wall Indicator
The Visual Diamond Wall Indicator is a sophisticated tool designed to help traders identify critical levels of support and resistance with precision. Please note, this indicator is not optimized—it’s purposefully crafted to empower you to tailor and optimize it for your unique trading style and strategies. Core Strategy & Logic:
The indicator leverages dynamic algorithmic analysis to detect "diamond wall zones" in the market. These zones act as pivotal price levels where

Empower Your Trading with the Visual Silver Turn Indicator! The Visual Silver Turn Indicator is designed to identify pivotal market turning points with precision. By analyzing price action dynamics and trend shifts, this indicator provides traders with an intuitive tool to locate potential reversal zones and opportunities. Perfect for traders looking to gain insights into market behavior, the Visual Silver Turn Indicator is an essential addition to your trading arsenal. Logic Behind the Strateg
Unlock the Precision of Trading with the Katana Signal Indicator! The Visual Katana Signal Indicator is an advanced tool designed for traders seeking sharp and decisive insights into the market. This indicator combines intricate logic with cutting-edge signal generation to highlight high-potential trading opportunities. Please note, this indicator is not optimized—it is built for you to tailor and refine it to match your trading strategies. Behind the Strategy
The Katana Signal Indicator utiliz

The Visual Dragon Cloud Indicator is a powerful and unique tool designed to provide traders with deep insights into market behavior. Priced at $65, it offers a robust framework for understanding price dynamics through its sophisticated strategy, while allowing users to optimize and customize it to fit their unique trading styles. Please note: this indicator is not optimized and is intentionally crafted for you to fine-tune it for your personal trading approach. Strategy and Logic Behind the Ind

The Visual ATR Bands Bounce Indicator is a robust tool designed to empower traders with advanced insights into price action using Average True Range (ATR) bands. Please note, this indicator is not optimized, giving you the freedom and flexibility to tailor it to your trading style and strategy. Core Strategy Behind the Indicator: The Visual ATR Bands Bounce Indicator leverages the power of ATR to dynamically plot bands around price action. These bands serve as a flexible envelope, adapting to m

Unlock Precision with ATR Bands Expansion Indicator The ATR Bands Expansion Indicator is your gateway to identifying dynamic price movements and breakout opportunities in the financial markets. Designed to enhance your trading strategy, this tool uses Average True Range (ATR) principles to create adaptive bands that expand and contract based on market volatility. Key Highlights: Not Optimized: This indicator is designed for you to optimize according to your trading preferences and market condit

Unlock the Power of Trend Dynamics with ATR Bands Midline Trend Indicator The ATR Bands Midline Trend Indicator is a meticulously crafted tool designed to help traders identify trends with precision using the Average True Range (ATR) as a foundation. This indicator focuses on calculating a midline derived from ATR bands, providing a unique perspective for traders to detect trend direction and strength effectively. Important: This indicator is not optimized, leaving the door open for you to tail

Unlock Your Trading Potential with the ATR Bands Touch Indicator The ATR Bands Touch Indicator is a dynamic tool designed to identify key price interactions with the Average True Range (ATR) Bands. Built to assist traders in spotting significant touchpoints where price momentum aligns with volatility boundaries, this indicator provides a strategic edge in identifying potential trend shifts or breakout zones. Key Features and Logic Behind the Indicator: Core Strategy: The ATR Bands are calculate

Unleash the Power of Divergence Trading with the Visual MFI Divergence Indicator The Visual MFI Divergence Indicator is a unique tool designed for traders seeking to spot divergence patterns using the Money Flow Index (MFI). This indicator provides a clear and visually enhanced way to detect potential trend reversals or continuation setups, ensuring you stay ahead of the curve. Note: This indicator is not optimized and is crafted specifically for you to customize and optimize according to your

Explore Market Trends with Precision The Visual Ocean Split - Divergence Indicator is your tool to uncover hidden market dynamics by leveraging divergence analysis. Designed to give traders an edge, this indicator helps identify potential reversals and continuation setups in a variety of markets. Not Optimized Yet – Built for You to Optimize!
This indicator is crafted as a foundational tool, allowing you to tweak settings and strategies to best suit your trading style. Whether you’re a scalper,

The Visual River Peak Indicator is a versatile and powerful tool designed for traders seeking to identify potential market turning points with precision. Priced at just $65, this indicator empowers you to uncover trading opportunities by analyzing market dynamics through its unique logic. Please note: this indicator is not optimized, giving you the flexibility to tailor it to your specific trading strategy. Indicator Overview
The Visual River Peak Indicator employs advanced algorithms to detect

Visual Volume Flow Indicator Empower Your Trading with Advanced Volume Flow Analysis! The Visual Volume Flow Indicator is an innovative tool designed to provide a comprehensive analysis of volume trends and their impact on price movements. Priced at $65, this indicator is an essential addition to any trader’s arsenal, offering valuable insights to optimize your trading strategy. What Makes It Unique?
The Visual Volume Flow Indicator leverages advanced algorithms to track the flow of volume and

Visual Wave Cross Indicator Unlock the Power of Crossovers with Precision The Visual Wave Cross Indicator is your gateway to mastering market dynamics through the interplay of price action and wave crossovers. Designed to visualize key market behaviors, this indicator provides traders with a unique perspective to identify potential entry and exit points. Important Note: This indicator is not optimized. It has been created as a flexible tool for you to optimize according to your trading style an

The Visual Eagle Dive Indicator is a tool designed to help traders analyze market movements with precision. It focuses on visualizing key trends and patterns in the market, but it is not optimized and is intended for customization according to your personal trading style. Key Features and Entry Logic: Market Diving Signals: Identifies significant price shifts and potential reversals, mimicking the dive of an eagle. Trend Alignment: Tracks divergences and confluences in price movement to give a

The Visual Falcon Split Divergence Indicator is a tool designed to help traders identify divergence patterns between price movements and indicators. This tool is unoptimized, allowing you to adjust it to your trading style and market conditions. What it does:
The indicator identifies divergence signals where the price moves in the opposite direction of your selected indicator. Divergence often signals potential reversals or trend continuations in the market. How it works: Split Analysis: Divide

Unlock the Power of Precision with the Hawk Turn Indicator! The Hawk Turn Indicator is a highly intuitive tool designed to identify precise turning points in the market, giving you the edge you need to spot potential reversals and optimize your trading strategy. Developed with flexibility in mind, this indicator is unoptimized, allowing you to tailor it to your unique trading preferences and strategies. How It Works
The Hawk Turn Indicator uses advanced algorithms to analyze market dynamics, fo

The Visual Williams Cross Indicator is a tool designed to help traders spot market movements by utilizing Williams %R crossings. This indicator helps identify trend shifts, reversals, and entry points. It is not optimized and is intended for customization to suit your specific trading style. How It Works
The Visual Williams Cross Indicator uses the Williams %R oscillator, a momentum indicator that tracks overbought and oversold conditions. It detects when the Williams %R line crosses important

Optimize Your Trading Decisions with Precision The Visual ZigZag Swing Points Indicator is a powerful tool designed to enhance your market analysis by highlighting significant swing points in price movements. This indicator focuses on simplicity and clarity, allowing you to identify potential turning points and establish a solid foundation for strategic trading. It's important to note that the indicator is not optimized and is created for you to fine-tune according to your unique trading needs.
Unlock the Power of Precision Trading with the Keltner Breakout Indicator! The Visual Keltner Breakout Indicator is an advanced technical tool designed to identify breakout opportunities with unparalleled accuracy. Before diving in, please note that this indicator is not optimized and is created for you to tailor and fine-tune to your unique trading strategies. This feature ensures that you remain in full control of your trading experience, customizing the parameters to align with your specific
Unlock the Potential of Keltner Channel Trends! The Keltner Trend Midline Indicator is a robust tool designed to assist traders in capturing midline movements and potential reversals within the Keltner Channel framework. This indicator is carefully crafted for you to optimize and tailor it to your trading style, ensuring it aligns with your strategies and goals. Key Features & Strategy Logic Midline Dynamics: The indicator focuses on the midline of the Keltner Channel, which acts as a dynamic s

Visual Keltner Volatility Expansion Indicator Unleash the Power of Volatility with Precision! The Visual Keltner Volatility Expansion Indicator is a cutting-edge tool meticulously crafted for traders who seek to master market volatility and identify high-probability trading opportunities. Priced at just $65, this indicator offers an unparalleled combination of simplicity and effectiveness, empowering you to adapt and optimize it to your unique trading style. What Does It Do?
This indicator leve

Visual Momentum Stability Indicator Description: The Visual Momentum Stability Indicator is a cutting-edge tool designed to assist traders in identifying market stability and momentum shifts with precision. Priced at $65, this indicator empowers you to make data-driven decisions by analyzing the interplay between momentum and stability across various timeframes. It is not optimized and is created specifically for you to fine-tune and adapt to your unique trading strategy. This indicator combine

Unleash the Power of Momentum! The Visual Momentum Threshold Cross Indicator is a cutting-edge tool designed to identify precise entry and exit points based on momentum thresholds in the market. Whether you're trading Forex, commodities, or indices, this indicator provides clear visual signals to guide your decisions. Strategy Overview: This indicator revolves around the concept of momentum, a critical force driving price movement in financial markets. By detecting when momentum crosses predefi

The Visual Momentum Trend Strength Indicator is a powerful tool designed to enhance your technical analysis. Priced at $65, this indicator is not optimized, giving you the flexibility and control to tailor it to your unique trading style and strategy. The Momentum Trend Strength Indicator combines momentum dynamics with trend strength analysis, providing traders with a visual and accurate way to identify key market opportunities. This tool evaluates the market's directional strength and momentu

The Visual Momentum Zero Cross Indicator offers traders an advanced tool designed to identify key momentum shifts and precise zero-crossing levels in the market. This indicator is not optimized and is created for you to tailor and optimize it to suit your unique trading style and preferences. What does it do?
The Visual Momentum Zero Cross Indicator identifies critical moments when the momentum crosses the zero line, signaling potential trend reversals or continuations. By focusing on these piv
Uncover Market Structure Like Never Before!
The Visual ZigZag Market Structure Indicator is your ultimate tool for identifying key market turning points and structural patterns. Designed with flexibility in mind, this indicator provides traders with a visual framework to analyze market waves and define strategic entry and exit zones. Please note: This indicator is not optimized and is designed for you to tailor it to your trading style. How It Works
The logic behind the ZigZag Market Structure

Visual ZigZag Pattern Indicator
The Visual ZigZag Pattern Indicator is a cutting-edge tool designed to assist traders in identifying key market structure points based on the ZigZag algorithm. Whether you’re trading Forex, stocks, or indices, this indicator provides a clear representation of price swings, allowing you to analyze market trends and plan your entries and exits effectively. Please note, this indicator is not optimized and is created for you to optimize it according to your unique tr
Visual ZigZag Trend Indicator Welcome to the Visual ZigZag Trend Indicator This advanced tool is designed to provide a dynamic representation of market trends by combining ZigZag calculations with trend detection capabilities. Please note, this indicator is not optimized, allowing you the flexibility to tailor it to your unique trading strategy. For only $65, it offers a powerful framework for spotting market movements and trend reversals. Let’s dive into how this tool can elevate your trading
Le MetaTrader Market est la seule boutique où vous pouvez télécharger un robot de trading de démonstration gratuit pour le tester et l'optimiser à l'aide de données historiques.
Lisez l’aperçu de l'application et les avis d'autres clients, téléchargez-la directement sur votre terminal et testez un robot de trading avant de l'acheter. Seul MetaTrader Market vous permet de tester gratuitement une application.
Vous manquez des opportunités de trading :
- Applications de trading gratuites
- Plus de 8 000 signaux à copier
- Actualités économiques pour explorer les marchés financiers
Inscription
Se connecter
Si vous n'avez pas de compte, veuillez vous inscrire
Autorisez l'utilisation de cookies pour vous connecter au site Web MQL5.com.
Veuillez activer les paramètres nécessaires dans votre navigateur, sinon vous ne pourrez pas vous connecter.