Regardez les tutoriels vidéo de Market sur YouTube
Comment acheter un robot de trading ou un indicateur
Exécutez votre EA sur
hébergement virtuel
hébergement virtuel
Test un indicateur/robot de trading avant d'acheter
Vous voulez gagner de l'argent sur Market ?
Comment présenter un produit pour qu'il se vende bien
Nouveaux indicateurs techniques pour MetaTrader 5 - 10

Diamond Wall Indicator
The Visual Diamond Wall Indicator is a sophisticated tool designed to help traders identify critical levels of support and resistance with precision. Please note, this indicator is not optimized—it’s purposefully crafted to empower you to tailor and optimize it for your unique trading style and strategies. Core Strategy & Logic:
The indicator leverages dynamic algorithmic analysis to detect "diamond wall zones" in the market. These zones act as pivotal price levels where

Empower Your Trading with the Visual Silver Turn Indicator! The Visual Silver Turn Indicator is designed to identify pivotal market turning points with precision. By analyzing price action dynamics and trend shifts, this indicator provides traders with an intuitive tool to locate potential reversal zones and opportunities. Perfect for traders looking to gain insights into market behavior, the Visual Silver Turn Indicator is an essential addition to your trading arsenal. Logic Behind the Strateg
Unlock the Precision of Trading with the Katana Signal Indicator! The Visual Katana Signal Indicator is an advanced tool designed for traders seeking sharp and decisive insights into the market. This indicator combines intricate logic with cutting-edge signal generation to highlight high-potential trading opportunities. Please note, this indicator is not optimized—it is built for you to tailor and refine it to match your trading strategies. Behind the Strategy
The Katana Signal Indicator utiliz

The Visual Dragon Cloud Indicator is a powerful and unique tool designed to provide traders with deep insights into market behavior. Priced at $65, it offers a robust framework for understanding price dynamics through its sophisticated strategy, while allowing users to optimize and customize it to fit their unique trading styles. Please note: this indicator is not optimized and is intentionally crafted for you to fine-tune it for your personal trading approach. Strategy and Logic Behind the Ind
The Visual ATR Bands Bounce Indicator is a robust tool designed to empower traders with advanced insights into price action using Average True Range (ATR) bands. Please note, this indicator is not optimized, giving you the freedom and flexibility to tailor it to your trading style and strategy. Core Strategy Behind the Indicator: The Visual ATR Bands Bounce Indicator leverages the power of ATR to dynamically plot bands around price action. These bands serve as a flexible envelope, adapting to m

Unlock Precision with ATR Bands Expansion Indicator The ATR Bands Expansion Indicator is your gateway to identifying dynamic price movements and breakout opportunities in the financial markets. Designed to enhance your trading strategy, this tool uses Average True Range (ATR) principles to create adaptive bands that expand and contract based on market volatility. Key Highlights: Not Optimized: This indicator is designed for you to optimize according to your trading preferences and market condit
Unlock the Power of Trend Dynamics with ATR Bands Midline Trend Indicator The ATR Bands Midline Trend Indicator is a meticulously crafted tool designed to help traders identify trends with precision using the Average True Range (ATR) as a foundation. This indicator focuses on calculating a midline derived from ATR bands, providing a unique perspective for traders to detect trend direction and strength effectively. Important: This indicator is not optimized, leaving the door open for you to tail

Unlock Your Trading Potential with the ATR Bands Touch Indicator The ATR Bands Touch Indicator is a dynamic tool designed to identify key price interactions with the Average True Range (ATR) Bands. Built to assist traders in spotting significant touchpoints where price momentum aligns with volatility boundaries, this indicator provides a strategic edge in identifying potential trend shifts or breakout zones. Key Features and Logic Behind the Indicator: Core Strategy: The ATR Bands are calculate

Unleash the Power of Divergence Trading with the Visual MFI Divergence Indicator The Visual MFI Divergence Indicator is a unique tool designed for traders seeking to spot divergence patterns using the Money Flow Index (MFI). This indicator provides a clear and visually enhanced way to detect potential trend reversals or continuation setups, ensuring you stay ahead of the curve. Note: This indicator is not optimized and is crafted specifically for you to customize and optimize according to your

Explore Market Trends with Precision The Visual Ocean Split - Divergence Indicator is your tool to uncover hidden market dynamics by leveraging divergence analysis. Designed to give traders an edge, this indicator helps identify potential reversals and continuation setups in a variety of markets. Not Optimized Yet – Built for You to Optimize!
This indicator is crafted as a foundational tool, allowing you to tweak settings and strategies to best suit your trading style. Whether you’re a scalper,

The Visual River Peak Indicator is a versatile and powerful tool designed for traders seeking to identify potential market turning points with precision. Priced at just $65, this indicator empowers you to uncover trading opportunities by analyzing market dynamics through its unique logic. Please note: this indicator is not optimized, giving you the flexibility to tailor it to your specific trading strategy. Indicator Overview
The Visual River Peak Indicator employs advanced algorithms to detect

Visual Volume Flow Indicator Empower Your Trading with Advanced Volume Flow Analysis! The Visual Volume Flow Indicator is an innovative tool designed to provide a comprehensive analysis of volume trends and their impact on price movements. Priced at $65, this indicator is an essential addition to any trader’s arsenal, offering valuable insights to optimize your trading strategy. What Makes It Unique?
The Visual Volume Flow Indicator leverages advanced algorithms to track the flow of volume and

Visual Wave Cross Indicator Unlock the Power of Crossovers with Precision The Visual Wave Cross Indicator is your gateway to mastering market dynamics through the interplay of price action and wave crossovers. Designed to visualize key market behaviors, this indicator provides traders with a unique perspective to identify potential entry and exit points. Important Note: This indicator is not optimized. It has been created as a flexible tool for you to optimize according to your trading style an

The Visual Eagle Dive Indicator is a tool designed to help traders analyze market movements with precision. It focuses on visualizing key trends and patterns in the market, but it is not optimized and is intended for customization according to your personal trading style. Key Features and Entry Logic: Market Diving Signals: Identifies significant price shifts and potential reversals, mimicking the dive of an eagle. Trend Alignment: Tracks divergences and confluences in price movement to give a

The Visual Falcon Split Divergence Indicator is a tool designed to help traders identify divergence patterns between price movements and indicators. This tool is unoptimized, allowing you to adjust it to your trading style and market conditions. What it does:
The indicator identifies divergence signals where the price moves in the opposite direction of your selected indicator. Divergence often signals potential reversals or trend continuations in the market. How it works: Split Analysis: Divide

Unlock the Power of Precision with the Hawk Turn Indicator! The Hawk Turn Indicator is a highly intuitive tool designed to identify precise turning points in the market, giving you the edge you need to spot potential reversals and optimize your trading strategy. Developed with flexibility in mind, this indicator is unoptimized, allowing you to tailor it to your unique trading preferences and strategies. How It Works
The Hawk Turn Indicator uses advanced algorithms to analyze market dynamics, fo

The Visual Williams Cross Indicator is a tool designed to help traders spot market movements by utilizing Williams %R crossings. This indicator helps identify trend shifts, reversals, and entry points. It is not optimized and is intended for customization to suit your specific trading style. How It Works
The Visual Williams Cross Indicator uses the Williams %R oscillator, a momentum indicator that tracks overbought and oversold conditions. It detects when the Williams %R line crosses important

Optimize Your Trading Decisions with Precision The Visual ZigZag Swing Points Indicator is a powerful tool designed to enhance your market analysis by highlighting significant swing points in price movements. This indicator focuses on simplicity and clarity, allowing you to identify potential turning points and establish a solid foundation for strategic trading. It's important to note that the indicator is not optimized and is created for you to fine-tune according to your unique trading needs.
Unlock the Power of Precision Trading with the Keltner Breakout Indicator! The Visual Keltner Breakout Indicator is an advanced technical tool designed to identify breakout opportunities with unparalleled accuracy. Before diving in, please note that this indicator is not optimized and is created for you to tailor and fine-tune to your unique trading strategies. This feature ensures that you remain in full control of your trading experience, customizing the parameters to align with your specific
Unlock the Potential of Keltner Channel Trends! The Keltner Trend Midline Indicator is a robust tool designed to assist traders in capturing midline movements and potential reversals within the Keltner Channel framework. This indicator is carefully crafted for you to optimize and tailor it to your trading style, ensuring it aligns with your strategies and goals. Key Features & Strategy Logic Midline Dynamics: The indicator focuses on the midline of the Keltner Channel, which acts as a dynamic s

Visual Keltner Volatility Expansion Indicator Unleash the Power of Volatility with Precision! The Visual Keltner Volatility Expansion Indicator is a cutting-edge tool meticulously crafted for traders who seek to master market volatility and identify high-probability trading opportunities. Priced at just $65, this indicator offers an unparalleled combination of simplicity and effectiveness, empowering you to adapt and optimize it to your unique trading style. What Does It Do?
This indicator leve

Visual Momentum Stability Indicator Description: The Visual Momentum Stability Indicator is a cutting-edge tool designed to assist traders in identifying market stability and momentum shifts with precision. Priced at $65, this indicator empowers you to make data-driven decisions by analyzing the interplay between momentum and stability across various timeframes. It is not optimized and is created specifically for you to fine-tune and adapt to your unique trading strategy. This indicator combine

Unleash the Power of Momentum! The Visual Momentum Threshold Cross Indicator is a cutting-edge tool designed to identify precise entry and exit points based on momentum thresholds in the market. Whether you're trading Forex, commodities, or indices, this indicator provides clear visual signals to guide your decisions. Strategy Overview: This indicator revolves around the concept of momentum, a critical force driving price movement in financial markets. By detecting when momentum crosses predefi

The Visual Momentum Trend Strength Indicator is a powerful tool designed to enhance your technical analysis. Priced at $65, this indicator is not optimized, giving you the flexibility and control to tailor it to your unique trading style and strategy. The Momentum Trend Strength Indicator combines momentum dynamics with trend strength analysis, providing traders with a visual and accurate way to identify key market opportunities. This tool evaluates the market's directional strength and momentu

The Visual Momentum Zero Cross Indicator offers traders an advanced tool designed to identify key momentum shifts and precise zero-crossing levels in the market. This indicator is not optimized and is created for you to tailor and optimize it to suit your unique trading style and preferences. What does it do?
The Visual Momentum Zero Cross Indicator identifies critical moments when the momentum crosses the zero line, signaling potential trend reversals or continuations. By focusing on these piv
Uncover Market Structure Like Never Before!
The Visual ZigZag Market Structure Indicator is your ultimate tool for identifying key market turning points and structural patterns. Designed with flexibility in mind, this indicator provides traders with a visual framework to analyze market waves and define strategic entry and exit zones. Please note: This indicator is not optimized and is designed for you to tailor it to your trading style. How It Works
The logic behind the ZigZag Market Structure

Visual ZigZag Pattern Indicator
The Visual ZigZag Pattern Indicator is a cutting-edge tool designed to assist traders in identifying key market structure points based on the ZigZag algorithm. Whether you’re trading Forex, stocks, or indices, this indicator provides a clear representation of price swings, allowing you to analyze market trends and plan your entries and exits effectively. Please note, this indicator is not optimized and is created for you to optimize it according to your unique tr

Visual ZigZag Trend Indicator Welcome to the Visual ZigZag Trend Indicator This advanced tool is designed to provide a dynamic representation of market trends by combining ZigZag calculations with trend detection capabilities. Please note, this indicator is not optimized, allowing you the flexibility to tailor it to your unique trading strategy. For only $65, it offers a powerful framework for spotting market movements and trend reversals. Let’s dive into how this tool can elevate your trading

Visual Envelope Indicator is designed for traders who want a clear visual representation of market trends, potential reversals, and price dynamics within defined envelope boundaries. This indicator simplifies market analysis, offering a unique perspective for crafting your trading strategy. Please note that this indicator is not optimized—it's intentionally built for you to optimize it according to your trading style and goals. Strategy and Logic Behind the Indicator
The Visual Envelope Indicat

Visual Envelope Price Cross Indicator Unlock the power of price envelope dynamics with the Envelope Price Cross Indicator! This tool is designed to identify potential trade opportunities by analyzing price movements relative to the envelope bands. It is a valuable addition to your trading arsenal, providing insights into trend continuations, reversals, and market momentum. Important: This indicator is not optimized. It is created for YOU to optimize and fine-tune to match your trading strategy.

Optimize Your Strategy with the Envelope Support Bounce Indicator! The Visual Envelope Support Bounce Indicator is designed as a tool for traders who want to unlock the potential of envelope-based strategies in their trading. This indicator is not pre-optimized, allowing you to fully customize and optimize it to suit your trading style and preferences. Whether you're a scalper, day trader, or swing trader, the flexibility of this tool makes it an invaluable addition to your arsenal. What Does I

Welcome to the Visual Envelope Trend Flow Indicator! This tool is not optimized and has been crafted specifically for you to explore, test, and fine-tune according to your unique trading strategy. It offers flexibility and a powerful starting point for traders aiming to master trend identification and price flow dynamics. Strategy and Logic Behind the Indicator:
The Visual Envelope Trend Flow Indicator leverages the concept of envelope channels, which are dynamic boundaries drawn around price a

Range Directional Force Indicator – Designed for You to Optimize! The Range Directional Force Indicator is a cutting-edge tool designed to empower traders by visualizing market dynamics and directional strength. Built to offer insights into market trends and reversals, this indicator is an invaluable asset for traders seeking precision in their strategies. However, it is important to note that this indicator is not optimized, leaving room for you to tailor it to your unique trading preferences.
Explore the Power of Precision with the Range Indicator! This cutting-edge indicator is designed to provide traders with a detailed analysis of market range movements. However, it is essential to note that the Visual Range Indicator is not optimized—it has been crafted for you to tailor it to your trading needs and optimize it for your unique strategy. Your mastery and customization will unlock its true potential! The Strategy Behind the Range Indicator
The Visual Range Indicator focuses on ide

Introducing the Aroon Indicator
The Aroon Indicator is a powerful tool designed to help you identify trend strength, direction, and potential reversals in the market. Built with precision, this indicator offers unparalleled insights into market dynamics, enabling traders to make informed decisions. Remember, this indicator is not optimized and is crafted for you to optimize according to your trading preferences. How It Works
The Aroon Indicator operates on the principle of calculating the time

Visual Aroon Cross Signal Indicator
Price: $65 Discover the power of trend identification and reversal points with the Visual Aroon Cross Signal Indicator! Designed to assist traders in recognizing key market movements, this indicator focuses on the Aroon oscillator’s signal crossing to detect market trends and shifts, offering insights into potential trade setups. Note to Buyers:
This indicator is not optimized. It’s a powerful tool crafted for traders to adjust and customize according to thei

Introducing the "Visual Aroon Directional Shift Indicator" – a tool designed to help traders uncover trend strength and directional shifts in the market with precision. This indicator is available for $65 and provides an unparalleled view into market dynamics for both novice and experienced traders. Not Optimized, Created for You to Optimize
This indicator is intentionally designed without pre-set optimizations, giving you the freedom to adjust its settings according to your unique trading styl

The Visual Aroon Zero Level Indicator is a powerful analytical tool designed to assist traders in identifying market trends, momentum, and potential reversals using the robust Aroon oscillator logic. It offers clear and actionable insights, making it an essential addition to your trading toolkit. Key Features and Logic Behind the Indicator:
Aroon Oscillator Mechanics:
The Aroon Oscillator operates by analyzing the time since the most recent highs and lows occurred. The indicator calculates the

The Visual Mass Reversal Indicator is an advanced analytical tool designed for traders seeking to identify potential market reversals. This indicator brings powerful visual clarity to reversal opportunities, enabling traders to spot entry points effectively. Please note, the indicator is not optimized—it is intentionally crafted for you to optimize and tailor it to your unique trading strategies. The Strategy Behind the Indicator
The Mass Reversal Indicator uses a sophisticated algorithm to det

Unleash the Power of Market Dynamics with the Vortex Indicator! The Visual Vortex Indicator is your advanced tool for decoding market trends, reversals, and momentum shifts. Priced at $65, this indicator provides a comprehensive view of market behavior, but it’s designed for you to fine-tune and optimize it according to your unique trading strategy. What Makes It Unique?
The Vortex Indicator is based on a strategy that identifies directional movements and trend strength by analyzing key price d
Visual Vortex Momentum Shift Indicator Unlock the potential of momentum shifts in the market with the Visual Vortex Momentum Shift Indicator! This advanced tool is designed to help traders identify crucial turning points and momentum reversals with clarity and precision. However, this indicator is not optimized and is created for you to optimize based on your trading preferences and strategies. What is the Visual Vortex Momentum Shift Indicator?
The indicator focuses on detecting momentum shift
Visual Vortex Signal Indicator
The Visual Vortex Signal Indicator is your pathway to exploring dynamic market conditions and refining your trading strategy. This indicator is not optimized—it is intentionally designed for traders to tweak and perfect it to suit their trading preferences and objectives. By taking full control of its parameters, you can tailor it to complement your trading approach. How It Works
The Visual Vortex Signal Indicator leverages the power of the Vortex Indicator (VI),

The Visual Vortex Trend Strength Indicator is designed to help traders assess the strength and direction of trends, allowing for better trade placements and exit strategies. While it is not optimized, it provides flexibility for customization according to personal trading preferences and strategies. How It Works: Trend Confirmation: Helps determine if the market is trending or ranging. Strength Analysis: Measures the vigor of the trend, aiding in trade placements. Potential Reversals: Detects w
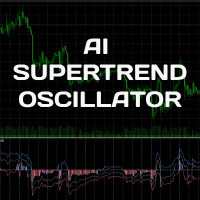
The AI SuperTrend Clustering Oscillator identifies three key outputs—bullish, neutral, and bearish—derived from variations between multiple SuperTrend indicators. FUNCTIONALITY The oscillator consists of three primary elements: Bullish Output : Represents the most optimistic signal, always the highest value. Bearish Output : Reflects the most pessimistic signal, always the lowest value. Consensus Output : Falls between the bullish and bearish outputs, serving as an overall trend indicator. A
FREE

Take the stress out of trading with the Buy Sell Chill Indicator —your ultimate companion for effortless trend identification. This easy-to-use tool gives you a clear visual arrow to show the direction the market is about to take, making trading decisions as simple and "chill" as possible. Why Choose the Buy Sell Chill Indicator? Relaxed and Intuitive : Designed to make trading less stressful and more enjoyable by giving you straightforward signals with no clutter. Customizable Features : ATR Pe
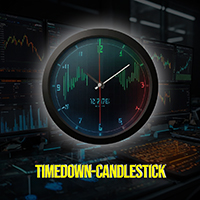
Monitor Remaining Time with Accuracy!
Do you often miss crucial moments when a candle closes? The Timedown Indicator is here to display the remaining time for the current candlestick in minutes and seconds directly on your chart! Why Choose the Timedown Indicator?
Highly Accurate : Countdown to the next candle with precision—perfect for scalpers and day traders!
User-Friendly : Simply drag and drop it onto your chart, and it works instantly.
Multi-Timeframe Compatibility : Works sea
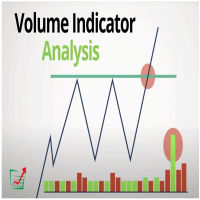
Hawkeye Volume is comprised of three indicators (Volume, Volume Radar, Volume PaintBar).
Volume is the cornerstone of the Hawkeye suite of tools, and provides the key that professional traders have in knowing when the market is being accumulated, distributed, or if there is no demand. With this indicator, you will gain the edge you’ve been looking for. Hawkeye’s Volume Indicator contains a complex algorithm which executes over 300 calculations per bar in order to analyze the price action and ass

Unleash the Power of Precision Trading with Engulfing Detector ! Are you struggling to spot high-probability reversal patterns on your charts? Say goodbye to guesswork and hello to accuracy with Engulfing Detector ! Why Choose Engulfing Detector? Automated Detection : Instantly identifies Bullish and Bearish Engulfing patterns with pinpoint accuracy. Visual Alerts : Clear arrows mark potential entry points, so you never miss a trading opportunity. User-Friendly : Designed for traders of all l
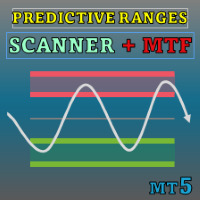
Special offer : ALL TOOLS , just $35 each! New tools will be $30 for the first week or the first 3 purchases ! Trading Tools Channel on MQL5 : Join my MQL5 channel to update the latest news from me Dans le paysage actuel du trading financier, où la volatilité est importante, l’identification précise des niveaux de support et de résistance est cruciale pour permettre aux traders de prendre des décisions éclairées. Predictive Ranges Scanner Multi-TF est un outil avancé conçu pour aid

*** "A market analysis tool that integrates Smart Money Concept (SMC) and Reversal Signals, featuring an automated system for analyzing Market Structure, Order Blocks, Liquidity, POI, Premium & Discount Zones, Trade Session, and a customizable Dashboard tailored to your trading style." *** *** SMC | Smart Money Concepts (SMC) | SMART MONEY | SMC Signals | Entry In The Zone | Zone | SMC Reversal Signal Tool | Market Structure | Market Structure Analysis | BOS/CHoCH | Automatic BOS & CHoCH Detect
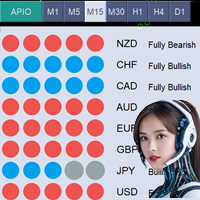
*Le prix actuel du produit est de 49$ pour une durée limitée, le prochain prix de All Power In One est de 99$* Indicateur All Power In One (APIO) L'indicateur All Power In One (APIO) est un outil robuste conçu pour évaluer la force des principales devises, y compris USD, EUR, GBP et d'autres. En analysant les mouvements et les directions de diverses paires de devises sur des périodes sélectionnables, APIO offre aux traders des aperçus clairs sur la force des devises et les opportunités de tradi

L'indicateur DYJ BoS identifie et marque automatiquement les éléments essentiels des changements de structure du marché, notamment :
Rupture de structure (BoS) : détectée lorsque le prix effectue un mouvement significatif, franchissant un point de structure précédent.
Il marque les lignes de tendance haussière et baissière possibles (UP & DN, c'est-à-dire de nouveaux sommets et de nouveaux creux continus), et une fois que le prix franchit ces lignes, il marque des flèches rouges (BEAR) et ver

Description of the Horizontal Levels Indicator with Manual Interval Adjustment The indicator is designed for automatic plotting of horizontal levels on the chart of a financial instrument. It allows users to manually set the interval between levels, making it adaptable to various trading strategies and timeframes. Key Features: Flexible Configuration : Users can define the interval between levels in points, percentages, or any other unit suitable for the selected asset. Automatic Plotting : The
FREE
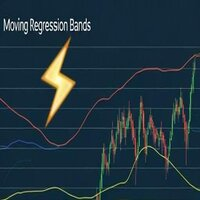
MovingRegressionBands - Polynomial Regression Indicator with Adaptive Bands Description MovingRegressionBands is an advanced technical indicator that combines polynomial regression with adaptive bands to identify market trends and reversal points. Using sophisticated mathematical calculations, the indicator provides a more precise view of price movements through a higher-order regression model. Key Features Configurable polynomial regression order for greater accuracy Adaptive bands based on mod
FREE

Trade with Confidence: Understand the highs and lows of each session with live comparisons to previous period changes. Monthly Movement Tracking: Compare this year's performance with last year's to gauge market sentiment. Percentage Change Analysis: Helps avoid overpaying or underselling by showing price movement changes. Profit Overview: Instantly view your profit for different periods, including daily, weekly, and current values. Symbol Performance: Track the movement of any selected trading

ZLMA Trend Candles indicator uses an enhanced Zero-Lag Moving Average to highlight key trend shifts, repainting candles in real time. It reacts faster than traditional moving averages, helping you spot potential market turns earlier. Gain clear entry and exit signals and filter out market noise with ease! This product is also available for MetaTrader 4 => https://www.mql5.com/en/market/product/129279 1. What Is ZLMA Trend Candles?
ZLMA Trend Candles is a MetaTrader 4/5 indicator based on the Z

Quantum Dynamic POC Hi Tf for MT5 Description: The "Quantum Dynamic POC Hi Tf" is a unique indicator developed for volume analysis. It is suitable for both real volumes (on futures contracts) and tick volumes (on the Forex market). The indicator is a channel tool consisting of three lines that dynamically change depending on the selected timeframe: Middle Line : the main dynamic Point of Control (POC), which reflects the average volume price. Upper Line : the maximum of the selected timeframe. L
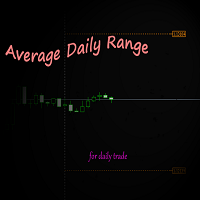
Average True Daily Range is an indicator that displays support and resistance zones based on the average daily price range. It is used to determine the intraday trading space and risk-return ratio. It needs to be traded in conjunction with other indicators to determine the direction. This indicator is used for intraday trading, so the indicator is only displayed on D1 below periods. If you are interested in day trading based on trend trading, you can test my other indicator " magic finger "

Usta Avcı v1.0
Bu gösterge, m15 - H1 - H4 ve 1D zaman dilimlerinde en iyi alım ve satım seviyelerinde sinyaller vermek için RSI, MFI, Momentum ve ATR göstergelerini kullanır. Her yeni sinyalde grafikte TP1, TP2, TP3 ve SL seviyelerini gösterir.
Bu göstergenin tüm değerleri özelleştirilebilir ve tüm ürünlerde kullanılabilir. Mevcut yüklenen ayarlar Altın için hazırlanmıştır. Altın, Gümüş, Petrol, Doğal Gaz ve Endekslerde en iyi sonuçları verir.
ALTIN AYARI TP1=7.50 TP2=14.75 TP3=37.500 SL
HLines User Guide Overview and Features The NTL HLines Indicator is designed to elevate your trading with precise support and resistance analysis. Utilizing a sophisticated algorithm, this MQL5 indicator scans for high-probability price levels across multiple timeframes, helping traders pinpoint strategic entry and exit zones. With fully customizable pivot scanning and multi-timeframe support, HLines provides a powerful, adaptable toolset for traders of all experience levels. Key features includ
Japanese Candle Patterns (JCP) User Guide Overview and Features Japanese candlestick patterns, a foundational element of technical analysis, provide traders with visual insights into market psychology. Each pattern represents the battle between bulls and bears, encapsulating critical information about market sentiment, potential reversals, and continuation signals. Developed centuries ago and later popularized by Steve Nison in Japanese Candlestick Charting Techniques , these patterns are now wi
Pivot Lines (PL) User Guide Overview and Features The Pivot Lines Indicator (PL) provides traders with a powerful tool for identifying potential support and resistance levels based on well-established pivot point calculation methods. By offering insights into possible price turning points, this indicator helps traders make more informed trading decisions and refine their entry and exit strategies. With customizable settings for different timeframes and calculation methods, PL is versatile and a
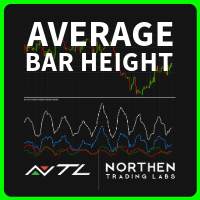
ABH - Candle Component Analysis - User Guide Overview and Features The ABH - Average Bar Height indicator is designed to help traders analyze market volatility and identify potential buy and sell signals by measuring the average size of each candlestick component over a specific period. The indicator calculates and displays four lines representing different candlestick metrics. By analyzing these values, traders can interpret market strength, volatility, and potential trend changes. Beyond

MACD indicator, first indicator, loading 3 cycles, 3 windows, 5-minute, 1-hour, 1-day chart, accurate comparison ,Can be used in conjunction with my EMA metrics, The other moving average indicator I sell on MQL5 can prevent volatile market conditions, The signal line needs to be fixed after the color changes, and then the signal direction can be confirmed,For example, for a 5-minute chart, you need to wait until the next 5 minutes to confirm that the signal direction is good
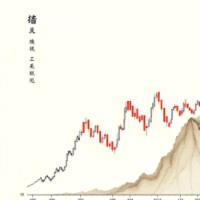
The principle behind this indicator is lost,In theory, In theory, it can load infinitely on the chart, but requires different parameters,Recommend 5, 10, 20,This indicator is more accurate in 5 minutes, 1 hour, and 1 day,Can be combined with my MACD to use together, https://www.mql5.com/zh/market/product/129184?source=Site +Profile+Seller ea, Indicator,Strategy Analysis,strategy optimization,Need to write,Provide strategy,Write EA, indicators,contact Telegram @r24231

HistoEdge Indicator Welcome to the world of precision trading tools! Introducing HistoEdge, a powerful and customizable MetaTrader 5 indicator designed to provide you with the insights you need to make informed trading decisions. Please note: HistoEdge is not optimized by default; it is designed for traders like you to fine-tune and unleash its full potential according to your strategies. Key Features
Advanced MACD Histogram Visualization:
Utilizes the MACD (Moving Average Convergence Divergenc

Introducing the DivergenceSpotter Indicator!
Note: This indicator is not pre-optimized—it’s crafted for you to customize and optimize to suit your unique trading strategies! The DivergenceSpotter Indicator is your ultimate tool for identifying divergences in the market, giving you an edge in spotting potential trend reversals and continuation opportunities. Whether you're a novice trader or a seasoned expert, this powerful tool is here to elevate your trading game. How It Works:
The DivergenceS

MACD Momentum Shift Unleash the Power of Momentum in Your Trades
The "MACD Momentum Shift" is an advanced trading indicator based on the renowned Moving Average Convergence Divergence (MACD). It’s crafted to give you the tools you need to optimize and adapt it for your personal trading style. Your Customizable Edge
This indicator isn't pre-optimized—it's designed for you to take control. Modify MACD fast, slow, and signal periods, as well as the delay between signals, to suit your preferred str

Introducing the Phoenix RSI Indicator – your gateway to mastering market momentum and identifying profitable trading opportunities! Designed for traders who value control, this indicator comes pre-equipped with powerful features but is intentionally left unoptimized to empower YOU to tailor it to your unique trading strategy. What Makes the Phoenix RSI Indicator Special? Customizable RSI Analysis: Visualize market momentum with a sleek RSI line directly on your chart. Adjust the RSI period to s

Introducing "Dragons Pulse"
Are you ready to take your trading strategies to the next level? The Dragons Pulse Indicator is a powerful tool designed with flexibility in mind, empowering you to optimize it according to your unique trading style. While not pre-optimized, this indicator provides you with a foundation to unleash your creativity and craft strategies that truly work for you! Key Features: RSI-Based Insights: Uses the trusted Relative Strength Index (RSI) to analyze market momentum. P
Le MetaTrader Market offre un lieu pratique et sécurisé pour acheter des applications pour la plateforme MetaTrader. Téléchargez des versions démo gratuites de Expert Advisors et des indicateurs directement depuis votre terminal pour les tester dans le testeur de stratégie.
Testez les applications dans différents modes pour surveiller les performances et effectuez un paiement pour le produit que vous souhaitez en utilisant le système de paiement MQL5.community.
Vous manquez des opportunités de trading :
- Applications de trading gratuites
- Plus de 8 000 signaux à copier
- Actualités économiques pour explorer les marchés financiers
Inscription
Se connecter
Si vous n'avez pas de compte, veuillez vous inscrire
Autorisez l'utilisation de cookies pour vous connecter au site Web MQL5.com.
Veuillez activer les paramètres nécessaires dans votre navigateur, sinon vous ne pourrez pas vous connecter.