Regardez les tutoriels vidéo de Market sur YouTube
Comment acheter un robot de trading ou un indicateur
Exécutez votre EA sur
hébergement virtuel
hébergement virtuel
Test un indicateur/robot de trading avant d'acheter
Vous voulez gagner de l'argent sur Market ?
Comment présenter un produit pour qu'il se vende bien
Indicateurs techniques pour MetaTrader 4 - 134

This Indicator does not repaint itself at all, it's identifies a new TREND in the bud, this indicator examines the volatility, volumes and momentum to identify the moment in which there is an explosion of one or more of these data and therefore the moment in which prices have strong probability of following a new TREND.
CandleBarColorate never misses a beat, he always identifies a new TREND in the bud without error. This indicator facilitates the reading of charts on METATRADER; on a single win
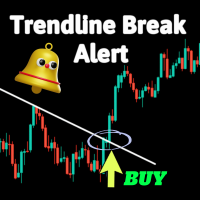
Ceci est un indicateur simple qui fournit une alerte en cas de rupture de ligne de tendance.
Il peut être utile si vous avez l'habitude d'utiliser des lignes de tendance dans votre trading. Les paramètres ajustables comprennent :
Identifiant de bougie : à quelle bougie émettre un signal après une rupture Et trois types d'alertes : Envoyer un e-mail Alertes sonores Notifications push
Regardez cette vidéo pour apprendre comment configurer des alertes de notification sur votre téléphone : https

All in one Indicator. Multiple market analysis tools. Non-Repaint Oscillator signals, Trend lines, Price channel, Fibonacci levels, Support and Resistance, Regression, Pivot levels, Candle Strength and Oversold/Overbought line detector. Includes buttons to hide or show. Advanced algorithms to detect important reversal points and draw trend lines or shapes automatically in appropriate areas. A simple and professional chart display, user friendly and easier to understand for faster and accurately

ForexAnalysis Indicator that shows a whole series of information that the broker doesn't tell me, i.e.: volumes, swaps, that is, what I spend every day to leave it open, then you see the pivot with a suggestion on the operation and the stop loss to adopt. We see that with this new indicator, when the price approaches the zero line of the trade, which is automatically suggested, generally with Price Action signals on the screen, we are at an advantage because in the lower bar we have an indicati
Le produit est converti à partir d'une autre plateforme et a été créé à l'origine par TradeMaster Lite. L'indicateur utilise fondamentalement le concept MACD mais renforce ses capacités par différents types de techniques de calcul de moyenne. Il est puissant pour identifier les tendances et les renversements.
Voici quelques détails fournis par le propriétaire original :
Nous présentons un indicateur MACD personnalisable, avec les caractéristiques suivantes : Multi-cadres temporels Bandes de

Présentation de l'indicateur Gold Massive Arrow, spécialement conçu pour les traders d'or à la fois à long terme et à court terme. Cet outil de pointe fournit des signaux de trading à haute probabilité sans avoir besoin de nombreux indicateurs, simplifiant votre expérience de trading sur le marché dynamique de l'or.
Adapté à tous les styles de traders, cet indicateur de signal de 15 minutes offre la possibilité aux traders à la fois à long terme et à court terme de maximiser leurs profits avec

L'indicateur Accurate Gold est un outil convivial, à la fois intuitif et simple à utiliser, quel que soit le niveau d'expérience des traders. Il est conçu pour les traders à la recherche de signaux précis sur le laps de temps M5 sur le marché de l'or. Cet indicateur utilise des algorithmes mathématiques avancés pour analyser les mouvements de prix et la dynamique du volume, générant ainsi des signaux d'achat et de vente précis. Les caractéristiques distinctives de cet indicateur, notamment sa na
Power Real Trend es un indicador que no repinta y que muestra la dirección real que tiene el mercado, ofreciendo una clara manera de confirmar entradas. Es un indicador que para su constitución se realizan múltiples operaciones para formar los distintos rangos que se utilizan para su creación. Tiene un manejo muy sencillo dando sólo tres posibles valores (1,0,-1) altamente visual y de muy sencilla comprensión. La parte superior del mismo es la zona más sensible y la inferior corresponde a la te
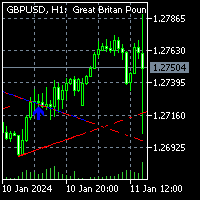
To get access to MT5 version click here . This is the exact conversion from TradingView: "Trendlines with Breaks" by LuxAlgo
This is a REPAINT indicator. Buffers are available for processing. However there are objects on chart to process also. All input fields are available. Alerts are generated based on bars closure. You can message in private chat for further changes you need. Thanks for downloading

Êtes-vous un investisseur à la recherche d'opportunités à long terme sur le marché financier ? Je vous présente l'Indicateur de Tendance Personnalisé à Long Terme. Cet indicateur est conçu pour les traders qui souhaitent prendre des positions sur des périodes plus longues que les graphiques quotidiens, hebdomadaires et mensuels. Avec des signaux clairs et précis, vous disposerez de l'assistance nécessaire pour prendre des décisions éclairées. Caractéristiques clés : Stratégie à Long Terme : Cet

TMA - Indicateur de Moyenne Mobile Triangulaire L'indicateur TMA - Moyenne Mobile Triangulaire est un outil puissant pour les traders cherchant à analyser et identifier les tendances sur les marchés financiers. Cet indicateur calcule intelligemment des moyennes mobiles triangulaires, fournissant des informations précieuses sur la direction du marché. Caractéristiques clés : Idéal pour les horizons temporels plus longs : Recommandé pour une utilisation sur des périodes supérieures à D1/W1/MN, off

Fnix Ma coloré. Il s'agit d'un indicateur personnalisé conçu pour aider les traders à identifier les tendances sur les marchés financiers. Le MA - Master Trend Position Trade est un outil qui calcule et affiche des moyennes mobiles pour faciliter l'analyse des tendances des actifs. Caractéristiques clés : Calcule les moyennes mobiles pour l'identification des tendances. Recommandé pour une utilisation sur des périodes supérieures à D1/W1/MN (quotidienne/hebdomadaire/mensuelle). Suggère l'utilisa
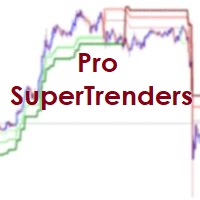
Dear traders! This indicator automatically plots SuperTrends across 3 timeframes. SuperTrend is a trend following indicator. However, it is not much useful on single timeframe, as that gives many whipsaws. Professionals analysis across multi timeframes before taking trades. This adds confluence to trade setups.For the same purpose, Pro SuperTrends shows trend (or absence of trend) on 3 timeframes. Our trading odds improve, when positions are aligned with higher timeframes. Further, SuperTren

The Book of Changes is a product of ancient civilization and a philosophical work that highly integrates natural and social sciences in China. The Book of Changes believes that all things in heaven and earth are constantly developing, and it explains the laws of nature. This law reveals the characteristics of the entire universe, covering the attributes of all things in heaven and earth. The Book of Changes is the crystallization of the wisdom of the Chinese nation. It is the crystallization of
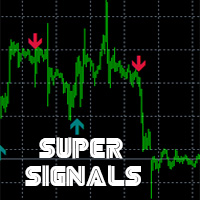
Indicador de Trading UltraPreciso para MetaTrader 4: "Mr Beast Signals no Repaint with alerts" Descubra la revolución en el análisis técnico con nuestro indicador Quantum Precision Pro diseñado para MetaTrader 4. Este avanzado indicador combina algoritmos de vanguardia con inteligencia artificial para ofrecer señales de compra y venta extremadamente precisas en tiempo real. Características destacadas: Precisión sin Igual: Nuestro algoritmo utiliza una combinación de análisis técnico y patrones d

The GGP Trendlines with Breaks Alert MT4 Indicator is a technical analysis tool that can assist investors in identifying market trends. The indicator returns pivot point based trendlines with highlighted breakouts. Users can control the steepness of the trendlines as well as their slope calculation method. This indicator is MT4 conversion of the Trendlines with Breaks Indicator by “ LuxAlgo “ in Trading View website and some alert methods are added to provide real-time alerts when a trading sign
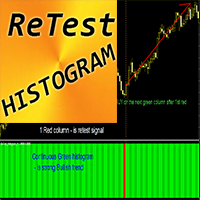
Indicateur Crypto_Forex "ReTest Histogram" pour MT4, pas de repeinture.
- L'indicateur ReTest_Histogram peut être utilisé pour rechercher des signaux d'entrée dans la direction de la tendance principale après le nouveau test d'un niveau S/R fort. - L'histogramme ReTest peut être en 2 couleurs : rouge pour une tendance baissière et vert pour une tendance haussière. - Une fois que vous voyez des colonnes d'histogramme consécutives stables de la même couleur, cela signifie qu'une nouvelle tendanc

RockTrader détecte la direction du marché sur des paires de devises sélectionnées et génère des signaux linéaires pour les possibilités d'achat et de vente sur le cadre temporel choisi. Sa simplicité le rend excellent et facilement compréhensible par les traders débutants et intermédiaires. Son affichage sur le graphique permet également d'utiliser le graphique pour une analyse pure de l'action des prix. RockTrader fonctionne sur plusieurs actifs financiers et fournit des signaux précis à plus d
L'indicateur personnalisé FX_ride aide les traders à identifier les tendances du marché sur des paires de devises sélectionnées et génère des signaux en fonction de la force de la tendance avec son histogramme multicolore sur le cadre temporel choisi. Il fonctionnerait idéalement pour le day trading, le swing trading et le position trading. Le trading en suivant les signaux de FX_ride et en appliquant une gestion financière adéquate pourrait conduire à des opérations de trading rentables.

Gobbo è un indicatore professionale che evidenzia il trend del mercato con un aspetto grafico chiaro e comprensibile, è basato sulla Moving Average e può essere impostato su qualsiasi periodo di intervallo, di default impostato sul periodo 14, scegliendo un periodo più alto evidenzierà meno cambi di tendenza per un approccio sul medio o lungo periodo, con un periodo più basso più cambi di tendenza per un approccio sul breve termine L'aggiornamento e l'adattamento al time frame scelto avviene in

If you are curious about the position of the stochastic, RSI, CCI curve, whether it is at the OBOS level or not, then this trading tool is for you. Introducing the advanced trading tools of 2024. ATF Trend Following Trend Bar OBOS. This indicator is similar to MTF PPAAF Model S but have two layers. Click here to learn more about MTF PPAAFS . This trading tool is equipped with various powerful features : MTF = Multi Time Frame = Time Frame can be changed. On/off button. Customizable parameter,

What if you could see trouble from far, just imagine having some ability to foresee danger. This indicator has the ability to see consolidations before they are clear to everyone else. In the market everything is always fun until the market starts consolidating and often times by the time people realise it it's often too late. This Indicator will spot consolidations very fast and let you know at the top right of the chart so that you can either avoid losses by stopping to trade using trend follo

BreakHarmony Multi-Timeframe Breakout Indicator for MT4
The BreakHarmony Multi-Timeframe Breakout Indicator for MT4 is a highly advanced tool providing information on breakout points across different timeframes, aiding traders in decision-making and understanding market movements. [ Features and Manual | MT5 version | All Products ] The indicator tracks breakout points on price charts across 6 timeframes. Breakout prices are indicated with the closing price of the corresponding candle
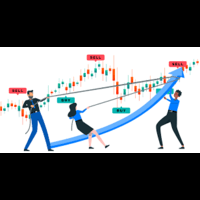
The Swing Hit Perfect Master Indicator for MT4 displays accurate buy and sell signals on the chart and is no repaint and can be used on any pair, gold and indices. It's all in one the best indicator Swing and trend detection and is able to make precise entries. The indicator for MT4 points dots on the chart arrow after the swing high and low is maintained and takes perfect entries with the trend. The template shows the lows and highs of the market. They mark good entry and exit points. The blue

Vision è un indicatore professionale che legge i dati storici del periodo impostato e in base a tali elabora una previsione scrivendo l'andamento sul grafico, l'impatto visivo eccellente rende chiaro l'andamento del prossimo trend e mette a fuoco il prezzo d'ingresso il posizionamento di ordini e la distanza per SL e TP, di default è impostato con un rapporto bilanciato 24 a 24 ciò significa che in base alle ultime 24 candele prevederà scrivendo sul grafico l'andamento delle 24 candele successiv

The arrow indicator without redrawing shows potential entry points into the market in the form of arrows of the appropriate color: the up arrows (usually green) suggest opening a purchase, the red down arrows suggest selling. The appearance of arrows may be accompanied by beeps. It is usually assumed to enter at the next bar after the pointer, but there may be non-standard recommendations. Arrow indicators visually "unload" the price chart and save time for analysis: no signal – no deal, if ther
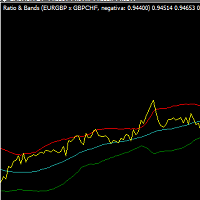
Hello everyone!
This incredible indicator for MT4 plataform calculates the ratio betwwen two symbols AND shows the bollinger bands for this ratio. It also considers if the two symbols have a positive or negative correlation for the calculations.
The result is a powerfull tool that brings very precious information to who that wants to trade in Forex based on correlation.
Enjoy!
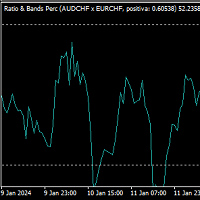
Hello everyone!
This incredible indicator for MT4 plataform calculates the ratio between two symbols, convert it into a percentual value and shows the result into a oscilation tunnel. It is derivated from the our other indicator (Ratio Bands). The basic diference is that instead of a bollinger bands, it uses a percentual oscillation that helps a lot during correlation trades.
It also considers if the two symbols have a positive or negative correlation for the calculations.
Good trades! Enjo

What if God Created a Trade System? No miracles... Just see how mathematics can be effective in the market. We managed to combine technical analysis / price action into indicators, creating the best setup for trading, be it in Forex, Indices, or stocks. It took us 2 years to create something that really works, and now it's time for you to discover it. TrendX3 is a revolution in trend analysis. Based on advanced algorithms and real-time data, it provides valuable insights so that you can make inf

Classic Fractals indicator for MT4, with additional Trendlines connecting the latest couples of fractals
( fractals are showing highest high, and lowest low on each period)
Rules for trendlines:
-if new top fractal is below the last one = new resistance line
-if new bot fractal is above the last one = new support line
-Trendlines can be hidden
-Fractals can be hidden
Fractal Period = can be both even or uneven number, as it is setting for half (one side) of the bars sequence for findin
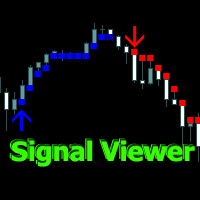
Signal Viewer est un indicateur d'analyse technique pour le Forex. Se compose de flèches et de points suivant le chemin du signal. Il fonctionne en dehors de la tendance, détermine les hauts et les bas sur le graphique, à partir duquel il calcule le début du signal. Utilise des transformations mathématiques des bougies pour déterminer la trajectoire des prix et la fin du signal.
Possibilités
La flèche de signal se forme à la fermeture de la bougie ; les flèches ne sont pas redessinées.
Les sig

Intro to APAMI, PROfessional edition Trace exactly how far prices trend between two price levels with fractional pip precision, while qualifying price movement between the same price levels.
Completely automate when trends change direction and volatility, without any lag . This is possible because the Accurate Price Action Measurement Indicator (APAMI) actually does what no other indicator can: measure price distance between two points and simultaneously qualify the price action that occurs

MCDX Pro is based on Buyer and Seller Volume analysis . Buyer also known as Banker is represented by GREEN BAR Seller also known as Retailer is represented by RED BAR The indicator is showing STACKED BAT representing BANKER (Green) and RETAILER (Red) activities Height of GREEN bar > 50% means Bull is in control while RED bar > 50% means Bear is in control. DARKER GREEN COLOR - STRONG BANKER - Active Buying Activity LIGHTER GREEN COLOR - STRONG Down - Weak Buying (Pullbac

Простой индикатор тренда в NRTR виде с отрисовкой линий стоплосса и тейпрофита, цвет и направление движения которых определяются действующим трендом. Индикатор имеет возможность подавать алерты, отправлять почтовые сообщения и push-сигналы при смене направления тренда. Следует учесть что значение входного параметра индикатора Deviation of the take profit line in points для каждого финансового актива на каждом таймфрейме необходимо подбирать индивидуально!

This is an arrow indicator without a future function,developed based on the most advanced profit trading algorithms.It has the most innovative and advanced dual trend analysis module, as well as the latest and highly effective market trend prediction algorithm.Trends are your friends, and following larger trends can earn the maximum profit in foreign exchange. This indicator helps traders identify current trends and track them. Someone once made a profit of 10 times in a week by relying on it.No
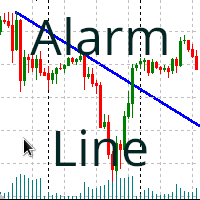
Alerte de franchissement de ligne de tendance Description: Cet indicateur déclenche une alarme (son, alerte ou notification) lorsque le prix dépasse une ligne de tendance, que ce soit au-dessus ou en dessous de celle-ci. Paramètres: Names of the trendlines. : Noms des lignes de tendance séparés par des virgules (Vérifiez que le nom de votre ligne de tendance n'a pas d'espaces au début et qu'il est exact). Value over/under the line (E.g.: 0.03% or 500 pips). : Valeur qui définit une marge au-dess

Introduction The Commodity Channel Index, commonly known as the CCI, is a versatile indicator used by traders and investors to identify cyclical trends in commodities, stocks, and other securities. It was developed by Donald Lambert in 1980, primarily for commodity trading, but has since found widespread application in various financial markets. The CCI is particularly favored for its ability to gauge overbought and oversold levels in price movements. Historical Background Donald Lambert, the

Preface: First of all, let me introduce myself. I am a programmer and have been working for over 20 years. 2023 has passed, and our studio has achieved a record of 500 times with 7 manual transmissions. Below, we will show you how to do it through a series of operations. The first step is to model. Modeling is to find a fixed trading pattern. I think everyone has heard of a 2/8 probability, and through this probability, we can further refine it, which means that 1 to 4 is the optimal state. We h

Subscribe to the 'MA7 Trading' channel to receive notifications about new programs, updates and other information. Ask questions in the profile on the MQL5 .
Description of work
The 'MA7 Agave' indicator is based on the standard Average Directional Movement Index (ADX) indicator. Shows the intersection of the +DI and -DI lines. Detailed information about the 'MA7 Agave' indicator.
Indicator settings
General settings: ADX period - Average Directional Movement Index indicator period.
'MA7 Flax

Présentation de notre nouvel indicateur : [ON Trade Breakout Zone] Outil d'analyse de marché simple mais puissant pour tous les traders ! Convient aussi bien aux professionnels qu'aux traders débutants Êtes-vous prêt à dynamiser votre stratégie de trading ? Notre dernier indicateur est conçu pour simplifier l'analyse du marché et donner du pouvoir aux traders de tous niveaux. Que vous soyez un professionnel chevronné ou que vous débutiez tout juste, [ON Trade Breakout Zone] est la clé p

Product Name: BicsOut - The Ultimate MT4 Breakout Indicator Introducing BicsOut, the indispensable tool for MT4 traders seeking precision in detecting breakouts across any currency pairs. BicsOut is meticulously designed to streamline your trading experience, providing automatic identification of breakout opportunities coupled with seamless entry and exit point calculations. Features: Breakout Detection: BicsOut excels in swiftly pinpointing breakout moments, enabling traders to capitalize on ma

This indicator is based on chart with specialty in volume, it clearly shows where the buying and selling force.
Note on images:
Settings and adjustments to the colors you prefer.
Being able to see the price that the market is at at the exact moment.
Able to accept more indicators in the same window, such as Bollinger Bands, Ma, Stochastic, MACD and many others that adapt to your best configuration.
SEEDER_Volume1 Mt4 indicator can be used on all types of charts, including RENKO charts

Calculate your account's consistency rule in one click! Works for all HFT Prop Firms: - Nova Funding - Infinity Forex Funds - KortanaFx - Next Step Funded - Quantec And many more! --------------------------------------------------- Settings: profitConsistencyPercentage = Max profit limit per order (%) according to your prop firm. lowerRangePercentage - Lowest range for lot size (%) according to your prop firm. upperRangePercentage - Upper range for lot size (%) according to your prop firm.
---
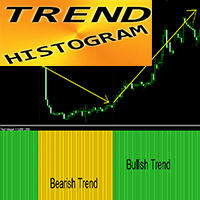
Indicateur Crypto_Forex "TREND Histogram" pour MT4, pas de repeinture.
- L'indicateur TREND Histogram est beaucoup plus sensible et efficace que n'importe quelle moyenne mobile standard. - L'indicateur peut être en 2 couleurs : Jaune (or) pour la tendance baissière et Vert pour la tendance haussière (les couleurs peuvent être modifiées dans les paramètres). - L'histogramme TREND a des alertes mobiles et PC intégrées. - C'est une excellente idée de combiner cet indicateur avec d'autres méthodes

Fair Value Gap is and MT4 Non Repaint and Non Lagging indicator which give alerts upon a signal is detected. It can be used for both scalping and swing trading.
The indicator is based on Trend following strategy and inbuilt trading algorithms of pure price action
Has alerts and also push notifications to your phone with signals to buy or sell.
Works on all Time-frames and MT4 brokers. It is as well a Multi-Currency Indicator, including Gold, Nasdaq and US30 pairs
Take advantage of this wond

Информационный индикатор, показывающий самые важные торговые уровни для внутридневной торговли, и не только. О понятии уровней «Поддержка» и «Сопротивление».
Всем известно, что исторический ценовой диапазон цен состоит из уровней от которых в прошлом, были значимые движения.
И уровни работающие в прошлом, наверняка будут работать и сейчас. К примеру, уровень, находящийся снизу текущей цены
является уровнем «Поддержки», если от него ранее было значительное движение. К примеру, уровень, нах
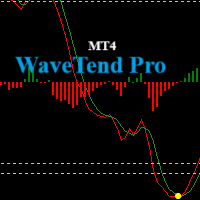
Introducing the Wave Trend Oscillator Indicator for MetaTrader 4(MT4). Our carefully designed oscillator leverages wave trend analysis principles to track market trends accurately. It assists traders in identifying potential buying and selling points based on market wave patterns, allowing you to stay informed. Key Features: Divergence Detection : Spot potential reversals in the market. Intermediate Level Crosses : Gain granular insights into market trends. Please note: The indicator states are
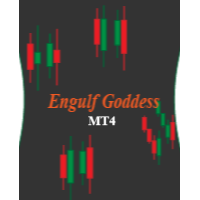
Introducing the Engulfing Goddess Metatrader 4 (MT4) Indicator , a revolutionary tool designed for traders who seek to harness the power of candlestick patterns in their trading strategy. This indicator is built on the principles of engulfing candlestick patterns , a popular method used by successful traders worldwide. Our Engulfing Goddess Indicator stands out with its ability to detect various kinds of engulfing patterns . It employs a range of filters, providing you with a comprehensiv

Subscribe to the 'MA7 Trading' channel to receive notifications about new programs, updates and other information. Ask questions in the profile on the MQL5 .
Description of work
The 'MA7 Flax' indicator is based on the standard Average True Range (ATR) indicator and candle data. Shows candles that are larger in size relative to the ATR indicator value. Detailed information about the 'MA7 Flax' indicator.
Indicator settings
General settings: ATR period – Average True Range indicator period; AT

RaysFX Donchian Channel
Questo indicatore può essere utile per identificare i livelli di supporto e resistenza, nonché per visualizzare visivamente la gamma di prezzo di un determinato periodo. Variabili Valore Periodo 20 TimeFrame Current Mode High/Low(true) o Close (false) Modalità true Telegram: https://t.me/SmartSaverOfficial Store: https://www.mql5.com/it/users/rays96/seller
Questo indicatore è stato Progettato da RaysFX

Indicator for determining the direction of the current trend Sends signals about trend changes to the terminal, smartphone and email Allows you to quickly navigate when changing price direction Works on all timeframes, on any currency pairs, metals and cryptocurrencies Can be used when working with binary options Distinctive features Doesn't redraw Gives three types of signals Has simple settings Quickly adapts to any trading instrument; Works on all timeframes and all symbols; Suitable for trad
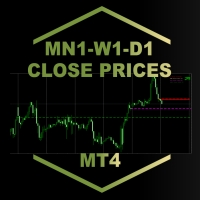
MN1-W1-D1 Close Price Indicator to Index Trading for MT4
The indicator draws lines to the close prices of the last closed bars of monthly, weekly and daily timeframes. Observably, these prices are significant support and resistance prices at major indices, like Nasdaq, DAX. The info panel always shows the prices relative to each other in the correct order. If the current price is the highest - i.e. higher than the last monthly, weekly and daily closing price - it is in the first row. The lowest
L'indicateur Scalper Signal Tarek pour mt4 (Metatrader 4) fournit des signaux de scalping pour n'importe quelle paire de devises sur n'importe quelle période, même sur le graphique journalier.
L'indicateur est très fiable, léger et ne ralentira pas votre plateforme de trading.
Les signaux apparaissent sur la fenêtre principale du graphique MT4 sous la forme de flèches de signal de couleur verte et rouge.
Signal d'achat et de vente :
Ouvrez une position d'achat lorsque la flèche verte est im

Miko Trend is a hybrid trend indicator, as it is based on signals from elementary indicators and a special algorithm for analysis. The indicator shows favorable moments for entering the market. The indicator's intelligent algorithm determines the trend, filters out market noise and generates input signals.
The indicator can be used primarily to determine the trend. The indicator can work both for entry points and as a filter. Uses two parameters for settings. The indicator uses color signaling

RaysFX TMAT3 è uno strumento potente che combina due tipi di medie mobili per aiutarti a identificare e seguire le tendenze del mercato. L’indicatore utilizza una media mobile triangolare centrata (TMA) e un T3 Moving Average. Queste due medie mobili lavorano insieme per fornire segnali di trading chiari e tempestivi. Quando il T3 Moving Average è inferiore alla TMA, l’indicatore considera che la tendenza del mercato sia al rialzo e genera un segnale di acquisto. Al contrario, quando il T3 Movin
The Ruby Trend indicator calculates the saturation levels of the price chart. A signal to exit the resale area is a buy signal. A signal to exit the overbought area is a signal to sell. Usually you need to set relative values for the overbought and oversold levels Bottom and Top for this indicator.
Most often, a good trend is visible visually on the price chart. But an experienced trader must clearly understand the current balance of power in the market before entering. And the indicator will

Using the Neo Forex indicator algorithm, you can quickly understand what trend is currently developing in the market. The NeoX indicator accompanies long trends and can be used without restrictions on instruments or timeframes. Using this indicator you can try to predict future values. But the main use of the indicator is to generate buy and sell signals. The indicator tracks the market trend, ignoring sharp market fluctuations and noise around the average price. The indicator implements a type

The Compare Graphs indicator is an analysis tool that allows traders to compare two or more graphs on the same chart window. This indicator is commonly used in trading platforms such as MetaTrader and provides a clearer comparison of different financial instruments or time frames.
Functions of the Compare Graphs indicator may include: Selecting Charts: The trader can select the charts he wants to compare, such as price charts of different currency pairs or indicators on the same chart. Setting

Subscribe to the 'MA7 Trading' channel to receive notifications about new programs, updates and other information. Ask questions in the profile on the MQL5 .
Description of work
The 'MA7 Viola' indicator is based on the standard Moving Average (MA) indicator. Shows a sharp increase or decrease in the moving average. Detailed information about the 'MA7 Viola' indicator.
Indicator settings
General settings: Difference – difference between the last two MA values, percentage; Period ; Method ; Ap
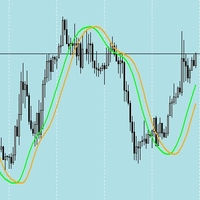
The Hull Moving Average (HMA) is renowned for its ability to smooth price movements effectively while maintaining responsiveness to recent price changes. When combined with a shifted Hull Moving Average crossover strategy, it offers a robust approach for identifying trends. Here's why: 1. Smoothness and Responsiveness : The HMA reduces noise in price data due to its weighted moving average calculation, which prioritizes recent prices. This smoothness helps filter out insignificant price fluctuat

RaysFX Forcaster è un indicatore avanzato per MetaTrader 4, progettato per fornire previsioni accurate del mercato. Questo indicatore utilizza un algoritmo sofisticato per calcolare i valori futuri basandosi su una serie di parametri configurabili dall'utente.
Caratteristiche principali: - TimeFrame : Permette all'utente di impostare il timeframe desiderato. Supporta diversi timeframes come M1, M5, M15, M30, H1, H4, D1, W1 e MN. - HalfLength : Questo parametro determina la lunghezza della metà

MEGA TREND DASHBOARD
This Dashboard shows the Currency Strength across multiple timeframes. This SUPER DASHBOARD, Not only does it get your watchlist of currency pairs and shows the strength of each currency across the timeframes you Select - but also does it in a way that You can check it in 1 second!!! This indicator is very powerful because it is based on our custom algorithm to show the trends that are existing right now! The indicator does all the work for you by showing you what is

RaysFX Engulfing
RaysFX Engulfing è uno strumento potente per identificare i pattern di engulfing nel mercato Forex. Questi pattern sono segnali di inversione di tendenza che possono fornire opportunità di trading preziose. Caratteristiche principali : Rilevamento di pattern engulfing : L’indicatore identifica i pattern engulfing rialzisti e ribassisti, che sono segnali di possibili inversioni di tendenza. Segnali visivi : I pattern rilevati vengono evidenziati sul grafico con frecce blu e ro

RaysFX DMI
Presentiamo l’Oscillatore RaysFX DMI, un indicatore personalizzato per la piattaforma di trading MetaTrader 4. Questo indicatore unico è progettato per fornire segnali di trading chiari e precisi basati sull’Indice di Movimento Direzionale (DMI). Caratteristiche principali: Oscillatore DMI: Calcola un oscillatore DMI basato su un periodo DMI specificato e un metodo di media mobile. Smoothing: L’oscillatore DMI viene ulteriormente lisciato in base a un periodo di lisciatura e a un

Subscribe to the 'MA7 Trading' channel to receive notifications about new programs, updates and other information. Ask questions in the profile on the MQL5 .
Description of work
The 'MA7 Galega' indicator is based on the standard Moving Average (MA) indicator. Shows a puncture of the moving average. Detailed information about the 'MA7 Galega' indicator.
Indicator settings
General settings: Period – MA period; Method – MA method; Apply to – price type; Consider the direction of the candle .
M

RaysFX Dynamic Cycle Explorer (DCE) RaysFX Dynamic Cycle Explorer (DCE) è un potente indicatore di trading sviluppato per la piattaforma MetaTrader 4. Progettato con l’obiettivo di fornire ai trader un vantaggio competitivo, DCE utilizza algoritmi avanzati per identificare e segnalare le opportunità di trading più promettenti. Caratteristiche principali Multi-periodo: DCE utilizza sei periodi diversi per calcolare i suoi segnali, offrendo una visione completa del mercato. Super Trend Price: DCE

RaysFX Candlestick Signals
RaysFX Candlestick Signals è un potente strumento progettato per migliorare la tua esperienza di trading su MT4. Questo indicatore personalizzato è stato sviluppato con l’obiettivo di fornire segnali di trading precisi e tempestivi basati su specifiche configurazioni di candele e l’indicatore RSI. Caratteristiche principali : Segnali di acquisto e vendita : L’indicatore genera segnali di acquisto e vendita basati su specifiche configurazioni di candele e valori dell’i
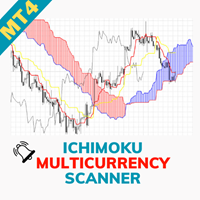
The Ichimoku Multicurrency Scanner Dashboard MT4 is a powerful trading tool designed for monitoring multiple currency pairs and timeframes using Ichimoku Kinko Hyo. It organizes signals in a grid format, with symbols grouped by base currencies and timeframes, ranging from M1 to MN1. Traders can enable or disable specific timeframes to suit their strategies. You can find the MT5 version here Ichimoku Cloud Multicurrency Scanner MT5 For detailed documentation click here Ichimoku Integration:
Tendance Up Down - détermine la tendance elle-même. L'identification correcte de la tendance détermine 95 % de l'efficacité du trading. Et si un trader détermine toujours avec précision la direction de la tendance, il n'aura alors qu'à attendre des corrections dans la direction de la tendance et à ouvrir des transactions. Dans toute stratégie de trading, vous devez identifier correctement la tendance. Si la tendance n'est pas définie correctement, le trader ne pourra pas entrer efficacement sur

Pivot Points และระดับ (Support) และ(Resistance) บนแผนภูมิการเทรดใน MetaTrader 4 สำหรับตลาด Forex : คำนวณ Pivot Points : สคริปต์คำนวณจุด Pivot โดยใช้ข้อมูลราคาประวัติศาสตร์ เช่น ราคาเปิด, ราคาสูงสุด, ราคาต่ำสุด, และราคาปิด จากช่วงเวลาที่กำหนด (เช่น วัน, ชั่วโมง, ฯลฯ) จุด Pivot และระดับต่างๆ เช่น R1, R2, R3 (ระดับการต้านทาน) และ S1, S2, S3 (ระดับการสนับสนุน) ถูกคำนวณออกมา แสดงบนแผนภูมิ : หลังจากคำนวณจุด Pivot และระดับต่างๆ, สคริปต์จะแสดงเส้นเหล่านี้บนแผนภูมิ MT4 เพื่อช่วยให้นักเทรดสามารถเห็นจุดที่
MetaTrader Market - les robots de trading et les indicateurs techniques pour les traders sont disponibles directement dans votre terminal de trading.
Le système de paiement MQL5.community est disponible pour tous les utilisateurs enregistrés du site MQL5.com pour les transactions sur les Services MetaTrader. Vous pouvez déposer et retirer de l'argent en utilisant WebMoney, PayPal ou une carte bancaire.
Vous manquez des opportunités de trading :
- Applications de trading gratuites
- Plus de 8 000 signaux à copier
- Actualités économiques pour explorer les marchés financiers
Inscription
Se connecter
Si vous n'avez pas de compte, veuillez vous inscrire
Autorisez l'utilisation de cookies pour vous connecter au site Web MQL5.com.
Veuillez activer les paramètres nécessaires dans votre navigateur, sinon vous ne pourrez pas vous connecter.