Regardez les tutoriels vidéo de Market sur YouTube
Comment acheter un robot de trading ou un indicateur
Exécutez votre EA sur
hébergement virtuel
hébergement virtuel
Test un indicateur/robot de trading avant d'acheter
Vous voulez gagner de l'argent sur Market ?
Comment présenter un produit pour qu'il se vende bien
Indicateurs techniques pour MetaTrader 4 - 128

Fast Scalping is a new product that allows you to identify the current market phase (uptrend, downtrend or flat). Represents a typical investor strategy that usually indicates a trend change from bearish to bullish. A tool that allows you to determine the direction and strength of a trend. Unlike most indicators, Fast Scalping finds longer trends and gives fewer false signals.
This indicator displays arrows of different colors depending on the current state of the market and thus signals the u

Title: Best Reversal Indicator - A Custom MQL4 Indicator for Trend Reversals Description: The "Best Reversal Indicator" is a custom MetaQuotes Language 4 (MQL4) indicator designed to identify potential trend reversals in financial markets. This indicator is intended to be used on MetaTrader 4 (MT4) trading platforms. Key Features: Non Repaint: Best Reversal Indicator is a non repaint indicator means It does not remove its signal after moving forward. Trend Reversal Detection: The indicator scan

The Game-Changing Engulfing Candle Hunter - Your Guide to Profitable Trend Trading
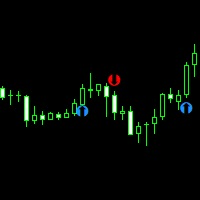
Step into the realm of trading possibilities with our revolutionary product - The Engulfing Hunter. Designed by traders for traders, this dynamic indicator combines the potency of engulfing candlestick patterns and the versatility of proprietary trend detection system, offering a trading edge unlike any other. Engulfing candlestick patterns have always been a revered tool in the arsenal of seasoned traders. Acting
**Features:**
1. **Innovative Trend Tracking:** The UT BOT Simple Indicator leverages the power of the Average True Range (ATR), a renowned volatility measure, to calculate precise trailing stop values, providing unparalleled insights into market trends.
2. **Customizable Settings:** Flexibility is paramount in any trading strategy. With this in mind, our indicator allows you to adjust the ATR periods and other key parameters to tailor the tool to your trading style and strategy.
3. **Real-t

Introducing the Kangaroo Hunter - Your Ultimate Edge in Forex Trading ATTENTION Forex Traders! Are you in constant pursuit of high-probability trade setups? Or maybe you're a novice trader struggling to pinpoint precise entry and exit points? Our solution, the Kangaroo Hunter, is about to revolutionize your trading journey. This meticulously designed indicator simplifies and refines the art of identifying the often elusive Kangaroo Tail patterns in the Forex market, pushing your trading strateg
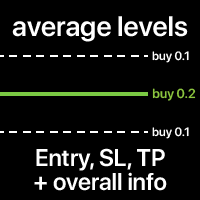
Les niveaux moyens d'entrée, SL et TP de toutes les transactions sur le symbole. Les niveaux peuvent être calculés ensemble ou séparément pour les transactions d'achat et de vente. Vous pouvez afficher des informations supplémentaires en option : prix du niveau, taille totale du lot, profit/perte flottant. Les styles et couleurs des niveaux sont personnalisables. Utilitaire multifonctionnel : inclut 66+ fonctionnalités | Contactez-moi si vous avez des questions | Version MT5 Dans les param

Cet indicateur utilise plusieurs indicateurs pour générer des transactions de signaux très gagnantes
Alertes et signaux améliorés sur V3
Live Testing
L'indicateur TrendArrowsAlerts pour Metatrader 4 est un système de trading FX complet qui imprime des flèches d'achat et de vente précises sur le graphique.
L'indicateur apparaît dans la fenêtre principale du graphique MT4 sous forme de flèches colorées vertes et rouges.
L'utilisation de signaux générés par un seul indicateur peut être risq

The Strong Volume Trend MT4 indicator is a powerful tool designed to help traders identify and capitalize on significant volume trends in the financial markets. With its advanced algorithm, this indicator accurately detects the strength and direction of volume movements, allowing traders to make informed trading decisions. Features: Volume Strength Analysis: The indicator analyzes the volume data and identifies strong volume trends, helping traders spot potential market reversals, breakouts, or

Introducing the "Amusing Entry Arrows" signal indicator, a powerful tool designed to enhance your trading experience on the H1 chart. With its advanced features and customizable arrow settings, this indicator provides valuable insights and timely alerts to help you make informed trading decisions. Key Features: H1 Chart Compatibility: The "Amusing Entry Arrows" indicator is specifically designed to operate on the H1 timeframe, allowing you to analyze price movements effectively within this timef

Visualisation des transactions, réparties par niveaux de prix. Vous pouvez définir n'importe quelle période pour le calcul : entre deux lignes verticales ou un intervalle de temps fixe. Les niveaux de l'histogramme sont relatifs : une barre plus large signifie un volume de trading plus important. Les extrêmes de distribution peuvent être utilisés comme niveaux de support et de résistance.
Tous les styles, tailles et couleurs sont personnalisables. Utilitaire multifonctionnel : inclut 66+ fonct

Candle Binary Scalper est un produit d'analyse technique pour le forex et les options binaires.
Comprend plusieurs indicateurs techniques combinés dans un système commercial.
Convient pour le trading manuel dans une tendance, pour le scalping et les options binaires. Fonctionne sur tous les délais et instruments de trading.
Les délais recommandés pour le trading M15, M30, H1 et H4, M5 et M1 doivent être utilisés en cas de forte volatilité. Il existe plusieurs types d'alertes.
Comment utiliser l

Trusty Super Signal Indicator
The Trusty Super Signal Indicator is a powerful technical analysis tool designed to assist traders in making informed trading decisions in the financial markets. With its advanced algorithm and user-friendly interface, this indicator provides accurate and timely signals to help identify potential trading opportunities.
Features: 1. Reliable Signal Generation: The Trusty Super Signal Indicator uses a sophisticated algorithm to generate high-quality trading signal

Meet the Tweezer Hunter, an essential tool for every Forex trader looking to make accurate, trend-following trades. This powerful, intuitive indicator helps traders spot potential trend reversals before they happen, providing a significant advantage in the fast-paced world of Forex trading. The Tweezer Hunter is more than your average tweezer candle indicator; it's designed with a built-in trend identification feature that accurately detects whether the market is bearish or bullish. By integrat

Candle confirmer is the indicator you need when you're waiting for the last candle to confirm to make an excellent order, this indicator will alert you if the current candle has had a higher or lower price compared to the previous candle. Stop trying to guess and start focusing on what really matters. You can activate or deactivate the alerts, chose the time-frame and even change the size, color and position of the indicator. Don't forget to leave your review and comments, it helps us improve

It is no secret that the movements of currency pairs for a certain part of the time occur in a certain price corridor, which is called a channel. The lower limit is considered the level of support, the upper one - resistance. Do not confuse with horizontal support and resistance levels! The distance between the support and resistance levels of a channel is called the range or channel width. The key difference between the Channel Mirosh indicator and other channel indicators (for example, from th
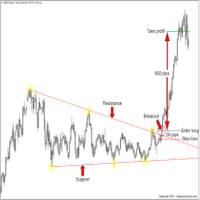
October OFFER: Free Ea with it This is valid till 30th of October. After purchase of indicator connect me on telegram @anabullbear or inbox in mql5 to get free Ea It's a Breakout Scalper On support and resistance and order blocks. Benefits of the indicator: does not redraw arrows. works on all currency pairs. high signal accuracy good for scalping Accuracy level is more than 95 percent. Best TF m15 for gold and major FX pairs Indicator settings: Default for M15,M30, H1 Best Pair -Gold and majo

Combinez avec Delta Footprint Chart pour une image complète du profil de volume du marché :
https://www.mql5.com/en/market/product/9415 3 L'indicateur "Order Book" affiche un histogramme sur le graphique des prix représentant les clusters de volumes bid et ask.
L'indicateur analyse les données de prix historiques et calcule les groupes de volume d'offre et de demande pour chaque niveau de prix dans un nombre spécifié de barres. Les groupes de volumes d'enchères sont affichés en bleu, tand
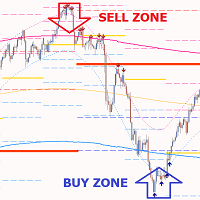
Gold PL MTF - c'est un excellent indicateur technique d'actions. L'algorithme de l'indicateur analyse le mouvement du prix de l'actif et reflète automatiquement les niveaux pivots importants de la période spécifiée (TF) à l'aide de la méthode de Fibonacci (section dorée).
L'indicateur décrit parfaitement la trajectoire du prix de la période sélectionnée (jour, semaine, mois, année), détermine le début d'une tendance et le début d'une correction, qui peut évoluer vers une tendance opposée.
L'i
This indicator uses candlesticks with large real bodies to predict possible market structure shift. Displacement is a very powerful move in price action resulting in strong selling or buying pressure. Generally speaking, displacement will appear as a single or a group of candles that are all positioned in the same direction. These candles typically have large real bodies and very short wicks, suggesting very little disagreement between buyers and sellers. Often, a displacement will occur just af

Optimized Version of the Pivot-Based Adaptive Support, Resistance, and Signal Line Indicator No Parameters, Simple and Easy to Use, Suitable for Daily and Lower Timeframes. Advantages: Applicable to all instruments. Suitable for all timeframes. The indicator automatically adjusts with changing data, providing more accurate signals. Instructions for Use: If the current price breaks above the signal line, the trend is bullish, with the initial target being the upper resistance line. If the price

Introducing the Great Oscillator Trend Indicator – a powerful tool designed to enhance your trading strategies and improve your decision-making process.
The Great Oscillator Trend Indicator is a versatile technical analysis tool that helps you identify trends and potential reversals in the financial markets. It utilizes a combination of oscillators and moving averages to generate accurate and reliable signals.
With this indicator, you can easily spot overbought and oversold conditions, as w

The Zigzag Value Indicator is a powerful technical analysis tool designed to assist traders and investors in identifying significant price movements and trends in financial markets. With its advanced algorithm, this indicator helps users determine key turning points and potential reversals, providing valuable insights for making informed trading decisions. To View Our Other Products Go to the link: Other Products
Features:
1. Zigzag Pattern Detection: The Zigzag Value Indicator detects and

All Symbols AND All Time frames Scan
Document Introduction
A breakout refers to when the price of an asset moves above a resistance zone or moves below a support zone. A breakout indicates the potential for a price trend to break.Break provides a potential business opportunity. A break from the top signals to traders that it is better to take a buy position or close a sell position. A breakout from the bottom signals to traders that it is better to take sell positions or close their bu

1 of 10 for 69$
.
Next Price is 89$
SMC Unmitigated Finding is a indicator for find unmitigated supply and demand in previous legs of price
Settings Zigzag Settings ZZDepth - by Default is 12.
ZZDeviation - by Default is 5.
ZZBackStep - by Default is 3. Rectangle Settings SupportColor- color for Support line.
ResistanceColor - color for Resistance line.
Settings Num of Show - Number of Support & Resistance Show.

The DVV indicator is a multifaceted informative indicator for the Forex market or the Cryptocurrency market . The indicator gives clear and reliable signals without redrawin g. The indicator can be used in bots by taking readings from its zero buffer.
Please note that for different currency pairs, the settings must be selected separately, this is not difficult.
Changing the input parameters greatly affects the display. I will show four options for using the indicator. The indicator ha

Gioteen Volatility Index (GVI) - your ultimate solution to overcoming market unpredictability and maximizing trading opportunities. This revolutionary indicator helps you in lowering your losing trades due to choppy market movements. The GVI is designed to measure market volatility, providing you with valuable insights to identify the most favorable trading prospects. Its intuitive interface consists of a dynamic red line representing the volatility index, accompanied by blue line that indicat
Découvrez le pouvoir des tendances du marché comme jamais auparavant avec l'indicateur de tendance multi-périodes 3-HMA. Cet outil fiable est votre partenaire de confiance dans le monde complexe du trading forex. Conçu avec la polyvalence et la précision à l'esprit, cet outil est idéal pour les traders qui comprennent l'importance du suivi des tendances et souhaitent tirer parti de la réactivité incomparable de la Moyenne Mobile de Hull (HMA).
La Moyenne Mobile de Hull se distingue des moyenne
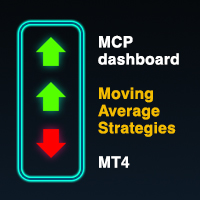
Multicurrency indicator in table format. Signals appear with confirmation, no repaints. Works on the current (open) timeframe. Notifications come for an open instrument. In the indicator settings, you can choose 1 of 4 Moving Average strategies. Strategies (represented in screenshots): Classic fast and slow moving average crossover Reverse signal of classic crossing (used for flat/sideways movement) Classic crossover relative to a slower moving average (Trend MA in settings) Price touching the f
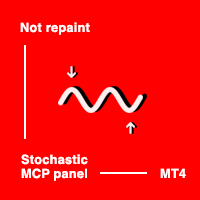
Multicurrency indicator in table format. Signals appear with confirmation, no repaints. In the settings, you can select the number of candles/bars on which the signal will still be displayed so that the trader takes it into account and does not miss it. The indicator works on the current (open) timeframe. Notifications come for an open instrument. In the indicator settings, you can choose 1 of 4 Stochastic strategies Strategies (represented in screenshots): The main line crosses the signal line

Introducing Real Cross System , the cutting-edge trading signal indicator designed to revolutionize your trading experience. Whether you are a seasoned trader or a newcomer to the financial markets, this powerful tool is engineered to provide accurate and timely signals, empowering you to make informed trading decisions with confidence. Features: Real-Time Signal Generation: Real Cross System utilizes advanced algorithms to generate real-time trading signals based on precise market analysis.

"Turbo Helper pour le scalping" est un système de trading entièrement préparé. Il indique au trader par une flèche sur le graphique quand ouvrir un ordre et dans quelle direction. Il indique également au trader par un symbole carré quand fermer le trade. Ensuite, l'indicateur affiche sur le graphique le nombre estimé de points pour le trade. Cette valeur peut légèrement varier car l'indicateur ne prend pas en compte la taille réelle du spread et du swap de votre courtier. Cependant, pour calcule

L'indicateur de stratégie intelligente est un système de trading qui vous permet d'analyser le marché en termes de plusieurs aspects de l'analyse technique. Le premier d'entre eux est un canal de prix, qui est construit automatiquement et permet au trader de voir la direction principale du mouvement des prix. Il permet également d'analyser le marché à l'aide d'une stratégie de canal (casse et rebond des lignes de canal).
Le bloc 2 est le système SAR, qui donne des informations générales sur le
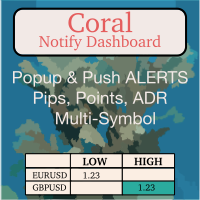
Coral Notify Dash allows you to manage all of your chart price-based notifications from a single consolidated dashboard. It fills a gap left by MT4, which does not support popup alerts. If you're like me and you often don't hear the alert sound for the built-in alerts, this is an indispensable tool. I use Coral Notify Dash as part of my daily chart analysis workflow. I use a tool like Coral Dash (available for free, here ) or one of the other dashboards to set my trading bias. As I review t

The Exact Arrow Entry Signal Indicator is a powerful tool designed to assist traders in making informed decisions in the financial markets. This advanced indicator leverages cutting-edge algorithms and technical analysis to identify potential entry points with high accuracy.
Features: 1. Precision Entry Points: The indicator generates precise arrow signals on the chart, highlighting potential entry points for various trading strategies.
2. Trend Identification: By analyzing price movements a

Presenting the uGenesys Break of Structure and Change of Character Indicator The uGenesys Market Structure Indicator is the advanced solution designed specifically for forex traders seeking a competitive edge. This innovative tool goes beyond merely identifying Break of Structure (BoS) and Change of Character (CHoC); it also illuminates optimal entry and exit points on your forex charts, transforming your trading experience.
While the uGenesys Market Structure Indicator can reveal pivotal pat

Arbitrage MACD: Your Key to Analyzing Market Trends
The Arbitrage MACD is a cutting-edge indicator designed to assist traders and investors in analyzing market trends with greater precision and confidence. MACD, which stands for Moving Average Convergence Divergence, is a well-known and widely used tool in the financial world, and the "Arbitrage MACD" takes its functionality to the next level.
This innovative indicator offers a comprehensive analysis of the relationship between two moving ave

The " Arbitrage RSI " is a cutting-edge technical indicator designed to assist traders in making informed decisions in the financial markets. This powerful tool leverages the concept of Relative Strength Index (RSI) divergence to identify potential trading opportunities. To View Our Other Products Go to the link: Other Products
Features: RSI Divergence Detection: The Arbitrage RSI excels at identifying divergence patterns in the RSI indicator. By comparing the price action with the RSI move
The Finding Average Volume indicator for MetaTrader 4 is a technical analysis tool that calculates the average volume of swing bars. Swing bars are a type of price chart pattern that identifies potential turning points in the market. The indicator is displayed as a zigzag trend line that is bounded by two vertical lines. The average volume is calculated for the entire swing bar pattern. Benefits of Using the Finding Average Volume Indicator Identify potential trend changes: The Finding Average

ATR Channels Indicator Introducing the ATR Channels Indicator, a powerful tool designed to enhance your trading experience and provide valuable insights into market volatility. ATR, short for Average True Range, is a technical indicator that helps traders understand the overall price volatility of an asset or market. The ATR Channels Indicator takes the ATR calculations to the next level by plotting them as dynamic channels on your price chart. These channels represent the range within which pri

Introducing ICT Reaction Levels, a reliable indicator designed to plot key levels on your chart. Unlike classical support and resistance, these levels are derived from significant highs and lows observed on higher timeframes, such as the weekly and monthly periods. The indicator provides a valuable tool for traders seeking to identify critical price levels based on historical price reactions.
ICT Reaction Levels analyzes price action on the specified timeframe, using special inputs to determin

The FollowLine indicator is a trend following indicator. The blue/red lines are activated when the price closes above the upper Bollinger band or below the lower one.
Once the trigger of the trend direction is made, the FollowLine will be placed at High or Low (depending of the trend).
An ATR filter can be selected to place the line at a more distance level than the normal mode settled at candles Highs/Lows.
Some features: + Trend detech + Reversal signal + Alert teminar / mobile app

Title: Best Trend Sniper Indicator - A Custom MQL4 Indicator for Spotting Potential Trends Description: Indicator Name: Best Trend Sniper Indicator Introduction: The "Best Trend Sniper Indicator" is a custom Meta Quotes Language 4 (MQL4) indicator designed to identify potential trends in financial markets. This indicator is intended to be used on Meta Trader 4 (MT4) trading platforms. Key Features: Non Repaint: The Best Trend Sniper Indicator is a non-repaint indicator, which means it does not
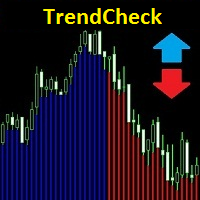
Cet indicateur dessine une ligne horizontale bleue ou rouge sous chaque bougie, qui indique la direction de la tendance. La ligne bleue signifie que la tendance est à la hausse, la ligne rouge est la tendance à la baisse.
L'indicateur a une nouvelle logique, qui le distingue considérablement de nombreux analogues. Il donne des signaux d'entrée et de sortie précoces, ne redessine pas ses valeurs - c'est-à-dire que si l'indicateur a donné un signal pour entrer dans une transaction, alors ce sign
RSI Divegence Win Pro
The RSI Drivergent is the best indicator for looking for price reversals.
RSI Drivergent Win Pro has used the strengths and best points of RSI to create in a format for traders to understand more easily.
Suitable for beginners and professional traders.
Case Up Trend : Blue line is below Yellow line. Case Down Trend : Blue line is abve Yellow line.
Usage is very easy. 1. Import the indicator into the MT4 chart. 2. Defind Overbought positions and defind oversold positi

MT5 Version
Understanding market sentiment is a critical aspect of successful trading. Market sentiment refers to the overall feeling or attitude of traders and investors towards a particular financial instrument, such as a stock, currency pair, or cryptocurrency. It is a collective perception of market participants' emotions and beliefs about the asset's future price direction. Market sentiment can be bullish (positive), bearish (negative), or neutral (sideways). Knowing the market sentiment c
SWING X Black est un indicateur révolutionnaire pour MetaTrader 4 (MT4), minutieusement conçu pour répondre aux besoins du trading manuel et automatique dans les domaines des options binaires et du Forex. Son exactitude inégalée, couplée à sa capacité à s'adapter à différents horizons temporels, en fait un outil puissant pour les traders qui cherchent à maximiser leurs profits. SWING X Black est optimisé pour l'horizon temporel de 15 minutes, idéal pour une prise de décision rapide et des exécut
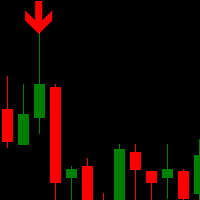
Trend Scalper Arrows is a unique trend reversal 100% non-repainting multi-algo indicator that can be used on all symbols/instruments: forex, commodities, cryptocurrencies, indices, stocks . Trend Scalper Arrows will determine the current trend at its early stages, gathering information and data from up to 10 standard algos When indicator give a valid buy or sell signal, a corresponding arrow will be printed on the chart, open trade at start of the next candle/bar indicating a
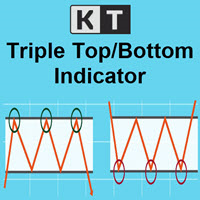
KT Triple Top-Bottom identifies the triple top/bottom pattern with a breakout signal in the opposite direction. It is used to identify potential trend reversals.
A Triple Top pattern is formed when the price reaches a high point three times, while a Triple Bottom pattern occurs when the price comes to a low point three times.
Features The indicator detects the triple top/bottom pattern with high precision and accuracy. The indicator suggests a shift in momentum, with sellers or buyers taking

KT DMA is a modified and advanced version of the classic Displaced Moving Averages with buy/sell crossover alerts and a Multi-Timeframe scanner that shows DMA's direction across each real-time time frame. A Displaced Moving Average is a simple moving average that moves ahead or backward in a time frame (either short-term or long-term). It also allows you to predict price movement more accurately.
Features Depicts the trend direction using the alignment of three moving averages. Buy/Sell signals
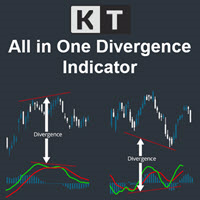
The KT All-In-One Divergence is designed to identify regular and hidden divergences between the price and 11 widely recognized oscillators. This powerful tool is indispensable for swiftly and accurately spotting market reversals. Its a must-have tool in any trader's arsenal, providing clear and accurate divergence patterns. Its accuracy and speed in identifying market reversals are remarkable, allowing traders to seize profitable opportunities confidently.
Features No Interference: You can ad

indicator CE and RF Buy-Sell Chandelier Exit and Range Filter Buy Sell
It is the ultimate indicator for telling entry points or entering trades with high accuracy.
Trades must be short term trading only or Scalping only, not suitable for holding positions across several days.
Suitable for beginner traders and professional traders.
Easy Operation 1. Import Indicator, CE and RF into MT4 chart. 2. Waiting for the signal from the arrow pointing up means recommending a long position. and an arro
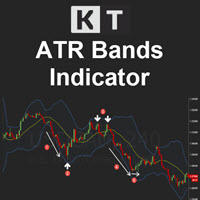
KT ATR Bands trace des enveloppes de volatilité en utilisant une combinaison de l’Average True Range (ATR) et d’une moyenne mobile. Ces bandes sont couramment utilisées pour détecter des points de retournement potentiels ainsi que des périodes de forte ou faible volatilité.
Fonctionnalités
Multi-unité de temps : Par exemple, vous pouvez afficher les bandes ATR du graphique journalier sur un graphique H1. Alertes intelligentes : Activez ou désactivez les alertes pour chaque bande, et définissez
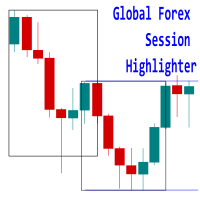
Introducing the 'Global Forex Session Highlighter' , a powerful tool designed to enhance your trading strategy by providing a visual representation of the Three major Forex trading sessions: Tokyo, London, and New York. This indicator is designed to help traders understand the dynamics of the global Forex market by highlighting the trading sessions directly on your MT4 chart. It provides a clear view of when each session starts and ends, allowing you to strategize your trades around the most
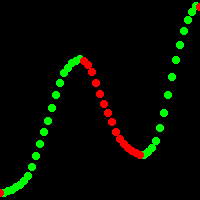
Doesn't redraw!
"Xhmaster formula forex indicator" - a new oscillator indicator with regression mathematical modeling of free numerical series. This indicator is 60% more accurate in identifying price reversal points compared to the standard "Xmaster formula" indicator, and it is less sensitive to small price fluctuations. "Xhmaster formula forex indicator" is a unique and advanced tool designed specifically for traders in the Forex market. It provides traders with excellent opportunities for su

However, the difficult task here for traders is to understand and select the indicator or tool that can help them with their trading plan and benefit their trading style. Traders want a tool that requires minimal effort and provides as much support as it can.
There are multiple reasons for which traders need an indicator. One such reason is to determine the buy-sell signals in the market. The King Binary Forex Scalping Indicator is a tool that can help traders get answers to many questions
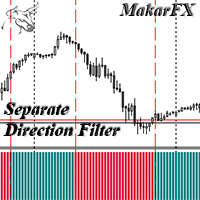
The indicator shows the Buy/Sell direction. The calculations use the opening prices and their rate of change for the billing period - "Calculation period" MTF indicator - "Calculation timeframe", no repaint - NRP. Two display types: "Simple histogram" or "Histogram level crossing" Alerts available: "Chart message", "Push message", "Email message" Two types of signals: "Change direction" or "Crossing level" Level settings: "Crossing UP level" and "Crossing DN level" Color settings. For EA: iCusto

In Forex trading, understanding support and resistance is crucial. Virtually every trading strategy incorporates these levels.
MetaTrader lacks built-in support and resistance calculation features, but there's a solution— the Support and Resistance Lines indicator.
This powerful MetaTrader indicator automatically calculates and displays support and resistance levels for any chosen currency pair or trading instrument.
Benefits of the Support and Resistance Lines indicator:
1. Identify better
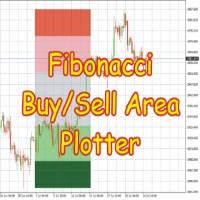
This Indicator is based on Fibonacci levels and draws Buy & Sell Areas. Buy areas are defined in green color (light green & dark green) while Sell areas are defined in red color (light red pink and darker color) Rectangles to easily know that whether price is in buy area or sell area. If price is in gray area, wait for price to come in to your desired area. You can use on any Forex Pairs.
This indicator calculates on the basis of h4 timeframe no matter what time frame you have selected, its calc

All Symbols AND All Time frames Scan
Document Introduction
The ABCD is a basic harmonic pattern. The ABCD pattern is a visual, geometric chart pattern comprised of three consecutive price swings. It looks like a diagonal lightning bolt and can indicate an upcoming trading opportu
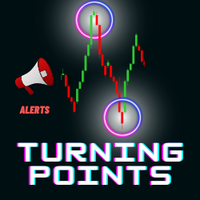
Cet outil permet d'analyser rapidement la structure du marché et de tirer parti des niveaux de prix importants.
Structure du marché Cet indicateur personnalisé trace les niveaux de prix importants, qui peuvent être utilisés comme points d'entrée ou comme objectifs de profit.
Identifiez votre fourchette de trading Cet indicateur vous permet d'identifier votre fourchette de trading en respectant les points de retournement du marché.
Opportunités de trading de rupture Utilisez cet indicateur

Multicurrency indicator in table format. Signals appear with confirmation, do not redraw. The indicator works on the current (open) timeframe. Notifications come for an open instrument. The strategy includes: price touching the moving average in the direction of the trend, as well as an extraordinary recalculation of the classic ADX indicator to determine the trend as an additional filtering of entries. Entries are displayed on the chart as arrows and, as mentioned above, the arrows are not redr

The indicator shows the Buy/Sell direction. The calculations use the opening prices and their rate of change for the billing period - "Calculation period" MTF indicator - "Calculation timeframe", no repaint - NRP. Two display types: "Chart default" или "Chart color" For "Chart color" color customization available : "Bar color" Two types stop levels: "Simple stop level" or "Dynamic stop level " Color settings: "Stop level color" Alerts available: "Chart message", "Push message", "Email message" F

Indicateur équipé d'un système de calcul du taux de gain [Caractéristiques de l'indicateur] Cet indicateur vous permet de confirmer intuitivement et facilement une analyse technique régulière avec des signaux de signalisation. De plus, il peut vérifier le taux de gain des paramètres actuels et comprend un système de détermination automatique du taux de gain qui évite de donner des signaux lorsque le taux de gain est faible. Cela réduit les entrées inutiles et vous permet de saisir des transac

Indicateur équipé d'un système de calcul du taux de gain [Caractéristiques de l'indicateur] Cet indicateur permet une confirmation intuitive et facile de l'analyse technique régulière par le biais de signaux de signalisation. De plus, il peut vérifier la pertinence des paramètres actuels en vérifiant le taux de gain et comprend un système de détermination automatique du taux de gain qui s'abstient de générer des signaux lorsque le taux de gain est faible. Cela réduit les entrées inutiles et p

Indicateur équipé d'un système de calcul du taux de gain [Caractéristiques de l'indicateur] Cet indicateur permet une confirmation intuitive et facile de l'analyse technique régulière par le biais de signaux de signalisation. De plus, il peut vérifier la pertinence des paramètres actuels en vérifiant le taux de gain et comprend un système de détermination automatique du taux de gain qui s'abstient de générer des signaux lorsque le taux de gain est faible. Cela réduit les entrées inutiles et p

Indicateur équipé d'un système de calcul du taux de gain [Caractéristiques de l'indicateur] Cet indicateur permet une confirmation intuitive et facile de l'analyse technique régulière par le biais de signaux de signalisation. De plus, il peut vérifier la pertinence des paramètres actuels en vérifiant le taux de gain et comprend un système de détermination automatique du taux de gain qui s'abstient de générer des signaux lorsque le taux de gain est faible. Cela réduit les entrées inutiles et p

Indicateur équipé d'un système de calcul du taux de gain [Caractéristiques de l'indicateur] Cet indicateur permet une confirmation intuitive et facile de l'analyse technique régulière par le biais de signaux de signalisation. De plus, il peut vérifier la pertinence des paramètres actuels en vérifiant le taux de gain et comprend un système de détermination automatique du taux de gain qui s'abstient de générer des signaux lorsque le taux de gain est faible. Cela réduit les entrées inutiles et p

Indicateur équipé d'un système de calcul du taux de gain [Caractéristiques de l'indicateur] Cet indicateur permet une confirmation intuitive et facile de l'analyse technique régulière par le biais de signaux de signalisation. De plus, il peut vérifier la pertinence des paramètres actuels en vérifiant le taux de gain et comprend un système de détermination automatique du taux de gain qui s'abstient de générer des signaux lorsque le taux de gain est faible. Cela réduit les entrées inutiles et p

Indicateur avec système de calcul du taux de victoire [Caractéristiques de l'indicateur] Cet indicateur permet une confirmation intuitive et claire de l'analyse technique régulière par le biais de signaux de signalisation. De plus, il peut vérifier la pertinence des paramètres actuels en vérifiant le taux de gain, et il comprend un système de détermination automatique du taux de gain qui s'abstient de générer des signaux lorsque le taux de gain est faible. Cela réduit les entrées inutiles et

Indicateur avec système de calcul du taux de victoire [Caractéristiques de l'indicateur] Cet indicateur permet aux traders de confirmer intuitivement et clairement l'analyse technique régulière par le biais de signaux de signalisation. De plus, il peut vérifier si les paramètres actuels sont appropriés en vérifiant le taux de gain, et il comprend un système de détermination automatique du taux de gain qui s'abstient de générer des signaux lorsque le taux de gain est faible. Cela réduit les en
Le MetaTrader Market est un magasin unique de robots de trading et d'indicateurs techniques.
Lisez le mémo de l'utilisateur de MQL5.community pour en savoir plus sur les services uniques que nous offrons aux traders : copie des signaux de trading, applications personnalisées développées par des freelancers, paiements automatiques via le système de paiement et le MQL5 Cloud Network.
Vous manquez des opportunités de trading :
- Applications de trading gratuites
- Plus de 8 000 signaux à copier
- Actualités économiques pour explorer les marchés financiers
Inscription
Se connecter
Si vous n'avez pas de compte, veuillez vous inscrire
Autorisez l'utilisation de cookies pour vous connecter au site Web MQL5.com.
Veuillez activer les paramètres nécessaires dans votre navigateur, sinon vous ne pourrez pas vous connecter.