Regardez les tutoriels vidéo de Market sur YouTube
Comment acheter un robot de trading ou un indicateur
Exécutez votre EA sur
hébergement virtuel
hébergement virtuel
Test un indicateur/robot de trading avant d'acheter
Vous voulez gagner de l'argent sur Market ?
Comment présenter un produit pour qu'il se vende bien
Indicateurs techniques pour MetaTrader 4 - 145
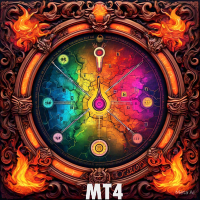
Heatmap Indicator for Advanced Volume Analysis The Heatmap Indicator offers a practical and visual approach to market volume analysis, enabling traders to make informed decisions quickly. Key Features 1. Volume Heatmap Representation Displays volume intensity using a clear color scale. Blue : Low activity Green : Moderate activity Orange : High activity Red : Maximum volume 2. Customizable Interface Adjustable color settings to suit user preferences. Optional real-time percentage display for ad

One of the key elements in trading is identifying zones or levels that allow traders to make buy or sell decisions during trading. أحد العناصر الأساسية في التداول هو تحديد المناطق أو المستويات التي تسمح للمتداولين باتخاذ قرارات الشراء أو البيع أثناء التداول. The indicator displays Fibonacci levels يعرض المؤشر مستويات فيبوناتشي drawing levels based on historical daily or weekly data. مستويات الرسم بناءً على البيانات التاريخية اليومية أو الأسبوعية. Daily levels update with each new day’s opening

Are you a newbie who feels like trading is rocket science? Fear not! With our new Indicator, you’ll trade like a pro—without the awkward space suit!Say goodbye to the confusion and hello to profits! Now you can impress your friends with your "expert" trading skills—even if you just learned what a stock is! :money_mouth:Trade smart, not hard! Grab the Trade Wiz-A-Matic today and let’s launch your trading journey! Key Features: Dynamic Levels : The indicator calculates and plots key levels based o

The indicator plots levels based on an internal equation So that it automatically draws levels as soon as it is placed on the chart Levels can be used as supports and resistors So that entry is based on testing the level And close down or up, depending on the direction It is also an effective tool and help in making the right decision *There are two options in the settings 1. Zone A 2. zone B Where Zone A shows the levels starting from 123-369 The zone B shows the levels to start 693-96

Enter/Exit indicator Try trading on signal change BUY/SELL to Sell SELL/BUY to buy or exit by signal change. Very good for trading news. - - - - - - - - - - Please leave positive comments. - - - - - - - - - - - - - - - - - - - - - - - - - - - - - - - - - - - - - - - - - - - - - - - - - - - - - - - - - Info: CalculatedBars = Indicator Calculated Bars; AlertConfirmation = true On false Off LongBarPoints = maximum point value for signal long bar size. Buffer0[] = Arrow Up; Buffer1[] = Arrow Down;

When geometric shapes meet with time and price, they give more confidence in the chart The indicator plots daily and weekly price triangles So that the weekly is kept until the end of the trading week While the Daily is changing with each opening The size of the triangles varies based on the previous data They will be an aid in decision-making, especially on both sides of the Triangle * Contains options to activate and disable triangles * Merge weekly and daily triangles together, each c
When time converges with price in a critical zone, it creates a pivotal area that simplifies decision-making. This is precisely the functionality of this indicator, as it integrates time and price to highlight a robust zone you can rely on.
Key Features of the Indicator: • Dynamic Time-Price Zones: The indicator draws a time-price zone determined by the user, based on customizable settings available in the configuration. • Customizable Day Selection: A dedicated field allows you to choose th

L' Indicateur Volume Bar POC est un outil innovant qui offre une visualisation précise des niveaux de prix clés (Point of Control, POC) basée sur le volume des ticks. Cet indicateur analyse chaque point de prix dans les bougies individuelles et affiche les niveaux les plus significatifs, qui peuvent être utilisés comme zones fortes de support et de résistance. Idéal pour les stratégies de trading intraday et à long terme. Comment fonctionne l’Indicateur Volume Bar POC ? L’indicateur utilise un p

**"Discounted Price."**
We are always in pursuit of the perfect time to achieve the desired price, as timing is a pivotal factor in trading. This is exactly what the indicator does: It seamlessly combines time and price, dynamically mapping them onto the chart using two lines that represent both time and price together, introducing a completely innovative conept. • No more complex settings. Simply place the indicator on your chart, and it will handle everything for you. ---------------------

Adjustable Volume Profile Indicator The Adjustable Volume Profile is a custom MetaTrader 4 (MT4) indicator designed to visually display the volume distribution of a financial instrument across a specific price range and time period. This indicator allows traders to analyze the volume profile based on either real volume or tick volume, helping to identify key levels of support, resistance, and market activity.
Key Features: Customizable Timeframe: The indicator can be set to any available timefr
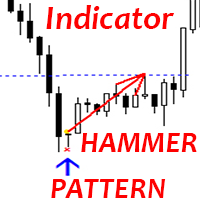
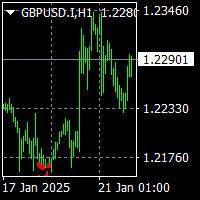
Indicateur Crypto_Forex "Hammer pattern" pour MT4.
- L'indicateur "Hammer pattern" est un indicateur très puissant pour le trading Price Action : Pas de repeinture, pas de délai. - L'indicateur détecte les modèles de marteau haussiers sur le graphique : signal de flèche bleue sur le graphique (voir les images). - Avec alertes PC, Mobile et Email. - L'indicateur "Hammer pattern" est excellent à combiner avec les niveaux de support/résistance.
// D'autres excellents conseillers experts et indic
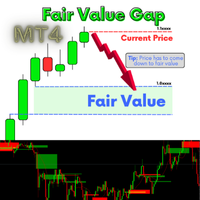
A fair value gap (FVG) is a temporary price gap that occurs when the price of a stock or security is out of line with its fair value. This gap is often caused by an imbalance between buyers and sellers. How it works Price imbalance When there is an imbalance between buyers and sellers, the price of a security can move too quickly. Price gap This creates an unadjusted area on the price chart, known as the fair value gap Price correction The price is often drawn back to the fair value gap, as i
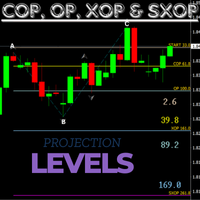
If you're familiar with COP, OP, and XOP levels, this indicator is definitely worth considering. There's no need to manually plot the ABC levels, as the indicator automatically calculates and displays the OP projection levels for you, updating regularly as the price changes.
This is an essential indicator for your trading toolkit. Please if you are unsual on how to use this indicator feel fell to ask me for help and i can assist you where i can.
Happy trading!

If you're familiar with trading using Dinapoli levels, then this indicator is definitely worth your attention. It automatically plots key levels such as COP (Change of Polarity), OP (Objective Price), and XOP (Extended Objective Price) on your charts, regardless of the timeframe you choose to work with.
One of the standout features of this indicator is its ability to generate alerts. Whenever a new ABC pattern is automatically identified and plotted by the indicator, you will receive a notifica
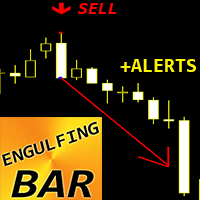
Crypto_Forex Indicator ENGULFING Bar Pattern pour MT4.
- L'indicateur "ENGULFING Bar" est un indicateur très puissant pour le trading Price Action : Pas de repeinture, pas de délai. - L'indicateur détecte les modèles de barres ENGULFING sur le graphique : - Barre ENGULFING haussière - Signal de flèche bleue sur le graphique (voir les images). - Barre ENGULFING baissière - Signal de flèche rouge sur le graphique (voir les images). - Avec alertes PC, mobile et e-mail. - L'indicateur "ENGULFING B
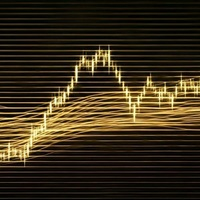
This is an indicator that seeks to show support and resistance zones in channels through expansion .
Abraxis Indicator Discover our innovative Abraxis Indicator , a powerful tool designed for traders seeking to refine their chart analysis and maximize their trading opportunities. This indicator was developed to operate efficiently across different timeframes, allowing you to adjust your strategies according to your needs. Key Features Calculation of Lines Based on Previous Pil
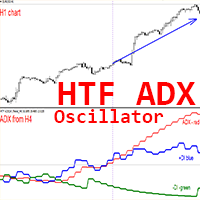
Crypto_Forex Indicator HTF ADX pour MT4.
- Améliorez vos méthodes de trading avec l'indicateur professionnel HTF ADX pour MT4. HTF signifie - Higher Time Frame. - ADX (ligne rouge) est utilisé pour mesurer la force de la tendance - si la valeur ADX est supérieure à 20 et a une forme ascendante - la tendance est forte. - Si le +DMI (ligne bleue) est au-dessus du -DMI (ligne verte) : le prix monte et l'ADX mesure la force de la tendance à la hausse. - Si le -DMI (ligne verte) est au-dessus du +D
To get access to MT5 version please click here . This is the exact conversion from TradingView: "Fearzone - Contrarian Indicator" by " Zeiierman ". The screenshot shows similar results from tradingview and Metatrader when tested on ICMarkets on both platforms. This is a light-load processing and non-repaint indicator. All input options are available. Buffers are available for processing in EAs. You can message in private chat for further changes you need. Thanks for downloading

Trump Arrow is for trading the trends of the markets. It uses convergence and divergence. Use it during active times to get behind a trend and follow it with MA filters or other strategies you have. The indicator works well for small time frames just and it suggests using 15 min. Others work too but for day trading 5-15 is best. 1 hr charts if you want to filter for longer term trends.

Ultimate Arrow Indicator - Votre outil pour réussir dans le trading ! Vous en avez assez des outils qui promettent beaucoup mais offrent peu ? Notre Ultimate Arrow Indicator pour MT4 est la solution définitive qui propulsera votre trading à un niveau supérieur. Cet indicateur a été conçu avec une précision chirurgicale pour vous offrir des signaux clairs, fiables et sans compromis. Voici pourquoi Ultimate Arrow Indicator est le choix idéal pour les traders expérimentés et les débutants : Perform
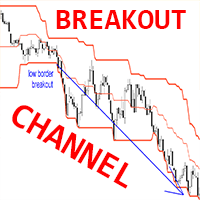
Crypto_Forex Indicator BREAKOUT CHANNEL pour MT4, No Repaint.
- Cet indicateur peut être utilisé comme un système de trading complet basé sur des cassures hautes/basse. - Il n'a qu'un seul paramètre - HYSTORY DEPTH, il reflète le nombre de bougies prises en compte par l'indicateur. - Valeurs recommandées pour le paramètre HYSTORY DEPTH : période D1 - 20 (un mois), H4 - 30 (une semaine), H1 - 24 (un jour). - BREAKOUT CHANNEL se compose de 3 lignes : High Border - prix max des N dernières bougie
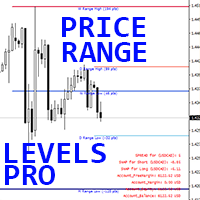
Indicateur Forex "Price Range Levels Pro" pour MT4.
- L'indicateur "Price Range Levels Pro" est un outil de trading auxiliaire professionnel très utile. - Il vous montre les niveaux quotidiens, hebdomadaires et mensuels les plus probables, qui peuvent être atteints par le prix (niveaux de fourchette de prix). - La fourchette quotidienne est utile pour les traders intraday. - Les fourchettes hebdomadaires et mensuelles sont utiles pour les traders Swing et à long terme. - L'indicateur est excel

Session Liquidity is the most anticipated trading strategy among the ICT trader. With this indicator you could frame the trade by simply deploying it on the chart. By simply inputting the Asian Opening Time, New York Opening Time, and choose the color option and display option you like then you will get the session laid down for you on the chart. You can choose between showing session as box or horizontal line. I personally trade this strategies for quite sometimes.
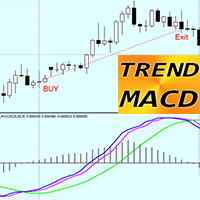
L'indicateur TREND MACD pour MT4 est un outil de trading formidable et efficace !
- Cet indicateur est idéal pour les traders de tendance qui cherchent à détecter les mouvements de prix importants. - TREND MACD se compose de 3 lignes : la ligne verte indique la direction principale de la tendance et les lignes bleues et magenta pour l'entrée et la sortie. - L'indicateur permet de maximiser les profits, sans sortir trop tôt d'une transaction rentable. - L'indicateur dispose d'alertes mobiles et
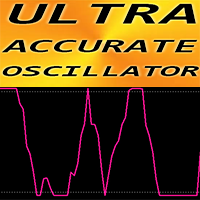
Oscillateur ULTRA PRÉCIS pour MT4.
UA Oscillator - est un indicateur Crypto_Forex personnalisé avancé avec une précision d'environ 80% lorsqu'il est utilisé en combinaison avec un indicateur de tendance tel que EMA par exemple.
- Une nouvelle méthode de calcul avancée est utilisée. UA Oscillator est beaucoup plus rapide et plus précis que les oscillateurs MT4 standard. - Nouvelle génération d'oscillateurs - voir les images pour voir des exemples d'utilisation en combinaison avec EMA10. - Vale
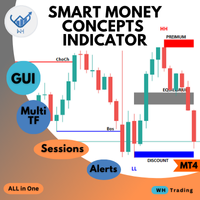
Welcome to the ultimate Smart Money Concepts indicator ,, this indicator is All-in-One package the only thing you need to empower
all the Smart Money Concepts in one place with interactive advanced gui panel with all the features and customization you need. MT5 Version : WH SMC Indicator MT5 *This Price For Limited Number of Copies.
Features: Main Section: User-Friendly Panel (GUI): Designed for traders of all experience levels, the indicator integrates seamlessly into your MT4 platfo

Indicateur Trend Master ZA Exploitez la puissance de l'analyse des tendances avec l'indicateur Trend Master ZA. Conçu pour les traders qui souhaitent combiner plusieurs stratégies techniques en un seul indicateur, cet outil puissant offre des informations approfondies sur les tendances du marché et les fluctuations des prix. Principales caractéristiques : Analyse des tendances avec les Bandes de Bollinger : Utilisez la puissance des Bandes de Bollinger pour identifier les tendances du marché. La

This is an indicator that seeks to show consolidation zones .
Discover the Power of Prediction with the Limiar Latus Indicator ! An innovative indicator designed for traders seeking to identify and anticipate crucial turning points in sideways market movements. Key Features: Predicting Changes: Utilizes advanced algorithms to detect sideways patterns, allowing you to anticipate significant movements before they happen. Clear Visual Analysis: With intuitive rectangles representing con
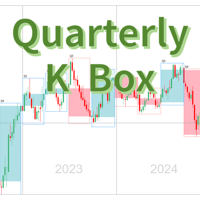
Description de l'indicateur de bougies trimestrielles en boîte Nom du produit Indicateur de bougies trimestrielles en boîte (Quarter K Box Indicator) Présentation du produit L'indicateur de bougies trimestrielles en boîte est un outil d’analyse technique spécialement conçu pour les traders Forex, actions et contrats à terme. Cet indicateur affiche l’amplitude des bougies trimestrielles (haut, bas, cours d’ouverture et cours de clôture) sur des graphiques de cadres temporels mensuels, hebdomada
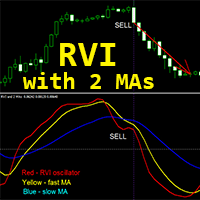
Indicateur Crypto_Forex "RVI et 2 moyennes mobiles" pour MT4, pas de repeinture.
- L'indice de vigueur relative (RVI) lui-même est un indicateur de momentum technique qui est très utile sur les marchés de tendance. - L'indicateur "RVI et 2 moyennes mobiles" vous permet de voir les moyennes mobiles rapides et lentes de l'oscillateur RVI. - L'indicateur est idéal pour le trading de momentum, en particulier sur de grandes périodes de temps : D1, H4, H1, M30. - Il est très facile de configurer cet
The KT Dynamic Price Oscillator (DPO) offers a specialized approach to analyzing the trend, momentum, and volatility of financial instruments. It excels at identifying trend continuations, overbought or oversold conditions, and potential reversal points with precision. It is specifically designed to assist traders in identifying short-term price cycles and potential reversals by effectively filtering out long-term trends.
How to use the DPO
Trend Confirmation: The DPO acts as a reliable confir
Waterfall Trading Indicator Overview The Waterfall Trading Indicator is a powerful momentum detection tool designed to identify high-probability trading opportunities across multiple timeframes. Built on pure price action analysis, this indicator provides clear, non-repainting signals that are especially effective for binary options and forex trading. Key Features Non-Repainting Signals : Based on real-time price action, ensuring reliable trade signals Multi-Timeframe Compatibility : Effective a

"The upgraded version of the Gold heat map. The indicator is more effective on the gold chart, where daily opportunities will appear clearly before you. Levels14Golden , introduces the integration of supports, resistances, and time, along with significant enhancements."
1. **Heatmap for Price Dynamics**: A heatmap has been added to indicate the intensity of price movements, ranging from **45 to 630 degrees**. - **Major Levels**: Marked in **blue**, as shown in the video. - **Sec
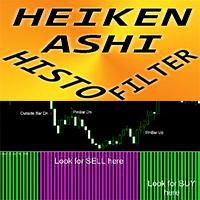
L'indicateur Crypto_Forex pour MT4 Heiken Ashi Histo Filter est un outil de trading auxiliaire formidable et efficace ! Pas de repeinture !
- Une nouvelle méthode de calcul avancée est utilisée - 10 options pour le paramètre "Prix pour le calcul". - Excellent à combiner avec les modèles d'action des prix : - Histogramme de couleur verte - Recherchez des modèles haussiers. - Histogramme de couleur magenta - Recherchez des modèles baissiers. - Il existe de nombreuses possibilités de mettre à niv
As an ICT or SMC trader you must do top-down analysis, and you struggle to make template of drawing object on Metatrader just like you normally do on Tradingview. Well, Drawing Assistance indicator will make your top-down analysis much easier on Metatrader. Allow to design template for 3 timeframes. (HTF, MTF and LTF). Each objects drawn on chart will have the color, style and visibility individually by the timeframe it was drawn on. Save time as all analyzing is done on Metatrader chart. Shortc
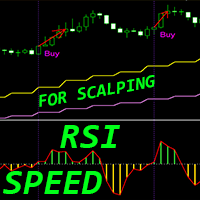
L'indicateur Crypto_Forex "RSI SPEED" pour MT4 est un excellent outil prédictif, sans retouche.
- Le calcul de cet indicateur est basé sur des équations de la physique. Le RSI SPEED est la 1ère dérivée du RSI lui-même. - Le RSI SPEED est bon pour scalper les entrées dans la direction de la tendance principale. - Utilisez-le en combinaison avec un indicateur de tendance approprié, par exemple HTF MA (comme sur les images). - L'indicateur RSI SPEED montre à quelle vitesse le RSI lui-même change

Fibo Extrema Bands is a unique indicator that visually demonstrates when the market shifts into a trend and highlights key levels acting as support or resistance. It combines easy-to-read “stepped” extrema lines with Fibonacci levels (whose values can be adjusted in the indicator’s inputs), simplifying the search for entry and exit points. Install Fibo Extrema Bands to gain a powerful tool for trend analysis and for identifying critical price levels! This product is also available for MetaTrade

Master alert is an indicator based on deep mathematical and statistical calculations. It generates two types of signals; Buy signals Sell signals It uses the following indicators to generate signals; Adx CCI SAR MACD MA WPR MOM When the indicator shows 6 or more of the above indicators with the same buy signal on the dashboard the market is trending up. It is a good time to place buy order. When the indicator shows 6 or more of the as above signals with the same sell signals the market is trendi
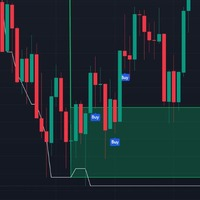
MACDx RSI Supply And Demand Indicator is a dynamic trading indicator designed to identify potential reversal zones in financial markets by combining the momentum insights of the Relative Strength Index (RSI) with order block (supply/demand) levels derived from a MACD-based custom tool. It visually highlights bullish and bearish zones on the chart, offering clear entry signals through directional arrows. Ideal for swing traders and reversal strategists, this tool aims to capture price reversals

Range indicator is a mt4 indicator that shows various levels to enter and Exit a trade. Once you have installed the indicator in the terminal you will see on the trading dashboard various values which include; Support level in pips from the current price, Resistance level in pips from the current price, Stop loss level in pips from the current price to exit if market conditions change
Range bound is a mt4 indicator that shows various levels to enter the market. It uses MACD as the primary reference indicator. When MACD oscillator is showing buy or sell signals these are displayed on your trading dashboard but as levels to buy or sell on the main chart. The indicator shows blue signals and red signals That are support and resistance levels. In short this indicator shows ranges where your trades should be safe from market changes against your order.
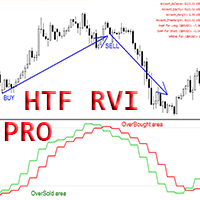
Crypto_Forex Indicator HTF RVI Pro Oscillator pour MT4.
- Améliorez vos méthodes de trading avec l'oscillateur professionnel HTF RVI Pro pour MT4. HTF signifie - Higher Time Frame. - RVI est l'un des meilleurs oscillateurs pour la détection des changements de tendance et l'entrée dans les zones de survente/surachat. - Cet indicateur est excellent pour les systèmes de trading multi-périodes avec des entrées d'action sur les prix dans les zones de survente/achat. - L'indicateur HTF RVI Pro vous

Arrow up down is a mt4 indicator that shows various levels to enter the market. It consists of two signals; Buy signal Sell signal Buy signals are shown as blue arrows on the chart once you install the indicator. Sell signals are shown as red signals on the chart. The indicator uses other underlying indicators like moving average together with statistical calculations to generate signals.
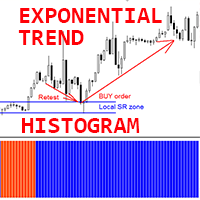
Indicateur Crypto_Forex "Histogramme de tendance exponentielle" pour MT4, sans repeinture.
- L'indicateur d'histogramme de tendance exponentielle est très efficace pour la détection des tendances. - La meilleure façon de l'utiliser est de le combiner avec les niveaux de support/résistance et la technique de retest (voir les images) : - Une fois que l'indicateur détecte une nouvelle tendance, recherchez le niveau SR local et organisez l'ordre en attente correspondant en attendant le retest de c

Trendfollow Indicator - with Stoploss and Trailingstop Accurate Signals – Identifies trend reversal candles Filter – for better trend detection Intelligent signal limitation - Only qualified signals in the trend direction are displayed Easy to use – Perfect for beginners & professionals Visual support – arrows in the chart + display in real time Notifications – Receive alerts & push notifications The indicator also provides the initial stoploss. As the position progresses, this is us

Ultimate Binary Options: The Best Indicator for Your Binary Options Trading If you're looking for a reliable, efficient, and powerful way to boost your results in binary options trading, Ultimate Binary Options is the perfect solution for you. This indicator was developed to provide traders with unparalleled accuracy, delivering success rates above 90% . But it's not just about numbers—it's about turning your strategies into consistently winning trades. What Makes Ultimate Binary Options S

RSI bands indicator is a mt4 indicator that shows various levels to enter trades based on market conditions. It consists of the below buffers; Yellow buffer Blue buffer White buffer When the yellow buffer is above blue buffer the market is trending up good place to open buy order. When the blue buffer is above yellow buffer the market is trending downwards good time to place sell order. Also another alternative scenario is when yellow buffer is above upper white band buffer indicates strong uptr

Rsi with Bollinger bands is a mt4 indicator that shows various levels to enter trades in the market based on conditions. It consists of two main buffers; Yellow buffer that is the current price Grey buffer that shows overbought and oversold levels. When the yellow buffer crosses 70 zone in grey buffer market is trending upwards. When the yellow buffer crosses below 30 zone in the grey buffer the market is showing a strong downtrend. The overbought and oversold levels are customizable in the ind
The OrderBlocks Trigger Indicator for MT4 provides essential information on the market structure. The indicator identifies major trend reversal and exhaustion points of momentum. As a result, forex traders can identify Bullish and Bearish price reversal zones and BUY and SELL accordingly. Moreover, the indicator provides Buy and Sell Arrow Signals.
An order block is a market structure that is identified as the last Bearish candle before a Bullish price move and vice versa. These order blocks a
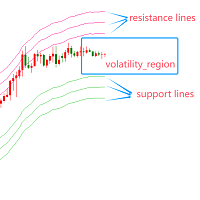
Indicator Introduction: The Volatility Range Indicator aims to help traders identify the current market's volatility range by analyzing historical price data. By calculating the upper and lower bounds of price fluctuations, traders can determine potential support and resistance levels, providing a foundation for subsequent trading decisions. This indicator is particularly suitable for ranging markets and high-volatility environments, as it can effectively assist traders in capturing price breako

The Gann Hi-Lo indicator is a powerful tool for trend analysis.
This modified version colors the signal line and chart candles according to the trend direction.
In an uptrend, the candles and the line appear in a bullish color, while in a downtrend, they are displayed in a bearish shade.
This makes it easier to visually identify trend changes and provides traders with clear guidance.
Thanks to the simple interpretation of the indicator, traders can quickly react to market movements and make wel

RiskMaster Pro Lotsize Protector
L'indicateur offre la forme la plus simple pour gérer le risque. Sans réglages compliqués, il fournit exactement les informations nécessaires pour l'exécution de l'ordre. Aucun réglage compliqué, sélectionnez le type d'ordre souhaité Market/Pending Orders, entrez le risque souhaité en pourcentage du capital disponible et le ratio risque-rendement (Risk-Reward-Ratio RRR). Market Orders : • Faites glisser la ligne de Stop Loss (SL) avec la souris à la position s

very simple indicator to help with fast risk management during volatility.
~Displays: - stop loss in points of your choice. - take profit in points of your choice. - what lot size to risk on the trade relative percentage.
~Values that can be changed: - take profit points. - stop loss points. - risk in percentage. - color of lines. - width of lines. - linestyle. - buy / sell trade.

Indicateur de Support et de Résistance Intelligent L'Indicateur de Support et de Résistance Intelligent est conçu pour améliorer votre analyse technique en identifiant automatiquement les niveaux clés de support et de résistance sur plusieurs périodes, aidant ainsi les traders à prendre des décisions éclairées. Cet outil calcule efficacement les points de prix les plus hauts et les plus bas sur une période donnée, en se basant sur les niveaux les plus testés, puis calcule la moyenne de ces nivea
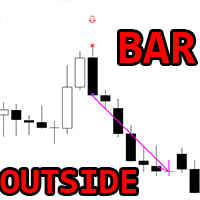
Indicateur Crypto_Forex OUTSIDE Bar Pattern pour MT4.
- L'indicateur "OUTSIDE Bar" est un indicateur très puissant pour le trading Price Action : Pas de repeinture, pas de délai. - L'indicateur détecte les modèles OUTSIDE Bar sur le graphique : - Barre OUTSIDE haussière - Signal de flèche bleue sur le graphique (voir les images). - Barre OUTSIDE baissière - Signal de flèche rouge sur le graphique (voir les images). - Avec alertes PC, Mobile et Email. - L'indicateur " OUTSIDE Bar Pattern " est
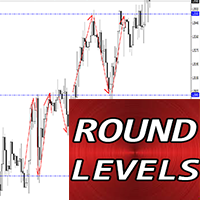
Indicateur Forex "Round Levels" pour MT4.
- L'indicateur "Round Levels" est un indicateur auxiliaire indispensable pour les traders qui prennent en compte le support/la résistance. - Les niveaux ronds sont très respectés par le prix - le prix rebondit très souvent à partir des niveaux ronds. - Utilisez un pas de 1000 points pour les périodes H4, D1. - Utilisez un pas de 500 points pour les périodes H1 et inférieures (pour le trading intraday). - Les niveaux ronds sont également utiles pour all

Indicateur Smarter Trend Channel Description :
L'indicateur Smarter Trend Channel est un outil puissant et flexible conçu pour aider les traders à identifier visuellement les principales tendances du marché en traçant dynamiquement des lignes de support et de résistance sur le graphique des prix. En utilisant des calculs fractals avancés, l'indicateur ajuste automatiquement les lignes de tendance en fonction des conditions du marché, permettant aux traders de repérer les cassures et les points
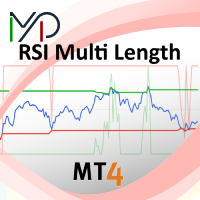
This indicator provides insights into Relative Strength Index (RSI) values over multiple timeframes. It highlights the percentage of RSIs across varying periods that are classified as overbought or oversold, and also calculates the average of these RSIs. The percentage of overbought or oversold RSIs is further utilized to define adaptive thresholds for these levels. Settings: Maximum Length: Specifies the longest RSI period used in the calculations. Minimum Length: Specifies the shortest RSI pe
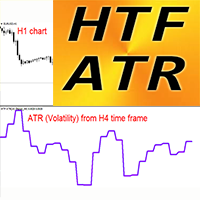
Crypto_Forex Volatility Indicator HTF ATR pour MT4.
- L'ATR (Average True Range) lui-même est l'un des indicateurs les plus importants - il montre la volatilité du marché. - HTF ATR est un indicateur de volatilité du marché utilisé dans l'analyse technique. HTF signifie - Higher Time Frame. - ATR est idéal pour planifier vos emplacements dynamiques Take Profits / SL : Par exemple, la plupart des valeurs SL optimales se situent dans les valeurs 1,2-2,5 ATR. - Cet indicateur est un outil utile à
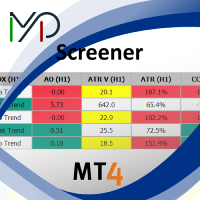
The MP Screener is a powerful and user-friendly tool designed for traders who need to filter and analyze multiple symbols based on various technical criteria. Whether you are a scalper, day trader, or swing trader, this screener helps you quickly identify the best trading opportunities in the market by scanning multiple timeframes and indicators in real time. With the MP Screener, traders can streamline their market analysis, making it easier to focus on profitable setups while saving time. Unl

ForexFire Renkotrader Recognize profitable entries & trade with confidence! Highlights: Precise signals – Identifies reversal candles in the trend EMA filter - Uses Ema`s for reliable signals Intelligent signal limiting - Only qualified signals are displayed Easy to use – Perfect for beginners & professionals Visual support - arrows in the chart + SL display in the chart Notifications – Receive alerts & push notifications This is how the indicator works: Long Signal:
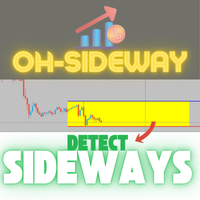
The indicator continuously calculates the current ATR value and displays it on the chart. If an adjustable threshold is undershot, a channel is automatically drawn to indicate a possible sideways movement. As soon as this threshold is exceeded again, the channel is removed from the chart. This is intended to show that the current market movements are weak and the channel shows a possible direction of a sideways movement in the market.
In addition to the threshold, the scaling of the ATR value
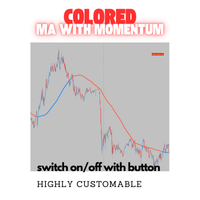
The indicator generates buy and sell signals based on a combination of a modified moving average with a trend momentum algorithm.
To ensure clarity on the chart, this indicator can be switched on and off using a freely positionable button.
Note: If you use this indicator multiple times, e.g. to display different MA periods, then you must change the "button label (ID)" in addition to the period to ensure it works. The label when pressed should also be changed accordingly for a clear overview.
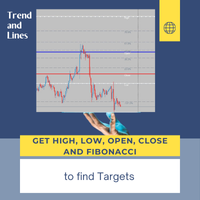
This indicator draws lines at the open, close, high and low price of the last chart candle from the set timeframe.
In addition, a label shows whether it was an up or down candle.
The standard settings follow the original idea of getting the price data from the daily timeframe for day trading/scalping, but
since this indicator is fully customizable, you can also set a different timeframe.
Based on the drawn price lines, you can then also display Fibonacci levels.
This function can also be
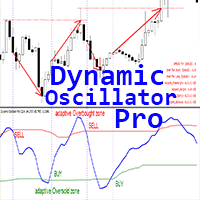
Dynamic Oscillator Pro - est un indicateur Crypto_Forex personnalisé avancé - un outil de trading efficace pour MT4 !
- Nouvelle génération d'oscillateurs - voir les images pour voir comment l'utiliser. - Dynamic Oscillator a des zones de survente/surachat adaptatives. - Oscillator est un outil auxiliaire pour trouver des points d'entrée exacts à partir des zones de survente/surachat. - Valeurs de survente : en dessous de la ligne verte, valeurs de surachat : au-dessus de la ligne rouge. - Il
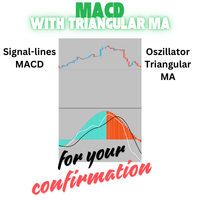
This indicator uses the signal lines of the MACD and uses Triangular MA as Oscillator. It is a good addition to trading decisions and part of the OH strategy.
Optimal trade confirmation occurs when the signal lines of the MACD coincide with the trend color of the Triangular Oscillator.
Of course everything important can be changed.
This indicator is part of the OH-Strategy, you can view other indicators of this strategy if you click on my name as a seller.

Spread & Candle Close Timer Indicator for MT4 Optimize your trading with this lightweight and efficient indicator, designed to display the real-time spread and candle close countdown directly on your MT4 chart. Features: Live Spread Monitoring – Instantly see market conditions. Candle Close Timer – Stay prepared for the next price movement. Simple & Non-Intrusive Design – No unnecessary settings, just clear and accurate data. Ideal for scalpers, day traders, and those who need real-time exec

Principle of Operation 1. Data Retrieval:
The indicator gathers real-time data on the trading instrument, including: Minimum and maximum lot sizes Tick value Spread Number of digits Account data (balance, currency) 2. Connection Check:
If there is no connection to the broker, a message is displayed on the chart, and no further calculations are performed. 3. Optimal Lot Size Calculation: Risk Determination: The indicator considers the specified risk value (e.g., 2% of the account balance) and

Levels price is a mt4 indicator that shows various levels to enter the market based on indicator calculations. The indicator consists of the following buffers; Red buffer Blue buffer Purple buffer The blue buffer is the resistance level where price is expected to bounce back. The red buffer is the support level based on the current market price. There is also a purple buffer below red buffer that can indicate the current support and resistance levels have been breached when price crosses this p

Mt support and resistance is an indicator that shows various levels to buy or sell based on prevailing market conditions. The main basis of the indicator is support levels and resistance levels. It consists of; Red buffer Blue buffer Purple buffer The blue buffer is resistance level where price is supposed to return back. The red buffer is the support level where price should bounce back.
Le MetaTrader Market est un magasin unique de robots de trading et d'indicateurs techniques.
Lisez le mémo de l'utilisateur de MQL5.community pour en savoir plus sur les services uniques que nous offrons aux traders : copie des signaux de trading, applications personnalisées développées par des freelancers, paiements automatiques via le système de paiement et le MQL5 Cloud Network.
Vous manquez des opportunités de trading :
- Applications de trading gratuites
- Plus de 8 000 signaux à copier
- Actualités économiques pour explorer les marchés financiers
Inscription
Se connecter
Si vous n'avez pas de compte, veuillez vous inscrire
Autorisez l'utilisation de cookies pour vous connecter au site Web MQL5.com.
Veuillez activer les paramètres nécessaires dans votre navigateur, sinon vous ne pourrez pas vous connecter.