YouTube'dan Mağaza ile ilgili eğitici videoları izleyin
Bir alım-satım robotu veya gösterge nasıl satın alınır?
Uzman Danışmanınızı
sanal sunucuda çalıştırın
sanal sunucuda çalıştırın
Satın almadan önce göstergeyi/alım-satım robotunu test edin
Mağazada kazanç sağlamak ister misiniz?
Satış için bir ürün nasıl sunulur?
MetaTrader 4 için teknik göstergeler - 134

RaysFX Auto Fibo
RaysFX Auto Fibo v2.1 è un indicatore di trading essenziale per tutti i trader che utilizzano la piattaforma MetaTrader 4. Questo strumento automaticamente disegna i ritracciamenti di Fibonacci sul tuo grafico, risparmiando tempo e fatica. Caratteristiche principali: Disegno automatico : Non dovrai più tracciare manualmente i livelli di Fibonacci. L’indicatore lo fa per te, risparmiandoti tempo e garantendo precisione. Personalizzabile : Puoi personalizzare il colore, lo stile

indicator named "MTRADER" designed to be used with the MetaTrader 4 trading platform. It appears to be a technical analysis tool for forex or stock market trading. Here's a breakdown of its key components and functionalities: Indicator Properties and Inputs : The code begins by setting up basic properties of the indicator, such as its name, version, and drawing styles. It defines two indicator buffers with blue and red colors, likely used for graphical representation on charts. Input parameters

RaysFX Auto TrendLine Linee di tendenza automatiche : L’indicatore disegna automaticamente le linee di tendenza sul tuo grafico, risparmiandoti tempo e fatica. Personalizzabile : Periodo (nPeriod) : Questo parametro determina il numero di barre che l’indicatore considera per il calcolo delle linee di tendenza. Ad esempio, se imposti nPeriod a 10, l’indicatore considererà le ultime 10 barre per disegnare le linee di tendenza. Un periodo più lungo renderà l’indicatore meno sensibile

RaysFX Reversal Bar RaysFX Reversal Bar è un potente strumento di trading progettato per la piattaforma MetaTrader 4. Questo indicatore è stato sviluppato per individuare le inversioni di mercato basate su un modello di candela specifico.
Caratteristiche principali: Rilevamento di inversioni : L’indicatore cerca specifici modelli di inversione di 2 barre nel mercato. Questi modelli includono una barra rialzista seguita da due barre ribassiste per un segnale di acquisto, e una barra ribassista

RaysFX 3 Stoch!
Sei un trader alla ricerca di un vantaggio competitivo? L’indicatore RaysFX 3 Stoch è l’aggiunta perfetta al tuo arsenale di trading. Caratteristiche principali: Stocastico a 3 livelli : L’indicatore RaysFX 3 Stoch utilizza tre livelli di stocastico per fornire segnali di trading accurati e tempestivi. Personalizzabile : Puoi personalizzare i periodi di K, D e Slowing, così come i periodi dei tre stocastici, per adattarsi al tuo stile di trading. Allerta integrata : L’ind

forex indicator GRAY ZONE for gold xauusd use with price action and Breakout time frame 15 and 30 m platform mt4 use with price action and break good tp 20 use sl warning only for one account mt4 Trading risks must be taken into account New traders are always excited to jump into action. When you’re putting your hard earned money on the line, it’s important to make sure you’re equipped with a strong foundation. Learn the ins and outs of the market and test yourself with paper trading before

RaysFX Supertrend Bar RaysFX Supertrend Bar è un indicatore personalizzato per MetaTrader 4. Utilizza l'indice di canale delle materie prime (CCI) per generare segnali di trading. L'indicatore mostra dei puntini in una finestra separata sotto il grafico principale per indicare i segnali di trading. Caratteristiche principali: Calcola il CCI per diversi periodi temporali. Visualizza puntini per indicare i segnali di trading. Permette all'utente di modificare i periodi temporali e la distanza tra
Bir sonraki geri dönüş hareketinin sinyalini alın | Kazanç oranı istatistiklerini optimize edin | Fiyatın test edeceği Bölgeleri alın Gecikmesiz, takip edilmeyen gösterge - manuel ve otomatik ticaret için ideal - tüm varlıklar ve tüm zaman birimleri için uygun Sınırlı süreli teklif >> %50 İNDİRİM Satın aldıktan sonra, kişiselleştirilmiş ayarlar için bu kanaldan benimle iletişime geçin . МТ4 - МТ5 sürümü | Kârları daha kolay, hızlı ve güvenli bir şekilde maksimize etmek için gl

RaysFX Candlestick Exit
Il RaysFX Candlestick Exit è un indicatore di trading avanzato progettato per i trader che desiderano avere un controllo preciso sulle loro uscite di trading. Questo indicatore utilizza una combinazione di tecniche di trading per fornire segnali di uscita accurati e tempestivi. Caratteristiche principali: Range : Questo parametro consente di impostare il range di candele considerate per il calcolo dell’indicatore. Shift : Questo parametro consente di spostare l’indicator
Stratejik Bölge x3, x4, x5 kez dokunuldu | TP1/TP2/TP3 puan veya değer olarak | Risk/ödül oranınızın güvenliğini görsel olarak kontrol edin Gecikmesiz ve yeniden çizim yapmayan gösterge - Hem manuel hem de robot ticareti için idealdir - Tüm varlıklar ve zaman dilimleri için uygundur
Sınırlı süreli teklif - sonra tekrar $99 | Satın aldıktan sonra, lütfen kanalıma ulaşın önerilen ayarları almak için [ MT5 - MT4 versiyon | Karınızı en üst düzeye çıkarmak için MetaMethod adımlarımızı inc

Subscribe to the 'MA7 Trading' channel to receive notifications about new programs, updates and other information. Ask questions in the profile on the MQL5 .
Description of work
The 'MA7 Ixora' indicator is based on the standard Moving Average (MA) indicator. Shows the intersection of the fast and slow moving averages. Detailed information about the 'MA7 Ixora' indicator.
Indicator settings
General settings: Consider the direction of the candle .
Fast moving average settings: Period – MA per

RaysFX Intraday Fibo RaysFX Intraday Fibo è un indicatore di trading Forex di alta qualità, progettato con precisione e attenzione ai dettagli. Questo indicatore è il risultato di anni di esperienza nel trading Forex e nella programmazione MQL4, ed è stato creato con l’obiettivo di fornire ai trader un vantaggio competitivo nel mercato. Caratteristiche principali: Precisione : L’indicatore RaysFX Intraday Fibo utilizza un algoritmo avanzato per identificare i punti di ingresso e di uscita ottima

RaysFX MACD Divergence
Presentiamo RaysFX MACD Divergence, un indicatore di trading avanzato progettato per i trader moderni. Questo indicatore utilizza la divergenza MACD, uno dei metodi più affidabili nel mondo del trading, per fornirti segnali di trading precisi e tempestivi. Caratteristiche principali: Divergenza MACD: L’indicatore identifica e traccia le divergenze MACD, fornendo segnali di trading potenzialmente redditizi. Personalizzabile: Puoi personalizzare i parametri dell’EMA veloce,

Master Trend is a complete trading system for day traders, scalp traders and swing traders. The system consists of two indicators. A simple, clear set of rules ideal for both beginners and experienced traders. The Master Trend Strategy helps you to always be on the right side. It helps filter out the strongest trends and prevents you from trading in a directionless market. If the market is too weak or is in sideways phases, then the Magic Band shows different color It works well on all instrume

RaysFX WPR Strategy Indicator RaysFX WPR Strategy è un indicatore di strategia di trading basato sul calcolo del WPR (Williams Percent Range). Questo indicatore utilizza tre lunghezze diverse per il calcolo del WPR e pesa i risultati per fornire un valore complessivo del WPR.
Caratteristiche: - Calcola il WPR utilizzando tre lunghezze diverse (9, 33, 77) - Utilizza un sistema di pesi per combinare i tre valori del WPR in un unico valore - Genera alert in base al numero di alert impostato dall'
This indicator accurately identifies and informs market reversals and continuation patterns by analyzing and signaling the Three White Soldiers / Three Black Crows pattern. It also offers a "real-time backtesting" panel in the indicator itself in a way that every change made on the indicator parameters will immediately show the user how many signals are occurred, how many take profits and stop losses were hit and, by having these informations, the Win Rate and the Profit Factor of the setup ba
Merhaba tüccarlar.
En iyi ticaret aracımla tanışın.
MTF PPAAF Modeli T.
Çoklu Zaman Çerçevesi Hassas fiyat eylem oku filtreli Model T.
Bu ticaret aracı, yıllar boyunca çeşitli ticaret araçları yaptıktan sonra yaptığım en iyi çalışmadır.
Bu ticaret aracı neden en iyi ve güvenilirdir?
1. Bu araç 6 gösterge kullanır:
Çift CCI = hızlı CCI x yavaş CCI İkili Stokastik = hızlı Stokastik (hızlı Stokastik ana hat x hızlı Stokastik sinyal hattı) ve yavaş Stokastik (yavaş Stokastik ana hat

giriiş Mighty Timsah - mali piyasaların ve bireysel menkul kıymetlerin zamanın sadece %15 ila %30'unda trend gösterdiği, diğer %70 ila %85'inde ise yanlara doğru ilerlediği varsayımını takip eden trendi takip eden bir gösterge. Mighty Alligator göstergesi, tümü Fibonacci sayıları olan beş, sekiz ve 13 periyoda ayarlanmış üç düzgünleştirilmiş hareketli ortalama kullanır. Başlangıçtaki düzeltilmiş ortalama, basit bir hareketli ortalama (SMA) ile hesaplanır ve gösterge dönüşlerini yavaşlatan ek dü
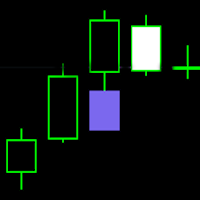
FVG - Fair Value Gap indicator is a three candle pattern indicator . It find inefficiencies or imbalances in market. It act as magnet before continue the trend.
indicator key function
1. No object is used to draw the plot. You can use this to build EA and backtest also.
2. Min and max value to Filter-out the noises .
It use as retest zone and can be use as entry price also. It popular among price action traders. your suggestion and comments are welcome and hopping that you will find this hel

HorizonFX'i tanıtıyoruz, Forex yatırımcılarının rekabet avantajı arayışında kesinlikle tasarlanmış yenilikçi bir piyasa osilatörü. Özgün bir formülden geliştirilen HorizonFX, geleneksel metriklerin ötesine geçerek, piyasa hareketlerini daha doğru bir şekilde belirlemeye yardımcı olan kesin alım ve satım sinyalleri sağlar. HorizonFX'in Özellikleri: Benzersiz Hesaplama: Piyasa değişkenleri ve ileri matematiğin eşsiz bir kombinasyonunu kullanarak dalgalanan çizgilerini üretir, bu da piyasa volatili

Subscribe to the 'MA7 Trading' channel to receive notifications about new programs, updates and other information. Ask questions in the profile on the MQL5 .
Description of work
The 'MA7 Hypnum' indicator is based on the standard Commodity Channel Index (CCI) indicator. Shows overbought and oversold zones. Detailed information about the 'MA7 Hypnum' indicator.
Indicator settings
General settings: Period – period of the CCI indicator; Apply to – price type for calculating the CCI indicator; Up

The Positive Trend indicator is very reliable because it is based on moving averages. A feature of Trend Positive is the presence of a signal for entry/exit - the indicator line in a certain color indicates the signals "buy" or "sell". The accuracy of this signal is very high, matching 95% success to 5% failure. Trend Positive is also suitable for exiting a position. The indicator captures the trend almost completely, but during the flat it is necessary to use filters. When entering a positi

Canlı bir organizmanın görünür davranış kalıplarının trend analizine dahil edilmesi için yapay zeka, AI kullanılarak oluşturuldu. Kaos Teorisi, Hareketli Ortalama ile buluşuyor. Deniz Anemonu'nu besleyen filtre, kendini zenginleştirmek için dallarını bir besin denizine uzatır. Aşırı uzun açıklamalarla zamanınızı boşa harcamayacağım, kavram bu terimlerle anlaşılabilir. Sizin tarafınızdan belirtilen bir zaman girişinde Basit, Üstel, Ağırlıklı ve Yumuşatılmış arasında geçiş yapan özelleştirilebilir

Volume indicator Effect Volume , in the Forex market volumes are unique (tick). This volume indicator demonstrates the level of financial and emotional involvement. When the indicator forms a new top, it indicates that buyers are stronger than sellers over a certain period of time. If the indicator decreases, this indicates that the bears are stronger.
Why is it impossible to track normal volumes in Forex? The fact is that this is an over-the-counter market. Consequently, it is practically imp
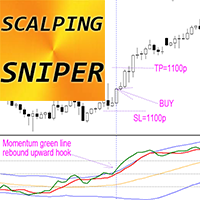
Crypto_Forex Göstergesi SCALPING SNIPER MT4 için, Yeniden Boyanmayan Ticaret Sistemi. Scalping Sniper - doğru fiyat momentumunu gösteren gelişmiş bir sistemdir (gösterge)!
- MT4 için profesyonel Scalping Sniper Göstergesi ile ticaret yöntemlerinizi yükseltin. - Bu sistem, %90'a varan kazanma oranıyla çok doğru ancak nadir keskin nişancı sinyalleri sağlar. - Sistem, bir çift başına düşük sinyal sayısını telafi etmek için sinyalleri aramak için birçok çift kullanır. - Scalping Sniper şunlardan o

--- INTRODUCTION ---- This indicator is to measure the strength of BULL and BEAR. The formulars are based on Price Change and Volume for period of time.
---- HOW TO READ ---- GREEN BAR = BULL is stronger than BEAR ----> Strong GREEN = Strong Buying Volume ----> Light GREEN = Weakening Buying Volume (BULL Still in control)
RED BAR = BEAR is stronger than BULL ----> Strong RED = Strong Selling Volume ----> Light RED = Weakening Selling Volume (BEAR Still in control)

Данный индикатор представляет из себя комплекс из 4 индикаторов в правом углу состоящий из RSI,Stochastic,Envelope и MACD, показывающий данные на различных таймфреймах, настройки данных индикаторов вы можете изменить в параметрах, сигналы на вход основан на индикаторах силы быков и медведей, данные сигналы используются и в роботах, скрины прилагаю, желающим, скину бесплатно
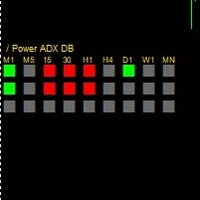
This is a trend indicator based on ADX and some other oscillators, the indicator change colors on strong trend directions, this indicator is most suitable for scalping purposes, if the lower timeframe shows opposite direction to the higher timeframe direction , the move may act as a retracement. And the lower squares of the indicator uses a higher ADX period, upon their change on color move may be exhausted.
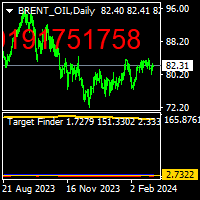
THISE INDICATOR NOT WORK ON FREE DEMO. there is a protocol to work it. target finder indicator is a forecast the find probably targets.up and down. to use thise indicator, there is a protocol,i explain below. first load indicator you will see blue and red lines. on the left side look to the higher value of line ,and draw horizantal line on top it. and on the right side see the LEVEL NUMBER.
Finding UP TARGET h=put that level number m=1 b=1 pres ok. you will see on the screen ,on top right ,re

Graphic Shapes -using history, it projects four types of graphical shapes at the moment, allowing you to determine the main ranges of price movement in the future, as well as gives an understanding of the main market reversals, while giving entry points by priority!The panel contains three types of figure sizes expressed by timeframes. They allow you to conduct a complete market analysis without using additional tools! The indicator is a powerful tool for forecasting price movements in the forex
"Scalper M5 sistemi" forex piyasasında ölçeklendirme stratejileri için tasarlanmış güçlü bir araçtır. %95'e varan doğruluk oranıyla bu gösterge, yeniden boyamaya gerek kalmadan işlem açmak için güvenilir sinyaller sağlar. Kısa vadeli ticaret fırsatlarını belirlemek için basit ama etkili bir yaklaşım kullanır ve bu da onu her seviyedeki yatırımcılar için uygun kılar. Göstergenin algoritması, yanlış sinyalleri filtrelemek ve yüksek olasılıklı ticaret kurulumları sağlamak için fiyat momentumu, oyn

TrendCompass is a powerful indicator for trading in the currency and cryptocurrency markets on the MetaTrader 4 platform. This innovative tool is designed to simplify analysis and decision-making in trading. The indicator combines various technical indicators and algorithms to provide accurate and timely trading signals. Key Features:
Multilevel Strategy: TrendCompass is based on a comprehensive strategy that includes analyzing major trends, support and resistance levels, and various technical

Volume Horizon is a horizontal volume indicator that allows you to observe the density of market participants' volumes across various price and time intervals. Volume histograms can be constructed based on ascending or descending market waves, as well as individual bars. This tool enables more precise determination of entry or exit points, relying on levels of maximum volumes or volume-weighted average prices (VWAP).
What makes Volume Horizon unique? 1. Segmentation into ascending and descendi
The Xeon indicator was created to display the trend in a visual form. One of the main definitions for monitoring the currency market is trend. A trend is a stable direction of price movement. To find it, the indicator uses calculations designed to smooth out sharp fluctuations that do not affect the overall picture of price movement.
The indicator was created for those who value their time and money.
A trend can be increasing (bullish trend) or decreasing (bearish trend). In most cases, a tre

The Trend Prior indicator ignores sharp fluctuations and market noise and tracks market trends. Suitable for trading on small and large time frames, it ignores sudden price jumps or corrections in price movements by reducing market noise around the average price value. The indicator works on all timeframes and currency pairs. The indicator gives fairly accurate signals and is commonly used in both trend and flat markets. It is advisable to use the indicator in conjunction with other tools for m

Turbo Trend technical analysis indicator, which determines the direction and strength of the trend, and also signals a trend change. The indicator shows potential market reversal points. The indicator's intelligent algorithm accurately determines the trend. Uses only one parameter for settings. The indicator is built for simple and effective visual trend detection with an additional smoothing filter. The indicator does not redraw and does not lag. Take profit is 9-10 times larger than stop loss
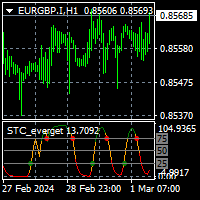
To get access to MT5 version please click here . This is the exact conversion from TradingView: "Schaff Trend Cycle" by "everget". This is a light-load processing indicator. This is a non-repaint indicator. Buffers are available for processing in EAs. All input fields are available except fillings(due to MT4 graphical restrictions). You can message in private chat for further changes you need. Thanks for downloading
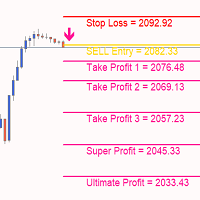
Altın Hedefler en iyi trend göstergesidir. Göstergenin benzersiz algoritması, teknik ve matematiksel analiz faktörlerini dikkate alarak varlık fiyatının hareketini analiz eder, en karlı giriş noktalarını belirler, ok şeklinde bir sinyal ve fiyat seviyesini (SATIN ALMA Girişi / SAT Girişi) verir. bir sipariş açın. Gösterge aynı zamanda Zararı Durdur için fiyat seviyesini ve Kâr Al için beş fiyat seviyesini anında görüntüler.
DİKKAT: Göstergenin kullanımı çok kolaydır. Göstergeyi tek tıklamayla

RiKen: Kanıtlanmış Hassasiyet ve Güvenilirlikle Teknik Analizi Devrimleştirme RiKen'i keşfedin, ticaret deneyiminizi dönüştürmek için tasarlanmış yenilikçi bir teknik analiz aracı. Bu gösterge, benzersiz özellikleri sayesinde finansal piyasayı yeniden tanımlayarak teknik analizin standartlarını yükseltir: %70 Etkileyici Doğruluk : RiKen, %70 gibi dikkat çekici bir doğruluk oranıyla alım ve satım sinyalleri sağlayarak öne çıkar. Bu doğruluk, yatırım kararlarını optimize etmek isteyen yatırımcılar
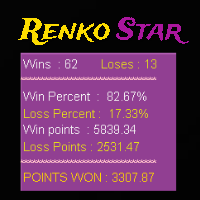
Renko Star, renko grafikleriyle işlem yapmak için tasarlanmış mt4 ok tipi bir göstergedir, bu gösterge, tüccara kazanma oranı ve kazanılan puanlar gibi yararlı bilgileri söyleyen bir geriye dönük test panosuna sahiptir, ayrıca atr x çarpımında tp ve sl'yi verir, bu gösterge onun değerini verir. Bar açık veya bar içi sinyal üzerinde sinyalin verildiği yerde tam fiyatı işaret edecek sarı bir işaret bulunur, bu göstergeyi kullanmanın yolu göstergenin verdiği oka göre alış veya satış açmak ve tp'yi
This indicator is based on the work of legendary trader William Gann, specifically using mathematical models and data from past days. It calculates potential time for a reversal based on selected parameters for the current day. The time is displayed in the future, at the opening of the day and does not change thereafter. The indicator also includes alerts when potential reversal time approaches. An algorithm for possible price movement is built into the indicator. When the time comes, an alert i

The indicator is designed to work on any trading platform. The program is based on proprietary algorithms and W.D.Ganna's mathematics, allowing you to calculate target levels of price movement based on three points with the highest degree of certainty. It is a great tool for stock trading. The indicator has three buttons: NEW - call up a triangle for calculation. DEL - delete the selected triangle. DELS - completely remove all constructions. The probability of achieving the goals is more than 80

FOTSI (Forex Overview True Strength Index) for MT4 FOTSI is an indicator that analyzes the relative strength of currencies in major Forex pairs. It aims to anticipate corrections in currency pairs following strong trends by identifying potential entry signals through overbought and oversold target areas. Theoretical Logic of Construction: Calculation of Individual Currency Momentum: FOTSI starts by calculating the momentum for each currency pair that includes a specific currency, then aggregates

FREE FOR A LIMITED TIME ONLY!!! The Ultimate Indicator For Trading Trend This indicator clearly shows you the strength of the market in one direction or the other, which means that you can trade knowing you are either with or against the market. When used in conjunction with the +3R principles you are sure to have some serious results. The +3R Principles Routine - This is when you trade and how often Rules - This is the rule you follow Risk:Reward - This is the percentage amount of your accoun

The " Unforgettable Trend " indicator is a hybrid trend indicator that combines signals from elementary indicators with a special analysis algorithm. Its main task is to show the moments most favorable for entering the market, based on the current trend.
Main characteristics:
Algorithm and noise filtering: The indicator works as the main tool for determining the current trend in the market. Built-in intelligent algorithm allows you to filter out market noise and generate accurate input signal
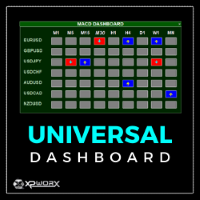
The UNIVERSAL DASHBOARD indicator will eliminate the need of using dozens of indicators on dozens of charts. From one place you can monitor all the pairs and all the timeframes for each of the following indicators: MACD STOCHASTIC WPR RSI CCI You can also use any Custom indicator in the dashboard as long as it has a readable buffer. With a single click you can quickly navigate between charts, pairs and timeframes. Alerts will provide clear indication about what happens for your favorite pairs on

The trading indicator we've developed analyzes real-time price action to identify bullish or bearish trends in the financial market. Using advanced algorithms, the indicator automatically plots an upward line when it detects a bullish trend and a downward line in the case of a bearish trend. These lines provide traders with a quick and clear view of the potential direction of market movement, helping them make informed decisions in their trades. Each time a new candle forms on the chart, the ind

The Indicator show Daily Pivot Points. It is possible to specify the number of days to display. For forex it doesn't consider the sunday session data. It is possibile to modify the color, style and width for every level.It is better to use this indicator with timeframe not higher than Н1. 4 Levels of support and resistance with also Intermediate Levels that is possible to hide.
Pivot trading:
1.pp pivot
2. r1 r2 r3, s1 s2 s3
Pivot points have been a trading strategy for a long time, orig

Subscribe to the 'MA7 Trading' channel to receive notifications about new programs, updates and other information. Ask questions in the profile on the MQL5 .
Description of work
The 'MA7 Aster' indicator is based on the standard Moving Average (MA) indicator. Shows the price deviation from the moving average. Detailed information about the 'MA7 Aster' indicator.
Indicator settings
General settings: Period – MA period; Method – MA method; Apply to – price type; Minimum distance – minimum dista

Crypto_Forex Göstergesi PINBAR Deseni MT4 için.
- "PINBAR Deseni" Göstergesi Fiyat Hareketi ticareti için çok güçlü bir göstergedir: Yeniden boyama yok, gecikme yok; - Gösterge grafikte PinBar'ları algılar: - Boğa PinBar - Grafikte mavi ok sinyali (resimlere bakın). - Ayı PinBar - Grafikte kırmızı ok sinyali (resimlere bakın). - PC, Mobil ve E-posta uyarılarıyla. - "PINBAR Deseni" Göstergesi Destek/Direnç Seviyeleriyle birleştirmek için mükemmeldir.
// Harika Ticaret Robotları ve Göstergeleri
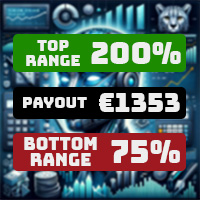
Prop Firm ile Uyum Kuralı kullanan kişiler için Nihai Tutarsızlık Aralığı Göstergesi Tanıtımı: Prop Firm Tutarsızlık Kurallarını Yönetmek için Olmazsa Olmaz Bir Araç! Uyum kuralı uygulayan bir prop firm kullanıyor musunuz? Keskin kenar ödeme hesaplayıcımız, MetaTrader 4 için olmazsa olmazdır. Bu güçlü araç, disiplini sürdürmenin, strateji uyumunu sağlamanın ve kesintilerin riski olmadan kar potansiyelinizi en üst düzeye çıkarmanın anahtarıdır. Ana Özellikler Ödeme Karı: gerçekçi ödemeniz Maksim

Satın aldıktan sonra lütfen bir yorum bırakın, size BONUS ticaret asistanı EA'yı göndereceğim.
Çoklu Döviz ve çoklu zaman dilimi ticaret uyarıları.
YENİDEN BOYAMA! Otomatik takip durdurma ve risk ödül kar alma. Gösterge piyasayı tarar ve analiz eder, böylece yapmanız gereken hiçbir şey olmaz. Tüm döviz çiftlerinizi 1 grafikte işlem yapın!
Gösterge esas olarak XAUUSD için tasarlanmıştır ancak herhangi bir çiftte çalışır!
Altın için 1 dakikalık zaman diliminden diğer çiftler için 5 dakikalık

Barry Hood's leading trend indicator is designed to more accurately determine the direction of the trend in financial markets. Here are the main characteristics and operating principles of this indicator:
Adaptive Four-Level Smoothing: The indicator uses a mechanism that allows it to effectively adapt to changing market conditions. This allows you to more accurately determine the current trend.
Characteristics and features: Redraws only on the zero candle: This means that the indicator is red

The Angle Prices indicator is a tool that calculates the price angle based on price analysis, interpreting the time vector in the form of price points on the price chart. In other words, the X axis and Y axis are represented as price points, so you can actually calculate the angle with two axes of the same dimension. This allows traders to obtain information about the direction of price movement and possible entry or exit points for trades. Let's look at the main characteristics and interpr

RaysFX DrawProfit RaysFX DrawProfit è un indicatore MQL4 progettato per i trader che desiderano visualizzare in modo efficiente sul grafico tutti i risultati delle posizioni chiuse: profitto o perdita. Se imposti DrawProfit sul tuo grafico gestito da un Expert Advisor (EA), potrai vedere chiaramente le sue prestazioni attraverso i suoi profitti e perdite. Caratteristiche principali Visualizzazione del profitto : Mostra il profitto in valuta, pips o entrambi. Filtro magico : Filtra gli ordini in
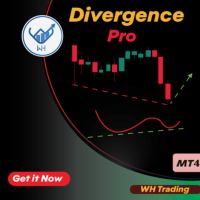
Ticaretinizi bir sonraki seviyeye taşımaya hazır mısınız? Tanıtımı ne zaman Diverjans Pro MT4 ,
çeşitli popüler teknik göstergeler arasından seçim yapmanızı sağlayan gelişmiş bir sapma göstergesi.
Artık sapma sinyallerinizi benzersiz ticaret stratejinize uyacak şekilde uyarlayabilirsiniz. Süreçler boyunca size rehberlik etmek için satın aldıktan sonra benimle iletişime geçin Ana Özellikler :
Gösterge Seçimi : Aşağıdaki seçenekler arasından tercih ettiğiniz göstergeyi seçin: R

1. Going offline means that the market is in a wait-and-see state. In this situation, it is common to choose to wait and see rather than taking immediate action to wait for more market information or trend confirmation in order to make wiser decisions. 2.When there is a trend of going up and down, the market shows a bullish signal. At this point, investors may consider entering the market in hopes of future price increases and profits. 3.When the market situation is online, it will once again t

Indicator for determining the trend. The arrows and lines on the chart show the price reversal and the probable current trend or correction. You should always trade in the direction of the arrow. It is best to use the indicator on several time frames at once and enter the market when all time frames have the same arrow. For example, we open a sell trade if there is a red arrow on the M5, M30 and H4 timeframes. Or we open a buy deal if the indicator shows a blue arrow on all timeframes.
Advanta

Super Entry, ATR değerine dayalı olan ve değiştirilebilen ve ayarlanabilen yan tp ve sl seviyelerini tek başına uzun ve kısa sinyaller veren, hepsi bir arada ok tipi bir göstergedir; bu gösterge, kazanma oranını ve diğer istatistikleri gösteren bir geriye dönük test paneli sağlar. ne kadar doğruluk bekleneceğine dair net bir görüş sağlar.
bu gösterge yeniden boyamaz veya arka boyama yapmaz ve sinyal gecikme olmadan çubuk açıkken gelir.
Parametreler:
ayarlar: gösterge tp ve sl değerleri ve ge

The well-known ZigZag indicator that draws rays based on the “significant movement” specified by the pips parameter. If a ray appears, it will not disappear (the indicator is not redrawn), only its extremum will be updated until the opposite ray appears. You also can display text labels on each rays describing the width of the ray in bars and the length of the ray in points.

Divergence Divergence refers to when the price of a currency pair moves in one direction while the trend indicator is moving in the opposite direction. With divergence, there can be positive and negative signals. Divergences in Forex trading are quite common signals of technical analysis. These are basic early Forex signals indicating the trend reversal and filter false signals. Application of this indicator It is usually not easy to detect divergences by the trader and it may be time-consuming

Review your trades is important key to succeeed in trading, with my tool it will be very easy to review all your trades. Just load my tool and load the account history.
It will show where and when entered and exited.
And one of the key ways to continually improve and iterate on our trading is to review our past trades and trading performance as a whole. Because you won’t notice the mistakes in the moment. And you can’t take a big picture view when you’re focusing on the micro aspects of each

1分足から使える高精度のスキャルピング用逆張りサインツールです。
・すべての通貨ペア、時間足で利用でき、絶好のタイミングでのエントリー・チャンスをお知らせします ・ ボリンジャーバンドにタッチしてからの反転を 基本戦略とし、 独自のアルゴリズムを加えることで、精度の高い反転ポイントでサインを発信します ・勝敗判定機能により 直近の相場環境に対するこのインディケータの有用性を確認することができます ・ 初心者から上級者まで設定不要ですぐにお使いいただけます ・本サインツールの性能を確認いただくための専用EAを提供いたします。コメント欄をご覧ください
1分足での使用にも耐えるので、トレード頻度を高めることができます。またより高い時間足での使用では精度の向上が期待できます。トレンド・フィルターの機能を利用することで、トレンド方向での押し目買い、戻り売りに際し最適なタイミングでトレードすることができます。
設定項目は以下の通りです。 Bollinger Bands Period
Bollinger Bands Deviation
Bollinger Bands Shift
Tren

The indicator analyzes the chart as a mathematical function with X-time and Y-price axes. Time is presented in bars, price in pips. The purpose of the analysis is to give the user a signal to action at the moment when the function forms a recoilless movement in one direction over a certain period of time. The indicator parameters must be selected for each currency pair, since the price function is formed differently for each currency pair.
Shows favorable moments for entering the market with a

Extreme Value Sniper is a detrended price indicator Indicator finds the potential reversal levels by checking value ranges and price cycles. ***Indicator does NOT repaint so it provides accurate NO REPAINT REVERSAL SIGNALS***
MT5 Version of the product : https://www.mql5.com/en/market/product/114550
It shows the overbought and oversold levels using the average range. Overbought Levels are between 4 and 10 Oversold levels are bewtween -4 and -10
Those levels can be used as a reversal level
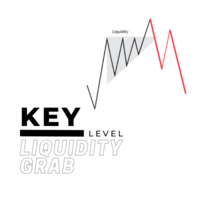
For a bullish move to occur for example, there should be alot of buying power. but you cannot buy if there is no sell on the other side, so the big players usually tend to manipulate the market in order to create available positions on the other side and be able to open their positions and one of the ways is by creating a fake breakout/ a liquidity grab. Before majority of big reversal moves and trends are formed, a liquidty grab would have occured in order to have enough orders to push for the

This indicator is, without a doubt, the best variation of the Gann Angles among others. It allows traders using Gann methods to automatically calculate the Gann angles for the traded instrument. The scale is automatically calculated when the indicator is attached to the chart. When switching timeframes, the indicator recalculates the scale for the current timeframe. Additionally, you can enter your own scales for the Gann angles. You can enter your own scales either for both vectors or for each
Space signals sinyal göstergesi, Forex ve İkili opsiyon piyasalarında işlem yapmak için yeni gelişmemdir. Göstergenin algoritması, trendi takip etmesi ve fiyatın düzeltici hareketinin sonu için sinyaller vermesi için yazılmıştır.
Ayarlarda, sinyallerin periyodunu kendiniz ayarlayabilirsiniz. "Dönem" değişkenindeki değer ne kadar fazlaysa, sinyaller o kadar az olur. Ancak doğal olarak daha kaliteli olacaklar.
Grafikteki okların kodlarını, çubuklardan olan mesafeyi, renklerini ve kalınlıkların
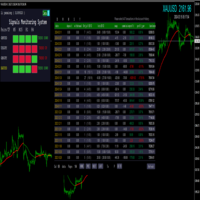
MT4 multi-variety multi-period signal monitoring system
Load to the indicators folder
Recommended loading chart: GBPUSD/XAUUSD/GBPJPY/USDJPY
Recommended loading period: M5/M15/H1/H4
Select all history by account history
- Statistics: Date, deposit, withdrawal, total number of transactions, number of transactions - long, number of transactions - short, total number of transactions, number of transactions - long, number of transactions - short, interest, commission, profit and loss, profit a

Smooth Heikin Ashi provides a more smoothed signal of bull or bearish trends than regular Japanese candlesticks, or even the standard Heikin Ashi candles. Heikin Ashi as an alternative candlestick pattern that has been in use since its invention in Japan back in the 1700s. On normal Japanese candlesticks, there is a lot noise with mixed bearish and bullish candles side by side, even during trends. Heikin Ashi reduces this noise leaving an easier visual representation of trends. This indicator is
MetaTrader mağazası, alım-satım robotları ve teknik göstergelerin benzersiz bir deposudur.
Yatırımcılara sunduğumuz benzersiz hizmetler hakkında daha fazla bilgi edinmek için MQL5.community - Kullanıcı notunu okuyun: alım-satım sinyallerini kopyalama, freelancerlar tarafından geliştirilen özel uygulamalar, ödeme sistemi aracılığıyla otomatik ödemeler ve MQL5 Bulut Ağı.
Alım-satım fırsatlarını kaçırıyorsunuz:
- Ücretsiz alım-satım uygulamaları
- İşlem kopyalama için 8.000'den fazla sinyal
- Finansal piyasaları keşfetmek için ekonomik haberler
Kayıt
Giriş yap
Gizlilik ve Veri Koruma Politikasını ve MQL5.com Kullanım Şartlarını kabul edersiniz
Hesabınız yoksa, lütfen kaydolun
MQL5.com web sitesine giriş yapmak için çerezlerin kullanımına izin vermelisiniz.
Lütfen tarayıcınızda gerekli ayarı etkinleştirin, aksi takdirde giriş yapamazsınız.