Indicadores técnicos de pago para MetaTrader 4 - 106
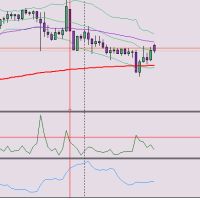
Indicadores Rango de Velas (Candle Range) y Rango Verdadero Promedio (ATR): Compara el tamaño del rango de la vela con el ATR. Ayuda a analizar el movimiento de los precios e identificar oportunidades de trading. ¿Desea saber más? Deje un comentario para compartir su experiencia. ** Sugerencias para mejorar la traducción: Proporcionar ejemplos específicos del uso del indicador. Explicar las ventajas y desventajas del indicador. Ofrecer tutoriales o videos sobre cómo usar el indicador.

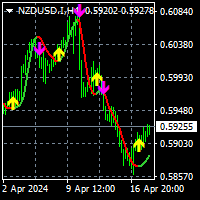
The Practitioner indicator is based on a unique algorithm for analyzing price behavior and presents the result of this complex work in the form of lines. One of the advantages of this indicator is that it automatically changes the color of the line according to the current direction of the price movement.
It is important to note that the indicator has an option to enable alerts when the line color changes. This gives the trader the opportunity to quickly respond to changes and identify new tre

TrendMaster: Your Ultimate Non-Repaint Trading Indicator for Consistent Profits Introducing TrendMaster , the cutting-edge NONREPAINT Trading indicator that empowers traders to seize market opportunities with unparalleled precision. Utilizing a sophisticated blend of the Relative Strength Index (RSI), Stochastic Oscillator, and Average Directional Index (ADX), TrendMaster delivers highly accurate buy and sell signals, allowing traders to capitalize on both bullish and bearish trends confidently

The RSI Advanced tool will help traders capture trends and optimal entry points by:
- Enter a Buy order when the green line crosses the yellow line. Provided that the yellow line is near line 32 or 20 - Enter a Sell order when the green line crosses the yellow line. Provided that the yellow line is near line 68 or 80
Additionally, you can combine it with the convergence divergence that occurs at the green line. **When you purchase the Mastering the RSI MT4 or Mastering the RSI MT5 indicator,

SmartSignal Sniper: Tu Compañero de Trading Definitivo Descubre el poder del trading preciso con SmartSignal Sniper. Diseñado para ofrecer señales de compra y venta precisas, esta herramienta avanzada permite a traders de todos los niveles navegar por los mercados financieros con confianza y claridad. Características Clave: Precisión Milimétrica: SmartSignal Sniper utiliza algoritmos avanzados para proporcionar señales precisas de compra y venta, ayudando a los traders a identificar oportunidade

This scanner uses Quarters Theory. It finds the nearest quarters to current price. And when price gets close within a few points, then it highlights and sends alerts. Features: Define Major Quarters Distance for every timeframe Option to use: Half Point between majors Quarters between half point and majors Search for nearest quarter point and price Show Highlight and send Alerts Show/Hide Quarter Lines Show/Hide Price and QP Distance
Detailed post and Extras: https://www.mql5.com/en/blogs/post/
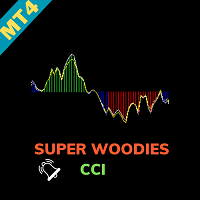
Super Woodies CCI Indicator - Enhance Your Trading Precision Step into the realm of precision trading with the "Super Woodies CCI Indicator" for MetaTrader 4. This advanced tool, inspired by Woodie's CCI, is designed to provide you with clear insights into market trends, enabling you to make well-informed trading decisions. Basic Details : Indicator Type : Super Woodies CCI Indicator Key Metrics : Real-time CCI (Commodity Channel Index) analysis for price trends. Customization : Fully customizab
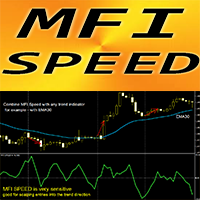
Indicador Crypto_Forex "MFI Speed" para MT4, sin repintado.
- El cálculo de este indicador se basa en ecuaciones de la física. - MFI Speed es la primera derivada del propio MFI. - El índice de flujo de dinero (MFI) es un oscilador técnico que utiliza datos de precio y volumen para identificar zonas de sobrecompra y sobreventa. - MFI Speed es bueno para hacer scalping con entradas de impulso en la dirección de la tendencia principal. - Úselo en combinación con un indicador de tendencia adec

Adaptive Market Dynamics Indicator (AMDI) is an innovative tool for traders across all financial markets. This indicator is designed to provide traders with a deep understanding of market dynamics and adaptive trading signals based on current market conditions. Key Features and Benefits: Adaptive Analytics : AMDI can automatically adapt to changing market conditions, allowing traders to effectively adjust their strategies in real-time. Multifactor Analysis : The indicator offers a comprehensiv

OVERVIEW
K-means is a clustering algorithm commonly used in machine learning to group data points into distinct clusters based on their similarities. While K-means is not typically used directly for identifying support and resistance levels in financial markets, it can serve as a tool in a broader analysis approach.
Support and resistance levels are price levels in financial markets where the price tends to react or reverse. Support is a level where the price tends to stop falling and m

"Adjustable Fractals" es una versión avanzada del indicador fractal, ¡una herramienta de trading muy útil!
- Como sabemos, el indicador fractal estándar de mt4 no tiene ninguna configuración, lo que resulta muy incómodo para los traders. - Adjustable Fractals ha resuelto ese problema: tiene todas las configuraciones necesarias: - Período ajustable del indicador (valores recomendados: por encima de 7). - Distancia ajustable de los máximos y mínimos del precio. - Diseño ajustable de las flechas
'Zoro LITE' is a reversal strategy based MT4 indicator with advance pre-alert system. Its an 100% non repaint indicator with an average accuracy of about 70-95% in a ranging market. --------------------------------------------------------- Features: Neural Network based Advance price action algorithms Pre-alert (get ready) signals Non-delay indications 24/7 signals OTC markets supported Auto-trading supported 100% Non repaint 100% No lag No recalculating Lifetime license -----------------------

Indicator : RealValueIndicator Description : RealValueIndicator is a powerful tool designed specifically for trading on the EURUSD pair. This indicator analyzes all EUR and USD pairs, calculates their real currency strength values, and displays them as a single realistic value to give you a head start on price. This indicator will tell you moves before they happen if you use it right. RealValueIndicator allows you to get a quick and accurate overview of the EURUSD currency pair tops and bottoms,
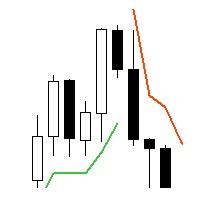
Supertrend - невероятно мощный и универсальный индикатор, предназначенный для помощи трейдерам в определении текущего тренда на конкретном торговом инструменте. С помощью двух встроенных индикаторов, Average True Range и Standard Deviation, трейдеры могут выбрать наиболее подходящий индикатор для своей стратегии торговли. Пользователи также могут настроить период этих индикаторов и выбрать цену (Close, High, Low, Open, Weighted), к которой он должен быть применен, с Typical price в качестве опци

このインディケータはボリンジャーバンドを裁量およびEAで実際に利用してきた私自身の経験から、より手軽に、かつ効果的に活用できるよう作成された裁量トレード用サインツールです。 ブレイクアウトでの順張り、リバウンドでの逆張りの両面で利用でき、各種のフィルター機能でより精度の高いサインを発信します 勝敗判定機能により、このインディケータの直近の相場環境に対する有効性を確認できます 全通貨ペア、全タイムフレームで利用できます。リペイントはしません
設定項目は以下の通りです。 Bollinger Bands Period
Bollinger Bands Deviation
Bollinger Bands Shift
Entry Mode ...ボリンジャーバンドにタッチしてからのBreakout(順張り), Rebound(逆張り)のどちらかを指定 Plus Filter ...独自アルゴリズムによるフィルターでシグナルの精度を高めます(Reboundモード専用) Trend Filter ...下で設定する移動平均のトレンド方向でのシグナルに限定します Moving Average

Trop is a trend indicator that has several important advantages. It helps to pinpoint both new and existing trends in the market. One of its key advantages is its quick adjustment and responsiveness to changes in schedule. The effectiveness of the indicator depends on the set CalcBars period. The longer this period, the smoother the indicator displays the trend line. On the other hand, as the period decreases, the indicator takes into account more market noise, which can be useful in generating

In the world of trading, one of the main concerns is finding a reliable trading system. Meet the TrendEdge Channel indicator - your reliable companion in this search. Developed based on complex mathematical calculations, this indicator predicts the most likely short-term price movements.
TrendEdge Channel is designed specifically to identify trends in price movements. Thanks to it, you can quickly determine not only the direction of the trend, but also the levels of interaction between buyers

El indicador Spread Pulse es una herramienta eficaz que proporciona a los operadores información sobre el diferencial actual en el gráfico. El diferencial es la diferencia entre el precio de compra y el precio de venta de un instrumento.
El indicador se presenta en forma de texto que se muestra en el gráfico. Esto permite al comerciante rastrear fácilmente el diferencial actual.
Una de las principales ventajas del indicador Spread Pulse es su visualización en color. Dependiendo del tamaño

The SignalSailor indicator is your reliable assistant in Forex for quick market analysis. It not only reflects the current market condition but also provides valuable signals about the best times to open trades. Market conditions are constantly changing, and to stay ahead, a trader needs to quickly adapt their strategies. This is precisely why the Klaus indicator was created - it will help you accurately determine the direction of the trend on the price chart.
SignalSailor is an indispensable

The TrendTide indicator provides accurate signals about potential market reversals. Its primary purpose is to generate signals for entering and exiting trades. Determining the current market trend is a critically important aspect for traders. The intelligent algorithm of TrendTide efficiently identifies trends, filters market noise, and creates precise entry and exit signals.
This indicator represents an advanced algorithm for visualizing the market trend. It is designed to identify both long-

Introducing the Reversal and Breakout Signals
This innovative tool is crafted to enhance your chart analysis by identifying potential reversal and breakout opportunities directly on your charts. It's designed with both novice and experienced traders in mind, providing intuitive visual cues for better decision-making. Let's dive into the key features and how it operates:
### Key Features:
Dynamic Period Settings: Customize the sensitivity of the indicator with user-def

The Market Sentiment Meter indicator calculates the saturation levels of the price chart. A signal to exit the oversold zone indicates a buying opportunity, and a signal to exit the overbought zone indicates a selling opportunity. Typically, for this indicator you need to set relative values for the overbought (Top) and oversold (Bottom) levels.
Often a good trend can be seen visually on the price chart. However, an experienced trader must clearly understand the current distribution of forces

Introducing High Probability SARs, a classic Forex indicator designed to enhance your trading strategy with its advanced analysis capabilities. High Probability SARs utilizes sophisticated algorithms to identify potential trend reversals with precision. By incorporating the Parabolic SAR indicator, it offers traders valuable insights into market dynamics, allowing for informed decision-making. This innovative tool provides traders with signals based on the Modified parabolic SARs, helping to ide

TrendTrack indicator: Stay on trend easily!
The TrendTrack indicator is designed to analyze price behavior in the Forex market, helping the trader to quickly spot temporary weaknesses or obvious changes in trend direction. Entering the market is only the first step, but maintaining a position is more difficult. With TrendTrack, staying on trend becomes easy!
Peculiarities:
Trend Analysis: The indicator analyzes historical data, providing signals to the trader. The arrow format of the indicat

The Trendline Trader indicator is designed to reliably track market trends, ignoring sharp fluctuations and noise in the market. This indicator is suitable for trading on both short and long time intervals due to its ability to filter out sudden price spikes and corrections. It is based on the iLow, iHigh, iMA and iATR indicators, which makes it particularly reliable.
Parameters for setting up the indicator: Length: period for channel calculation and noise filtering. Star: period for determini

History VT Информационный индикатор. Показывает на графике, сразу после открытия сделки, стрелку именно на той японской свече, где позиция открыта.
То есть там, где появилась штрихпунктирная линия открытой сделки, в терминале.
Далее, после открытия сделки, как обычно, трейдер ставит SL и TP и ждёт итога своего выбора направления движения.
После того как сделка закрылась, по « sl » или « tp » или «вручную», индикатор отображает на графике уровни и текстовые сноски параметров сделки.
Сноски

Introduction
One of the patterns in "RTM" is the "QM" pattern, also known as "Quasimodo". Its name is derived from the appearance of "Hunchback of Notre-Dame" from Victor Hugo's novel. It is a type of "Head and Shoulders" pattern.
Formation Method
Upward Trend
In an upward trend, the left shoulder is formed, and the price creates a new peak higher than the left shoulder peak . After a decline, it manages to break the previous low and move upward again. We expect the price to

Product detailed post: https://www.mql5.com/en/blogs/post/756962
Get free demo from the link in above post.
Features: - Multi Heiken Parameters
- Alerts & Highlights for Heiken Switch
- Heiken Alignment Alerts
- Multi-timeframe Alignment Alerts
- Multi Currency
Heiken Explained: Heiken Settings: All comma separated lists will be used for different heiken ashi's. Example: 5,40,188 will mean that MAPeriod1 in 1st heiken will be 5; In 2nd heiken will be 40 and in 3rd heiken ashi will be 188. 1,1

Trend Master Chart es el indicador de tendencia que necesita. Se superpone al gráfico y utiliza códigos de colores para definir diferentes tendencias/movimientos del mercado. Utiliza un algoritmo que combina dos medias móviles y diferentes osciladores. Los periodos de estos tres elementos son modificables. Funciona en cualquier período de tiempo y en cualquier par.
De un vistazo podrás identificar una tendencia alcista o bajista y los diferentes puntos de entrada a esta tendencia. Por ejemplo,
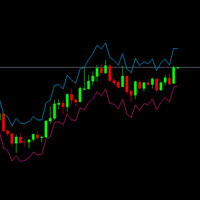
Para todas las temporalidades y todos los símbolos. Basado en el Indicador ATR. Calcula y dibuja en el gráfico los puntos adecuados para colocar el Stop Loss o el Take Profit según la volatilidad actual del mercado. Se pueden ajustar los siguientes inputs para un uso más personalizado del indicador: ATR_Period: Número de velas anteriores que se tendrán en cuenta para el cálculo. ATR_Multiplier: Número por el que se multiplicará el ATR para dibujar los puntos en el gráfico. A menor multiplicador
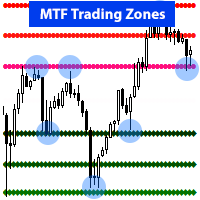
Not a traditional support resistance, or pivot point indicator. RevCan's " Early Reversal - MTF Trading Zones " is an Advanced tool that identifies potential market reversal points, or change of a trend at an early stage using MTF chart analysis. >> It analyzes multiple chart timeframes (MTF) to find these key price turnover zones where big banks and institutions are likely to place their trades, hence chances for you for high probability trade entry, Stop loss, and Take profit targets to maximi

Advanced Currency Strength Indicator Comprehensive Market Analysis in One Tool User-Friendly and Versatile for All Traders This indicator simplifies market analysis by evaluating the strength of 28 forex currency pairs, along with Gold, Silver, and other selected instruments. By using a Triangular Moving Average (TMA) and ATR-based bands , it provides a structured view of market movements, assisting traders in making informed decisions. Identify Market Trends Efficiently The indicator helps ass

Forex Gump Advanced es una estrategia comercial lista para usar basada en un indicador. Forex Gump Advanced es un indicador que muestra al operador cuándo abrir operaciones, en qué dirección abrir y cuándo cerrar. Forex Gump Advanced muestra toda la información necesaria de forma clara en el gráfico.
Ventajas del indicador: sistema de comercio completamente listo no vuelve a dibujar en el 95% de los casos el precio va en la dirección de la señal. El 5% de las señales no funcionan y cierran con

TeconLab Indicator User Guide Overview The TeconLab Indicator is a tool for MetaTrader 4 (MT4) users, fine-tuned to gather price information, including Date, Time, Open, High, Low, Close, and Volume, and update this data in real-time. Uniquely, this indicator autonomously refreshes the CSV file every minute or less, meaning there's no need for manual restarts—just activate it once, and it will continuously collect data as long as MT4 is running. It maintains the latest data according to the size
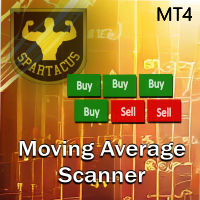
Moving Average Scanner es un escáner de múltiples períodos de tiempo perfecto para ver la tendencia en varios períodos de tiempo de un vistazo sin cambiar el gráfico. Puede utilizar hasta 4 medias móviles de su elección en 9 unidades de tiempo. Es totalmente configurable y se puede mover a cualquier parte del gráfico simplemente "arrastrar y soltar". Las medias móviles se pueden configurar en 4 métodos de cálculo diferentes. También puede configurar alertas basadas en la cantidad de promedios mó
Trend Chart Histogram es un indicador basado en un algoritmo que utiliza dos medias móviles y varios osciladores. Gracias a su código de colores, permite identificar rápidamente la tendencia y aprovechar los mayores impulsos del mercado. Los colores claros indican la tendencia, los colores oscuros definen impulsos y el gris indica que no se debe ingresar al mercado.
Versión MT5 aquí.
Parámetros de entrada: - Período 1 (período rápido) - Período 2 (período lento) - Periodo del oscilador
Puede

Once upon a time, in the bustling streets of Gotham City, there lived a mysterious figure known only as the Joker. With his enigmatic grin and unpredictable nature, the Joker roamed the city's financial district, leaving chaos and uncertainty in his wake. One fateful day, a group of traders stumbled upon a peculiar artifact hidden deep within the dark alleys of Gotham. It was a cryptic indicator known as the "Joker Arrow," rumored to possess the power to predict market movements with uncanny acc
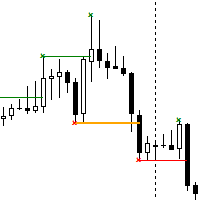
The Break of Structure (BoS) and Change of Character indicator is a powerful tool designed to identify significant turning points in price movements on financial charts within the MetaTrader 4 platform. By analyzing price action, this indicator highlights instances where the market shifts from a trend to a potential reversal or consolidation phase. Utilizing sophisticated algorithms, the indicator identifies breakouts where the structure of price movement undergoes notable changes. These breakou
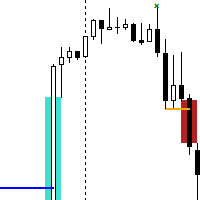
The Break of Structure (BoS) and Change of Character indicator with Fair Value Gap (FVG) filter is a specialized tool designed to enhance trading strategies by pinpointing high-probability trading opportunities on price charts. By integrating the BoS and Change of Character concepts with the FVG formation, this indicator provides traders with a robust filtering mechanism to identify optimal entry and exit points. The indicator identifies instances where the structure of price movements is disrup

About Line Drawing: ( 1) Select Line Type Zigzag Line Fibo Horizontal Trend Line Range Line Price-Time Net ( 2) Set Line Style To set line color built-in or style and width just by clicking certain button To set line color to user color by clicking the second color button of second line when it is pressed ( 3) Start Drawing If you have not pressed any of those Drawing-Type-Button(HL/Rng/Net/Fibo),when you select the Line-Color-Button or Line-Style-Button or Line-Width-Button it will draw Zi
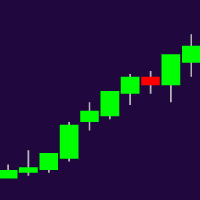
Higher Timeframe Chart Overlay will display higher timeframe candles, including the number of candles high/low you specify.
You no longer need to switch timeframes to check the candles. Everything can be shown in one chart. MT5 Version : https://www.mql5.com/en/market/product/115682 Almost everything can be change as you want. You can change/set:
- Choose different colors for the body and top/bottom wicks.
- Panel's height and width.
- The width of the body and wicks
- Change background a

Gold Level MT4 Special offer - https://www.mql5.com/en/users/bossik2810
A great helper for trading Gold.
Levels do not repaint and do not change their data We recommend using it with the indicator - Professional Trade Arrow
Levels are built every day, so you will trade every day with the indicator.
Gold Level.
Price markups are shown on the chart, after reaching TP1 or SL1, close half of the position, and the rest is transferred to breakeven.
Any questions? Need help?, I am always happy to

El sistema de comercio técnico de BB Reversal Arrows se ha desarrollado para predecir puntos inversos para tomar decisiones minoristas.
El indicador analiza la situación actual del mercado y se estructura para varios criterios: la expectativa de momentos de reversión, posibles puntos de inflexión, señales de compra y venta.
El indicador no contiene información en exceso, tiene una interfaz visual comprensible, lo que permite a los operadores tomar decisiones razonables.
Todas las flechas parece

TRADE THE BREAKOUTS like Gordon Gekko Gordon Gekko, the ruthless and iconic character from the movie "Wall Street," is renowned for his aggressive and opportunistic trading strategies. When it comes to trading breakouts, Gekko embodies the mindset of a savvy and relentless trader who seizes every opportunity to capitalize on market movements. In Gekko's trading playbook, spotting breakout opportunities is akin to identifying potential gold mines in the market. He meticulously scans the charts

¡Descubre el poder del análisis de volumen con nuestro indicador de perfil de volumen para Metatrader! / Version MT5
Basic Volume Profile es un indicador especificamente diseñado para traders manuales que buscan optimizar su operativa. El indicador de perfil de volumen es una herramienta esencial para cualquier trader serio que desee entender mejor el comportamiento del mercado. Con nuestra solución innovadora podrás visualizar de manera clara y concisa cómo se distribuye el volumen de negocia

The Trend_Scalper_Arrows_Entry&Exit trend indicator perfectly follows the trend, indicates entry search zones, indicates entry signals with arrows, and also indicates zones for fixing market orders with vertical lines. An excellent indicator for both beginners in Forex trading and professionals.
All lines, arrows, alerts can be disabled.
See all indicator parameters on the screenshot.

Channel indicator, written according to a strategy based on indicators: BollingerBands, Moving Average, RSI and TMA. The indicator embodies arrow signals for the trend, counter-trend, and also for fixing transactions. And also all possible alerts. The indicator is ideal for working together with a trend indicator for taking profits. All settings are on screenshots.
This indicator informs the user when the ATR is above a certain value defined by the user, as well as when the ATR prints a percentage increase or percentage decrease in its value, in order to offer the user information about the occurrence of spikes or drops in volatility which can be widely used within volatility-based trading systems or, especially, in Recovery Zone or Grid Hedge systems. Furthermore, as the volatility aspect is extremely determining for the success rate of any system based o

Subscribe to the MA7 Trading channel to receive notifications about new programs, updates and other information. Ask questions in the profile on the MQL5 .
Description of work The MA7 Clover indicator is based on candle shapes. Shows the "Pin Bar" candle pattern. Detailed information about the MA7 Clover indicator.
Indicator settings General settings: Min body size ; Max body size ; Min nose size ; Max nose size ; Minimum pattern size ; Maximum pattern size ; Analysis of the candle direction
To download MT5 version please click here .
- This is the exact conversion from TradingView: " PA-Adaptive Hull Parabolic " By "Loxx".
- This is a non-repaint and light processing load indicator
- You can message in private chat for further changes you need.
- All input options are available except candle coloring.
- Buffers are available for processing within EAs.
El MA Killer Indicator es el arma definitiva para los operadores que utilizan promedios móviles. Es un sistema completo que utiliza varias herramientas accesibles directamente desde un panel de gestión . Gracias a sus herramientas usted tiene una visión general del mercado y una valiosa ayuda en la toma de decisiones para acceder a un puesto.
Consiste:
- El indicador Trend Master chart que muestra la tendencia directamente en el gráfico mediante un código de color. Esta tendencia se calcula me
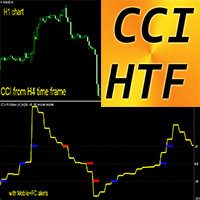
Indicador Crypto_Forex CCI HTF Oscillator para MT4.
- Mejore sus métodos de negociación con el oscilador profesional CCI HTF para MT4. HTF significa: marco temporal superior. - El índice de canal de productos básicos (CCI) mide la diferencia entre el precio actual y el precio promedio histórico. - Niveles importantes: +/-200, +/-100. - Es ideal para tomar entradas de venta desde la zona superior a +200 y entradas de compra desde la zona inferior a -200. - Este indicador es excelente para siste
El indicador RSI Pro Analyzer es una poderosa herramienta diseñada para operadores que buscan tomar decisiones informadas en múltiples períodos de tiempo simultáneamente. Este indicador utiliza el RSI para proporcionar señales de sobrecompra, sobreventa y tendencia , lo que facilita la identificación de oportunidades de entrada al mercado. Su principal ventaja es su facilidad de lectura gracias a sus códigos de colores claros y distintos para indicar las diferentes condiciones del mercado.
El i
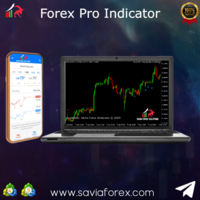
Savia Forex Pro Indicator The Savia Forex Solutions Forex Pro Indicator gives you highly accurate entries on all Forex/Currency pairs, Indices and Cryptocurrencies. The Forex Pro Indicator is dynamic and powerful and is optimized for all timeframes and ALL Currency pairs, Indices, Commodities, and Cryptocurrency pairs. Trade with improved confidence and maximize your success rate. Benefits Dynamic and Powerful. Forex Pro Indicator is fully optimized for all chart timeframes. Forex Pro Indicator

Con esta herramienta comercial, puede escanear 15 mercados simultáneamente.
Presentamos el nuevo indicador comercial 2024:
️ Tablero Estocástico de marco de tiempo múltiple y moneda múltiple.
Hay al menos dos razones por las que creé esta herramienta comercial:
Primero, estoy aburrido de observar sólo un mercado. En segundo lugar, no quiero perder el momento de entrada en otro mercado.
Por eso quiero conocer al mismo tiempo otras condiciones del mercado.
Por este motivo, necesito un escá

The Forex Correlation Indicator is a powerful tool designed to analyze and display the correlation between different major forex pairs in the market. This indicator helps traders identify relationships and trends between currency pairs, allowing for more informed trading decisions. Key Features: Displays correlation coefficients between pairs. Visualizes correlation strength through color-coded indicators. Customizable settings for timeframes and correlation calculations. User-friendly interfac

The Forex indicator TrendNavigator is a technical indicator. TrendNavigator is a tool that allows traders employing this strategy to better understand what is happening in the market and predict in which direction the price will continue to move. The indicator's values are calculated based on price movements of the currency pair or any other financial asset. Within the scope of technical analysis, the TrendNavigator indicator is used by traders to forecast future price values or the overall

The Trend Seeker indicator is perfectly suited for tracking long-term trends in the Forex market and can be used without restrictions on instruments or time intervals. This indicator allows attempting to forecast future values, but its main application lies in generating buy and sell signals. The AlphaTrend Seeker tracks market trends, disregarding sharp fluctuations and noise around the average price. It is based on the idea of technical analysis, asserting that the market has a cyclical n

nuestro indicador Basic Support and Resistance es la solución que necesita para aumentar su análisis técnico.Este indicador le permite proyectar niveles de soporte y resistencia en el gráfico/ versión mt5
características
Integración de los niveles de Fibonacci: Con la opción de mostrar los niveles de Fibonacci junto con los niveles de soporte y resistencia, nuestro indicador le brinda una visión aún más profunda del comportamiento del mercado y las posibles áreas de inversión.
Optimización de

The "Trend Tandem" indicator is a trend analysis tool in financial markets that helps traders determine the direction of price movement.
Options:
RISK: Determines the level of risk taken into account in the trend analysis. The higher the value, the more aggressively volatility is taken into account. SSP (SSP Period): Defines the period of the moving average used to identify a trend. The higher the value, the smoother the trend signal will be. CountBars: Determines the number of bars on which
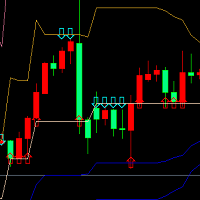
Este indicador se basa en la teoría de la sección dorada, que obtiene los precios altos y bajos de las últimas 22 líneas K (por defecto), y obtiene la curva de soporte y presión a través del cálculo del coeficiente de sección dorada. Cuando el precio se acerca a la línea de presión hacia arriba por primera vez, o se acerca a la línea de presión muchas veces, aparecerá una flecha hacia abajo que coincide, lo que indica que hay presión y es adecuado para acortar el sell; Cuando el precio se acerc
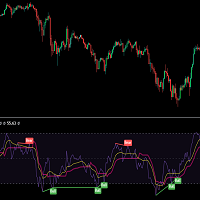
MOST is applied on this RSI moving average with an extra default option added VAR/VIDYA (Variable Index Dynamic Moving Average)
MOST added on RSI has a Moving Average of RSI and a trailing percent stop level of the Moving Average that can be adjusted by changing the length of the MA and %percent of the stop level.
BUY SIGNAL when the Moving Average Line crosses above the MOST Line
LONG CONDITION when the Moving Average is above the MOST
SELL SIGNAL when Moving Average Line crosses below MOS

MA Trend Following Indicator for MT4 is a simple technical analysis tool designed to follow the trend in any currency pair chosen by the trader by combining 3 moving averages on two different time frames, one long term and one short term.
It basically provides a bullish or bearish signal when the moving averages on one time frame align with the moving averages on a different time frame to have a confluence signal.
The indicator is presented as a screener with multiple currency pairs (that th

MAXLUM SYSTEM is a Trading System that uses anti-Margin Call without using SL with a positive correlation Hedging Strategy
Simple example of BUY on EURUSD and SELL on GBPUSD at the same time This kind of trading will not occur as a Margin Call By calculating the GAP difference between the 2 pairs we can take advantage of the GAP
This indicator will be more effective if you use Data Analysis download excel file on telegram Group Please join the Maxlum System Telegram group for details t.me/max

This tool helps you to find easily and clearly when you enter trade with day time and price examples Entered Buy at Monday 20:30 with price 2150 Exited buy at Tues 10: 30 with price 2187 You can convert as local time by inputting shift hours and minutes.
Trading is a learning skill, so you have to evaluate your trading performance at the end of your day. Did you follow your rules? If you did then it was a win, regardless if you earned pips or not. If you didn't follow my rules then is a

缠中说禅在MT4的应用,该指标自动识别分型,划笔,划线段,显示笔中枢,线段中枢,也可以根据需求在参数中设置显示自己所需要的。 1.笔采用条件较为宽松的新笔。 2.当前分型与前面分型不能构成笔时,若与前面笔同向且创新高或新底时会延伸笔,若与前面笔异向且符合替换条件则去除倒数第一笔,直接倒数第二笔。 3.线段的终结第一类情况:缺口封闭,再次创新高或新底新低,则判为终结,同时破坏那一笔的右侧考虑特征序列包含。 4.线段终结的第二类情况,缺口未封闭,考虑后一段特征序列分型出现新的顶底分型,同时做了包含处理。 5.中枢显示笔中枢和段中枢可在参数选择 6.第一类买卖点两种方式可选,参数1为MACD动能柱面积,参数2为斜率

The Tripl indicator is designed to visually display the current trend in the market. One of the key aspects of currency market analysis is identifying a trend, which is a stable direction in which prices are moving. For this purpose, the Tripl indicator uses calculations that smooth out sharp fluctuations that do not have a significant impact on the overall trend of price movements.
A trend can be either upward (bullish) or downward (bearish). Most often, a trend develops for a long time befor

With the growth of information technology and the increasing number of participants in financial markets, traditional analysis tools are becoming less effective. Conventional technical indicators, such as the moving average or stochastic, in their pure form are unable to accurately determine the direction of the trend or its reversal. Is it possible to find an indicator that remains effective for 14 years without changing its parameters, and at the same time adapts to market changes? Yes, such
El Smart Volume Tracker es un indicador diseñado para proporcionar información sobre el sentimiento del mercado al presentar visualmente datos de volumen de oferta y demanda en una ventana dedicada. Esta herramienta intuitiva ayuda a los operadores a identificar rápidamente dónde se concentra la actividad de compra y venta, lo que les permite tomar decisiones comerciales más informadas.
Con Smart Volume Tracker, puede evaluar fácilmente si el mercado se inclina hacia una tendencia alcista o ba

30% DISCOUNT ! DISCOUNT ! DISCOUNT ONLY FOR 5 USERS at125$ valid for 1 day only.Grab it The PERFECT TREND HIT creates BUY and SELL perfect trend arrow signals based on ADX EMA AND RSI And all filters inbuilt with accurate trend entries. Furthermore, the indicator and template display the trend direction, strength, and trade recommendation for independent price charts. ROCK WITH THE TREND Moreover, it shows the final trade recommendation to BUY or SELL with all filters and displays that info
MetaTrader Market ofrece a todos los desarrollador de programas de trading una sencilla y cómoda plataforma para ponerlos a la venta.
Le ayudaremos con la presentación y explicaremos cómo preparar la descripción de su producto para el Market. Todos los programas que se venden a través del Market están protegidos por una codificación adicional y pueden ser iniciados sólo en el ordenador del comprador. La copia ilegal es imposible.
Está perdiendo oportunidades comerciales:
- Aplicaciones de trading gratuitas
- 8 000+ señales para copiar
- Noticias económicas para analizar los mercados financieros
Registro
Entrada
Si no tiene cuenta de usuario, regístrese
Para iniciar sesión y usar el sitio web MQL5.com es necesario permitir el uso de Сookies.
Por favor, active este ajuste en su navegador, de lo contrario, no podrá iniciar sesión.