Watch the Market tutorial videos on YouTube
How to buy а trading robot or an indicator
Run your EA on
virtual hosting
virtual hosting
Test аn indicator/trading robot before buying
Want to earn in the Market?
How to present a product for a sell-through
Expert Advisors and Indicators for MetaTrader 4 - 57

Better Support & Resistance shows the best support and resistance lines and zones. It is based on Fractals with the factor of your choice. All fractals are assembled, weighted, extended and merged into a clear set of support and resistance lines. The immediate nearby lines are shown as zones when price is in that zone. Better Support & Resistance gives you the best overview of the important price levels.
Settings Better Support & Resistance's default settings are good enough most of the time.

Breakout Experts Advisor
Main strategy of this Experts Advisor is based on Daily High and Daily Low. If today's price break yesterday's high or low, this Experts will open trade. Please consider that is Experts are Martingale. But, their distance already set on the EA's program. FYI, distance for every order (on martingale) is also based on Fibonacci Retracement. It'll make every order not too close or too far. It's also help when the market are ranging/sideways. And, our maximum opened trade

Ever wondered why standard ADX is made unsigned and what if it would be kept signed? This indicator gives the answer, which allows you to trade more efficient. This indicator calculates ADX values using standard formulae, but excludes operation of taking the module of ADX values, which is forcedly added into ADX for some reason. In other words, the indicator preserves natural signs of ADX values, which makes it more consistent, easy to use, and gives signals earlier than standard ADX. Strictly s
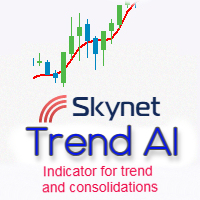
Skynet Trend AI shows trend on the price chart with a colored line. Usually, all traders are looking for a clue where to buy and where to sell using classic or downloaded indicators. But often it gets more and more confusing and every time you find it difficult and confusing to create a hint for yourself where to open a position. Self-reliance does not always justify the result. Therefore, it is better to use a simple and intuitive tool to solve your problem! Skynet Trend AI gives visual

Box martingale system is an indicator designed to trade martingale. This indicator sends a signal from the highest point where the trend is likely to return. With these signals the user starts the trades. These signals appear in the form of a box. The user can see from which point the signal is given. The important thing in trading martingale is to find a good starting point. This indicator provides this starting point.
Trade rules Start processing when the first trade signal arrives. The impo
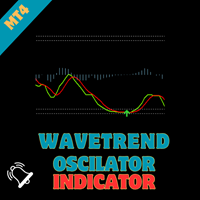
WaveTrend Oscillator - Bringing Tradingview's Renowned Indicator to MQL Elevate your trading strategies with the "WaveTrend Oscillator," an MQL port of the renowned TS/MT indicator created by Lazybear on tradingview. This powerful indicator provides valuable insights into market dynamics, offering clear signals for optimal entry and exit points in your trades.
Key Features : Proven Effectiveness : Based on the popular TS/MT indicator, the WaveTrend Oscillator brings a time-tested and proven ap
Volume Volatility Dashboard is a great tool for quickest possible analysis of multiple currency pairs in terms of extremely high and extremely low accumulation to distribution ratio in comparison to values from past. The number of displayed symbols is 30 and the name of each symbol can be edited in the parameters, so we are able to analyze not only predetermined currency pairs, but also other ones, commodities, equities, indices, currency pairs with prefixes and suffixes etc... This analyzer is

Pivot trend indicator is a trend indicator that uses standard pivot calculation and some indicators. The purpose of the indicator is to calculate the possible trends using the pivot point. And to give the user an idea about trend direction. You can use this display as a trend indicator. Or with other indicators suitable for your strategy.
Features The green bar represents the upward trend. The red bar represents the downward trend. The blue pivot point represents the upward trend. The yellow p

My Intraday trading session indicator. SL Session Strength 28 Pair https://www.mql5.com/en/market/product/57585 This strategy is even used by the Banks to make profits. They take a strong currency and pitch against a weak currency This indicator allows you to analyze the hidden trends and correlations between the 8 most traded currencies via unique strength meter which creates multiple charts in a single window based on the price action of each currency in relation to all other currenci

Contact me after payment to send you the user manual PDF file. Introduction The moving average indicator is the most well-known and one of the most popular indicators among traders. It is very simple to work with, but a basic question has always become a big challenge among traders: What is the most optimal setting of the moving average for each chart-time frame? The answer to this question is very difficult, you have to try different settings of the moving average indicator for different chart

Reward Multiplier is a semi-automatic trade manager based on pyramid trading that opens additional orders with the running profit of your trades to maximize return exponentially without increasing the risk. Unlike other similar EAs, this tool shows potential profit/loss and reward to risk ratio before even entering the first trade!
Download Demo here (starting lot is fixed at 0.01) Guide + tips here MT5 version here
You only open the first order. When your trade goes into profit RM opens
テクニカル指標開発の第一人者であるトム・デマークが考案した TDシーケンシャルは、 トレンドの転換点を判断するのに有用なインディケータです。このインディケータは TDシーケンシャルを裁量およびEAで実際に利用してきた私自身の経験から、より手軽に、かつ効果的に活用できるよう作成された裁量トレード用サインツールです。
強いトレンドが生じている際に多くのだましが生じるのはTDシーケンシャルの弱点と思われますが、これを克服するために強力なフィルターを装備しています。また、最も有効と思われるセットアップ9に絞ってサインを発信します。
全通貨ペア、全タイムフレームで利用できます。勝敗判定機能により、このインディケータの直近の相場環境に対する有効性を確認できます。
設定項目は下記のとおりです。 Enable Protect Mode...強いトレンドが発生した際の連敗を回避します Box Filter...下で設定する3つのタイムフレームでの移動平均でパーフェクト・オーダーが発生していない状態をボックス相場と判定し、サインを限定します Moving Average Time Frame1
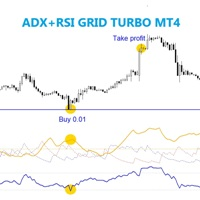
The EA trades on price which over bought and over sold of RSI indicator meanwhile check over limit ADX value level. Best time frame 30 mins, Any pair any broker no limited, recommend minimum deposit 500$
SETTING Symbole - Set symbol to trade. ADX_period - Set ADX period. ADX_value - Set ADX level. RSI_period - Set RSI period. RSI_upper_level - Set RSI high level. RSI_lower_level - Set RSI low level. Bar_history - Set bar to confirm trade. Lots - start lot. Multiple_lots - Multiply lot for n

KT MACD Alerts is a personal implementation of the standard MACD indicator available in Metatrader. It provides alerts and also draws vertical lines for the below two events: When MACD crosses above the zero line. When MACD crosses below the zero line.
Features It comes with an inbuilt MTF scanner, which shows the MACD direction on every time frame. A perfect choice for traders who speculate the MACD crossovers above/below the zero line. Along with the alerts, it also draws the vertical line
Introduction
This indicator marks Pin Bars (bars with an unusually long upper or lower candle wick) on your chart. It will also send alerts when one forms, including via e-mail or push notification to your phone . It's ideal for when you want to be notified of a Pin Bar set-up but don't want to have to sit in front of your chart all day.
You can configure all the settings including: What proportion of the bar should be made up of the wick How big or small the total size of the Pin Bar has
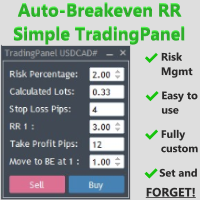
The Auto-Breakeven RR Simple TradingPanel EA is a simple and intuitive tool that will be an asset to your trading arsenal. Have you ever missed the perfect entry because you were busy calculating the lot size?
I have. Many times. Which is why I created this EA to simplify and automate risk management as much as I could.
A true SET AND FORGET tool - execute your trade and walk away to prevent micromanaging your trade. This tool secures the trade at your specified Risk-to-Reward (RR) level.

A tall upper shadow occurs when the price moves during the period, but goes back down, which is a bearish signal. A tall lower shadow forms when bears push the price down, but bulls pull it back up, which leaves a long line or shadow. This is considered a bullish signal.
Some technical analysts believe a tall or long shadow means the stock will turn or reverse. Some believe a short or lower shadow means a price rise is coming. In other words, a tall upper shadow means a downturn is coming, whil
The indicator plots the Up and Down arrows on every price swing made by the classic Zigzag indicator. When Zigzag makes a new swing low, a green arrow is plotted. Likewise, a red arrow is plotted when Zigzag makes a new swing high.
Features
Compared to the classic ZigZag, it marks the swing points more effectively. It helps to identify the forming chart patterns in advance. It comes with a Multi-Timeframe scanner which shows the Zigzag direction on each timeframe. All Metatrader alerts includ

Полностью автоматическая торговая система. Vik Plan B Mini - это укороченная версия советника Vik Plan B, с минимальными настройками. Для входа в сделку использует свечной анализ. Входные параметры: UseDayProfitStop - если сегодня был профит, больше не торгуем FixLot - фиксированный лот StartHour - старт торговли StopHour - стоп торговли UseCloseAllProfit - вкл/откл закрытие всех ордеров по заданому профиту USD_Profit - профит для закрытие всех ордеров UseCloseAllStop - вкл/откл закрытие

With this indicator you'll have a general reading of the market's range using Gann's calculating modes. Gann's swing is used to have a quick reading to the market latest movements at first glance. The foundation of this swing calculation is in the count of candles in relation to the break-up and break-down of the price. When the price breaks-up the last maximum, the swing will get traced if a certain number of candles is exceeded from the last minimum. It can be used a "pure Gann" or not: If set

TeconLab Indicator User Guide Overview The TeconLab Indicator is a tool for MetaTrader 4 (MT4) users, fine-tuned to gather price information, including Date, Time, Open, High, Low, Close, and Volume, and update this data in real-time. Uniquely, this indicator autonomously refreshes the CSV file every minute or less, meaning there's no need for manual restarts—just activate it once, and it will continuously collect data as long as MT4 is running. It maintains the latest data according to the size

Are you a day/week/month trader, or even a quick scalper? MCTS will show you the best trending currencies to trade on any timeframe. By using a unique algorithm MCTS measures the strengths of individual currencies and then combines them into pairs to show you the best pairs to trade. Monitor all 8 major currencies and all 28 pairs. Monitors the strengths of the following currencies: EUR, USD, GBP, JPY, AUD, NZD, CHF, CAD. Measure the true strength of a currency on any timeframe. Know which curre

Ka Ching EA is a fully automatic robot that has the level of a professional trader. The robot uses a completely new and unknown strategy. During real trading, it does not look towards history and acts according to circumstances. The algorithm of the adviser is based on determining the strength of the market and the formation of pivot points. Orders are closed by Take Profit, Trailing or Stop Loss. Expert Advisor settings optimized for the Icmarket broker. Minor optimization of input parameter

If you like trading by candle patterns and want to reinforce this approach by modern technologies, this indicator and other related tools are for you. In fact, this indicator is a part of a toolbox, that includes a neural network engine implementing Self-Organizing Map (SOM) for candle patterns recognition, prediction, and provides you with an option to explore input and resulting data. The toolbox contains: SOMFX1Builder - a script for training neural networks; it builds a file with generalize
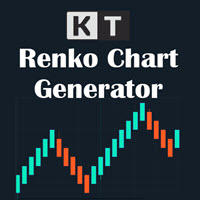
KT Renko Live Chart utility creates the Renko charts on MT4 that can be further used for speculation or live trading. The Renko chart created by this utility supports most of the custom indicators and automated Expert Advisors. Fully compatible with our Renko Patterns indicator and Renko Patterns EA . To use an Expert Advisor on the generated Renko chart, make sure to untick the "Offline Chart" in the chart properties.
Features
A simple and straightforward Renko utility that provides the Ren

This indicator is based on the Weis wave principle of wave volume. Below are few features of the indicator It draws the wave on the chart while the accumulated volume per wave in a different window at the bottom of the chart You can configure the turning point move It displays the accumulated volume (in thousands, eg for 15000 volume it will show 15) at the end of each wave You can also configure to show number of candles in the wave along with the wave volume The indicator calculates the distin
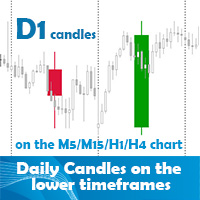
Daily candles on the lower timeframes indicator allows the user to display the daily timeframe on the lower timeframe chart. The indicator shows the daily candles on the chart from yesterday. It does not represent the today's daily candle. You can position and color the candles with or without price labels (High/Low/Open/Close of the day) and High/Low lines. It can help to see the bigger picture if you are a day trader or scalper. Obviously the best use is on the lower than daily timeframes. The
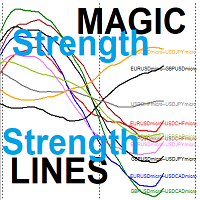
the MAGIC Smooth Strength lines for Currencies couples Each line represents the relative strength of two couples out of 5 user input symbols -> 10 indicator lines Your Strategy is based on selecting the weaker strength line and wait for a reversal sign OR Your Strategy is based on selecting the stronger strength line and wait for a reversal sign When reversal occurs you will trade on the two symbols represented by this line like the strength relative line for EURUSD and USDCAD when it is th

The main idea of this indicator is rates analysis and prediction by Fourier transform. The indicator decomposes exchange rates into main harmonics and calculates their product in future. The indicator shows 2 price marks in history, depicting price range in the past, and 2 price marks in future with price movement forecast. Buy or sell decision and take profit size are displayed in a text label in the indicator window. The indicator uses another indicator as an engine for calculations - FreqoMet
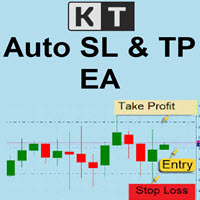
KT Auto SL TP automatically sets the stop-loss and take-profit as soon as it detects manually placed orders on the chart. It can effortlessly place the stop-loss and take profit for the market, limit and stop orders simultaneously.
Features
It can set the stop-loss and take-profit for all the active symbols from a single chart. Equipped with trailing stop-loss with steps. Seamlessly works for the market and pending orders. Shows the informational text information on the chart.
Inputs Cur

This Expert Advisor is a night scalper. It works at the end of the American session and at the beginning of the Asian session. The working timeframe is M15. It uses standard indicators for market entries and exits. Take profit and a protective stop loss are set for each order. However, orders are most often closed based on indicator signals. See the Comments page for ready .set files for traded currency pairs. The EA has an optional news filter which is based on a news indicator. IMPORTANT : Par
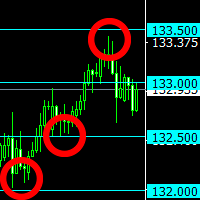
The indicator plots "round" levels, the step of which is specified in the settings.
Perfect as an addition to any trading systems.
Very low price - only $ 30! Round levels often become price support or resistance. MT5-version: https://www.mql5.com/en/market/product/67255
This allows you to either fix a profit, or open a position after a breakdown of the level, work towards a rebound in price. The indicator will be an excellent tool in a trader's arsenal!

Risk Calculator Pro is a simple and useful utility for MT4 to calculate your stop loss risk and open orders with accurate lot size . --- Contact me in messages for free gift after purchase! ---
How It Work?
Determine your entry price manually OR tick "current Price" . Determine your Stop Loss price. Determine your Risk Percentage (based on your account balance). Finally your Lot Size show on the green box. Advantage of Risk Calculator Pro: Simple & clean dashboard Diagnose wide SL & big r

The EA opens orders using the Wolfe waves indicator, also uses the Martingale and smart Trailing Stop, Stop Loss and Take Profit. Trades are always protected with STOPLOSS, Smart Trailing and Breakeven. This EA is easy to use. The EA has proven results on EURUSD M5, however you can change the settings for better results on other currencies.
Settings Setting EA - Settings of the Advisor. Invest More - at the value 'true' the lot size increases as the account balance grows.( Risk Management ). I

This indcator shows the trend with the color histogram. It is simple and easy to use. Usage: If the histogram changes from the aqua to the fuchsia, which means the trend is up. If the histogram changes from the fuchsia to the aqua,which means the trend is down. Inputs: MaPeriods: the periods of moving average. f1: the multiplier of inner bands f2: the multiplier of outer bands Popup Window Alert Email Alert Mobile Push Alert Alerts When the trend changes from the long trend to the short trend or

Description: The indicator predicts, with a specific probability, if the actual candlestick range will expand or contract compared to the range of a previous candle. Furthermore, the indicator shows the possible high or low of the actual candle, based on trend direction. (Recommended for Daily, Weekly, or Monthly timeframes).
KEY LINKS: Indicator Manual – How to Install – Frequent Questions - All Products How to use the indicator: Determines, with a certain probability, if there will

Download the free version here. Divergence Divergence refers to when the price of a currency pair moves in one direction while the trend indicator is moving in the opposite direction. With divergence, there can be positive and negative signals. Divergences in Forex trading are quite common signals of technical analysis. These are basic early Forex signals indicating the trend reversal and filter false signals. Application of this indicator It is usually not easy to detect divergences by the t
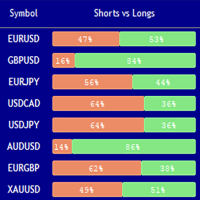
Market Sentiment Indicator Market Sentiment is a Trading Tool which allows you to see the positions of other currency traders. Until now, only institutional traders had access to such data which gave them a serious advantage over retail traders because of obvious reasons. With Market Sentiment, you too will finally know what other traders are doing which makes it easy to beat them on the forex battlefield.
Data comes from MyFxbook Community Outlook data feed and is based on up to 100 000 liv

MCAD stands for M ulti C urrency A ccumulation/ D istribution, so please don't confuse it with the well-known MACD. MCAD calculates relative strengths of Accumulation/Distribution of volumes for plain Forex currencies (that is their synthetic behaviour extracted from Forex pairs), market indices, CFDs and other groups of tickers. It uses standard Accumulation/Distribution formula ( Wikipedia's article ) and can apply it either to tick volumes, or to pseudo-real volumes ( volume surrogates , intr
Hello everyone!
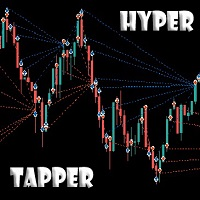
This Expert Advisor is developed based on hypertaping. Tick strategy, you won't be bored! The telegram group: https://t.me/FXAdvisorsMy Attention! Amazing results in a short trading period. Please pay attention to the increased risk, in order to trade it you need to have experience in trading with high leverage. The recommended minimum deposit is 2000 USD on a dollar account or 20 USD on a cent account. If you have any questions, do not hesitate to write to me.
This indicator computes Chaikin Money Flow (CMF) which is very useful to identify price trend. The indicator provides alerts when upper or lower levels (specified by user) are crossed by CMF. You can decide to receive a standard alert on MT4 and/or a push notification on your Metatrader app. You can configure the indicator by also specifying: • CMF periods • Levels at which the alert is provided
Link Telegram Channel for help settings

The Margin Level Notifier is a simple but a very useful and reliable Indicator which notifies you in case of a small Margin Level to avoid a sudden margin call and a risky high draw down. The Indicator does not trade, it is intended to monitors your account. Does the margin level of your drop under a preset minimal level, the Indicator sends immediately notifications per email, per push on your smartphone and per popup with audio alarm in your MetaTrader. The Indicator can be attached to any cha
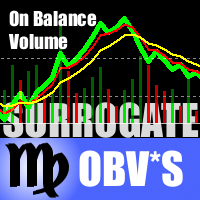
This is a special edition of the On-Balance Volume indicator based on pseudo-real volumes emulated from tick volumes. It calculates a near to real estimation of trade volumes distribution for Forex instruments (where only tick volumes are available) and then applies conventional OBV formula to them. Volumes are calculated by the same algorithm that's used in the indicator TrueVolumeSurrogate . The indicator itself is not required but can be used for reference.
Parameters MAfast - fast moving a

KT Heiken Ashi Alert plots the buy and sell arrows and generate alerts based on the standard Heiken Ashi candles. Its a must use tool for the traders who want to incorporate Heiken Ashi in their trading strategy. A buy arrow plotted when Heiken Ashi change to a bullish state from bearish state. A sell arrow plotted when Heiken Ashi change to a bearish state from bullish state. Mobile notifications, Email, Sound and Pop-up alerts included.
What exactly is Heiken Ashi? In Japanese, the term Hei

RSI strategies EA supports multiple RSI based strategies. Purchasing this EA can save you the time taken to automate your existing RSI strategy, through coding a custom EA and it also helps you discover profitable RSI strategies as its fully compatible with the strategy tester and all settings are editable. The EA supports both scalping, short term and long term strategies. The various supported settings are explained below: NOTE: The default settings in the EA are simply place holders. Before

I present an indicator for professionals. ProfitMACD is very similar to classic MACD in appearance and its functions . However, ProfitMACD is based on completely new algorithms (for example, it has only one averaging period) and is more robust, especially on small timeframes, since it filters random price walks. The classic MACD indicator (Moving Average Convergence / Divergence) is a very good indicator following the trend, based on the ratio between two moving averages, namely the EM

This intraday scalper Expert Advisor trades by capturing sharp jumps during a high market volatility. It can work both with market and pending orders. Most of the time, the EA is in standby mode, therefore do not expect fast results immediately. FIFO compliant. Only one market order can be opened on each symbol at a time. No martingale, no grid, no hedging Attention! This EA relies on the movement speed of the quotes, and requires a VPS server for stable operation. The recommended minimum deposi

KT Bollinger Bands Alert is a modified version of the classic Bollinger Bands added with price touch alerts and visible price tags for each band separately.
Alert Events
When the current price touches the upper Bollinger band. When the current price touches the middle Bollinger band. When the current price touches the lower Bollinger band.
Features Separate alert events for each band. Ability to specify a custom interval between each alert to prevent repetitive and annoying alerts. Added

Всем привет. Представляю Вашему вниманию Индикатор TRUE ATR для mt4 Так же есть данный индикатор для mt5 https://www.mql5.com/ru/market/product/82319 Данный индикатор работает на всех рынках. TRUE ATR высчитывает среднестатистическое движение инструмента за 1 день и показывает сколько в инструменте осталось энергии внутри дня. В отличие от классического индикатора АТР которые без разбора учитывает все бары(свечи), TRUE ATR при расчете среднестатистического движения инструмента исполь

MA Multi-Currencies Multi-Timeframes Histogram BUY/SELL Indicator up to 6 currencies on time calculations based on 6 time frames : M5, M15, M30, H1, H4, D1 Trading Strategies: **TREND shifts to UP trend when Green point appears after Red and Gray points -> Close SELL positions then add new BUY positions on new Green points **TREND shifts to DOWN trend when Red point appears after Green and Gray points -> Close BUY positions then add new SELL positions on new Red points ** Close BUY position

Recovery Bad Order MT4 (System to recovery lost trader whit recovery algorithm).
This system used algorithm in the ea for initial recovery algorithm, this system close one part of loses trader, whit algorithm recovery. (the lot recovery is a factor o lot used in the entry recommended used 0,1 for lot and 0,01 for recovery lot). https://youtu.be/FlpOhpiy7Pc Recovery Bad Order MT4 is an Expert Advisor for recovering losses of positions that were opened in the wrong direction (that were open
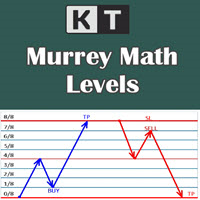
It shows the Murrey Math levels on chart and also provides an alert when price touch a particular level. T. Henning Murrey, in 1995, presented a trading system called Murrey Math Trading System, which is based on the observations made by W.D Gann.
Applications
For Murrey Math lovers, this is a must-have indicator in their arsenal. There is no need to be present on the screen all the time. Whenever the price touches a level, it will send an alert. Spot upcoming reversals in advance by specula

The script creates account summary report in a separate window. The report can be created for all deals and for deals on selected financial instruments.
It is possible to specify a time interval of calculation and save report to an htm file.
Script inputs
report starting date - initial report generation date. symbols selection for report - select a method of choosing tools for a report generation. allSymbol - report is generated for deals performed on all symbols. onlyCurrentSymbol - report

This is an advanced multi-timeframe version of the popular Hull Moving Average (HMA). Features Graphical panel with HMA indicator data from all timeframes at the same time . If the HMA has switched its direction on any timeframe, a question mark or exclamation mark is displayed on the panel, accompanied by a text and audio message. The messages can be configured separately for each timeframe using the corresponding checkboxes.
The indicator is located in a separate window, so as not to overloa

Bermaui Pin Bars
Or (BPB) is an indicator that finds Pin Bars price action pattern on the chart. Pin Bars is a shortcut for "Pinocchio Bars" which is a classic bar pattern alternative to Japanese candlesticks with tall upper or lower shadows and very small bodies like Hammer, Inverted-Hammer, Hanging Man, Shooting Star, Dragon Fly Doji or Grave Stone Doji. Bermaui Pin Bars indicator find this pattern depending on a formula that can be explained in the next steps:
At first BPB calculate the

Expert Advisor trading Moving Average and Stochastic strategy combined orders management. The EA uses Grid and Martingale . Default setting for USDCAD 15m / USDCHF 15m / GBPJPY 5m. Strategy working since 2010. Preferred trading account 10000 $. Works with high spread This EA operates only once per bar opening. Fast methods of strategy testing and optimization are valid. User can test / optimize by model: (control point) / (open prices only)
developed, tested and optimized on "
FREE

The initial price is 75 USD, the future price is 150 USD
The EA uses a reverse strategy. To detect trading signals, the following indicators are used: Moving Average, Relative Vigor Index, Average True Range, Alligator and other custom indicators . Each pair has a stop loss, take profit, breakeven and trailing stop. The EA trades on many major currency pairs and timeframes. The EA uses timeframes: MetaTrader 4 MetaTrader 5 M1, M5, M15, M30, H1 M1, M2, M3, M4, M5, M10, M12
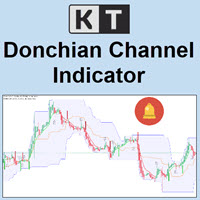
KT Donchian Channel is an advanced version of the famous Donchian channel first developed by Richard Donchian. It consists of three bands based on the moving average of last high and low prices. Upper Band: Highest price over last n period. Lower Band: Lowest price over last n period. Middle Band: The average of upper and lower band (Upper Band + Lower Band) / 2. Where n is 20 or a custom period value is chosen by the trader.
Features
A straightforward implementation of the Donchian channel
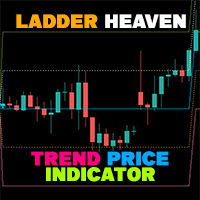
If you have difficulty determining the trend as well as entry points, stop loss points, and take profit points, "Ladder Heaven" will help you with that. The "Ladder Heaven" algorithm is operated on price depending on the parameters you input and will provide you with signals, trends, entry points, stop loss points, take profit points, support and resistance in the trend That direction.
Helps you easily identify trends, stop losses and take profits in your strategy!
MT5 Version: Click he
FREE

This EA allows you to send alerts to your Telegram Groups or Channels.
As simple as opening or closing trades on MT4 and alerts are automatically sent to Telegram.
Alerts will also be sent when you modify the SL or the TP
Updates and possible improvements will be sent to buyers
I will send you a tutorial to get your Telegram Api key and chat id
You must enter your API key and Chat ID of the Group or Channel
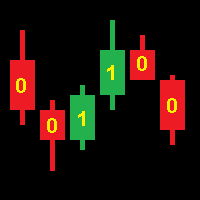
Operation of the CodEx 4 Expert Advisor is based on patterns composed of consecutive candles. Positions are closed when opposite signals appear. Sequences of candles are encoded into an integer according to the following rule. The code number must be converted to binary form and the highest bit must be discarded. The resulting sequence of bits encodes a continuous sequence of candles, where 1 is a bullish candle, 0 is a bearish candle. The higher bits encode the earlier candles. For example: 19[
FREE

** All Symbols x All Time frames scan just by pressing scanner button ** *** Contact me after the purchase to send you instructions and add you in "Order Block group" for sharing or seeing experiences with other users. Introduction: The central banks and financial institutions mainly drive the market, Order block is considered a market behavior that indicates accumulation of orders from banks and institutions, then the market tends to make a sharp move(Imbalance) on either side once the order bl

This indicator contains Pivot Levels of: Traditional Fibonacci Woodie Classic Demark Camarilla Calculation periods can be set to auto / Daily / Weekly / Monthly / Yearly. Number of Levels are editable. Options to hide level labels and price labels. Pivots Points are price levels chartists can use to determine intraday support and resistance levels. Pivot Points use the previous days Open, High, and Low to calculate a Pivot Point for the current day. Using this Pivot Point as the base, three resi
This indicator combines the best features of a trend indicator and an oscillator. Effective trend detection and short-term price fluctuations.
Operating principle: The indicator analyzes price direction using one of many standard oscillators. If the oscillator indicates a change in the direction of price movement, the indicator signals this by placing a small arrow on the chart opposite the bar on which the oscillator gave the corresponding signal. At the same time, the main signal of the indi
FREE

H I G H - P R O B A B I L I T Y - B R E A K O U T T R E N D L I N E I N D I C A T O R This is no ordinary trendline indicator. It has a highly-probability algorithms incorporated in the script to display only trendlines that may give a very high chance of price breakout. The indicator is not a stand alone indicator. Trader should interpret it together with their very own analysis technique to come up with a more efficient trading strategy. You can use with it other trend indic
FREE
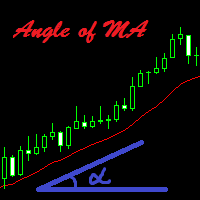
The indicator calculates the inclination angle of the Moving Average and displays the result on the screen. Users can select the start and end points to measure the inclination of the MA. It is also possible to set the angle value, and if the inclination angle exceeds the specified value, the indicator will play a sound alert and display a message on the screen.
Configurations Left_Shift_of_MA=1; - Shift of the MA to calculate the inclination angle (start point) Right_Shift_of_MA=0; - Shift of
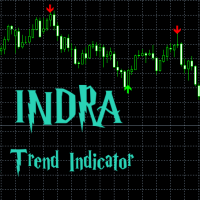
What is the INDRA Trend indicator? A INDRA Trend is a trend following indicator which give most accurate arrow signals of BUY and Sell based on the moving average , buying power and selling power in market, checking with other multiple indicators and providing the best possible time to get in to the market . This indicator is tested in multiple time frames as showed in screenshots it is also tested in multiple currency pairs , crypto and metal pairs such as USD/CAD EUR/JPY EUR/USD EUR/CHF US

The advisor NewsCatcher Free opens trades when the price makes a reversal move from support and resistance levels. Market entries should be confirmed by the Relative Strength Index (RSI). The RSI is implemented as a tachometer.
It is recommended to use this advisor in a highly volatile market after a political event or a release of major economic data.
You can use this advisor in the semi-automated mode (the RSI performs an information role) or in the fully automated mode (the RSI decides when
FREE
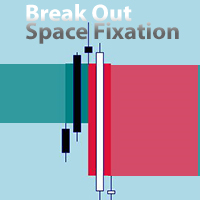
An EA version is being prepared. You can send a private message "notify about EA version".
EA will be versatile with many settings for trading on various indicators. The new EA will also allow trading on this indicator. For example, allowing signals after X signals/bars to X signals/bars in one direction, before changing direction. If Break Out happened before/after the signal of another indicator. Collect profit on each next signal above/below the previous one.
Send a private message "noti
FREE

This indicator shows us the trend or direction of the market and a possible stop loss
This indicator works with two parameters, period and multiplier. Buy and sell signals are generated when the indicator crosses the closing price and it changes color.
This indicator is used in all types of markets such as stocks, futures, forex, cryptos, additionally it can be used in different time periods: hours, daily, weekly, etc.
It is recommended not to use it while the market is sideways, this can
FREE
The MetaTrader Market is a simple and convenient site where developers can sell their trading applications.
We will help you post your product and explain you how to prepare your product description for the Market. All applications on the Market are encryption-protected and can only be run on a buyer's computer. Illegal copying is impossible.
You are missing trading opportunities:
- Free trading apps
- Over 8,000 signals for copying
- Economic news for exploring financial markets
Registration
Log in
If you do not have an account, please register
Allow the use of cookies to log in to the MQL5.com website.
Please enable the necessary setting in your browser, otherwise you will not be able to log in.