Watch the Market tutorial videos on YouTube
How to buy а trading robot or an indicator
Run your EA on
virtual hosting
virtual hosting
Test аn indicator/trading robot before buying
Want to earn in the Market?
How to present a product for a sell-through
Expert Advisors and Indicators for MetaTrader 4 - 50

This is a new strategy for SUPPLY DEMAND areas It is based on a calculation using the tick volume to detect the big price action in market for both bear /bull actions this smart volume action candles are used to determine the supply and demand areas prices in between main supply and demand lines indicate sideway market up arrows will be shown when prices moves above the main supply and the secondary supply lines Down arrows will be shown when prices moves below the main demand and the secondary

The Market Profile Indicator for MT4 displays the price levels and zones where increased trading activity happens. These zones with substantial forex trading activity provide the forex traders with the best entry levels, support, and resistance levels. Moreover, price levels indicate the best reversal zones. As a result, forex traders can identify BULLISH and BEARISH market trends and BUY and SELL entry points as well as the best reversal points. The indicator works well in all intraday timefram
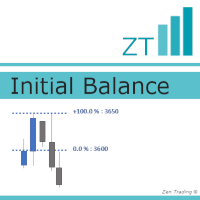
Initial Balance is a concept for the first hour of a trading session, lowest(starting) to highest point, that often determines important support / resistance for the next hours. It is based on Fibonacci levels and offers very relevant levels of reaction. Nowadays, it's mainly used for the first hour BEFORE the open. --------------- The advantage of this indicator lies here : - you could define by yourself the period for YOUR Initial Balance (first hour of a trading session, one hour before the o
Grid Trend Multiply is a non directional expert advisor which use Martingale to close trade in profit As a user, you need to set the direction in which the EA will take the trade. You can set to either BUY or SELL when you want it to trade in a trending market. In a ranging market, you can set the EA to take both BUY and SELL at the same time. It is a delta neutral strategy which capitalize on the concept that market will visit the same price again and again thus allowing the EA to close the po

Identify Engulfing candle pattern with Arrows & Alert ( built-in RSI filter). This indicator helps you to identify Engulfing candle pattern or Outside bar (OB) on the chart with arrows, along with an alert when a new Engulfing candle appears. Engulfing candle pattern is one of the most important reversal Price Action signals. You can choose between standard Engulfing (Engulfing based on candle body) or non standard Engulfing (Engulfing based on candle high - low )
Alerts can be turned on an

This is a pure grid strategy which completely works on pricelevel. So the idea behind this simple algo is when it starts it places 6 orders. Buy- Current price Sell- Current price BuyStop- Current price+ Some Pip Configurable distance Sell Limit - Current price+ Some Pip Configurable distance
BuyLimit- Current price- Some Pip Configurable distance SellStop - Current price- Some Pip Configurable distance
When any order hits its take profit it fill the gap with pending order. and When
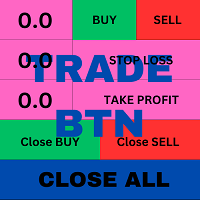
This is an ON CHART trade management panel. In other words, ON CHART Lot Size, Buy, Sell, Stop Loss, Take Profit, Close Buy, Close Sell and Close All buttons! *IMPORTANT NOTE: Input settings are NOT usable. You can change or insert Stop Loss and Take Profit values only on the chart panel. (See the below video!) This one is MT4 version!
BUTTONS List: 1. Lot Size - (0.01) is default click on it and insert the lot size with which you want to open a trade. 2. Stop Loss - (0.0) is default click on i
FREE

Expert Advisor for MT4 Useful utility MUST have for all traders. With 1 click button, you're able to close all your open positions. Its come with a warning pop up notification when you click to close all your trades, to avoid an accident press the button. Just press 'Yes' to confirm or 'No' to cancel it. The expert will close all your open positions no matter what pairs you currently open or directions. Just attach the expert on 1 of your chart, and you're good to go.

Whether you're a seasoned forex trader or just starting, Telegram Signal Sender is a must-have tool for anyone looking to start their telegram channel as a forex signal provider. With its user-friendly interface and advanced features, you can easily set up your signals and watch as your followers start to grow. So, what are you waiting for? Features: Highly customizable panel for calculating stop loss and take profit values User-friendly interface for easy setup of forex signals Ability to se

Introducing the SmartZone Reversal Master, a powerful indicator designed to assist traders in identifying potential trade entry points. This indicator utilizes the SMC concepts of liquidity engineering and higher resolution trend analysis to help traders make informed decisions.
By identifying institutional key levels in the market and monitoring price movements in relation to them around certain times of the day (ICT killzones) when volatility is higher, the SmartZone Reversal Master enhances
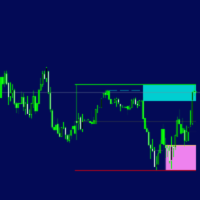
1. Updated usage descriptions in blog below: https://www.mql5.com/en/blogs/post/760322 Smart Market Structure Trading System and Automatic Scanner - Trading Systems - 13 October 2023 - Traders' Blogs (mql5.com) https://www.mql5.com/en/blogs/post/754495 2.1 YouTube video link for Panel control: https://youtu.be/LM699E7JS3E 2.2 YouTube video link for feature introduction: https://youtu.be/tMU04wo0bc8 2.3 All features can be turned on and off with a click of a button. 3. Smart Money Concepts,

up down stars indicator is no repaint indicator. it hold long way to signals. suitable all pairs and all timeframes. it needs at least 1000 bars on charts. 1 is critical level for signals. if red line reach 1 it gives red star to sell.. if blue line reach 1 it gives blue star to buy.. signals comes mostly exact time. sometimes lower timeframes it makes consecutive signals.
With this automatic trading software, the transaction is entered into when conditions comply with the rules of the algorithm (settings that can be changed by you). When a certain profit occurs, the system automatically takes profit and closes the transactions.
You can benefit from many unique features of the control panel. Detailed information about its use will be shared with people who purchase it.

Direct translation of blackcat's L3 Banker Fund Flow Trend Oscillator. Get push notifications on your phone app when a signal bar has formed. Historical signals are shown with buy/sell arrow right on the main chart. Indicator uses two data calculations to check for a cross below 25% level (a signal to go long) and above 75% level (a signal to short). For any further questions feel free to contact me directly. Including requests for product improvements.
Is Zero Lag profitable? Not always, different system is for different pairs. You can play around with this indicator from Mladen, I have modified it with Bollinger Bands over T3.
You can change the period and how it calculate. MT5 version is available too.... Please leave a review , it helps us and we will share more indicators. .... Thank you and happy trading
FREE
Volonacci Indicator It is an indicator that combines Fibonacci and volume to determine the price direction This indicator helps you identify Fibonacci angles according to the strategy The Volonacci indicator is indeed an interesting combination of Fibonacci levels and volume. This indicator uses Fibonacci tools to identify potential support and resistance levels, and enhances this by using volume to confirm the strength behind the price action.
MT5 Version https://www.mql5.com/en/market/produc

Introducing EMATrendForce: The Powerful EMA Trend Strategy EA Are you looking to take your trading to the next level? Look no further! The EMATrendForce EA is designed to help you harness the power of Exponential Moving Averages (EMA) with a dynamic trend-following strategy. Priced at only $65, this EA provides you with a solid foundation to optimize your trading strategy and make informed decisions in the market. Key Features: Fast and Slow EMA Strategy: The EA utilizes two EMAs (Fast and Slow
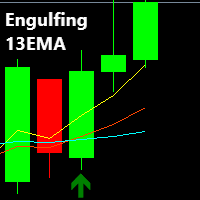
Description:
The Engulfing 13EMA is a Multi Timeframe Indicator that scans Multiple Symbols which will help you to identify potential trade set ups. As well as Forex, it can scan Crypto, Exotics, Metals, Indices, Energies or what ever else you have in your Market Watch list. You also have the option to enable/disable the time frames you want to scan. (M1,M5,M15,M30,H1,H4,D1,W1,MN1) All of these options are made possible from just ONE chart, from which the Indicator is attached
An alert is pre
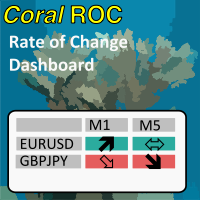
Coral Rate of Change Dashboard displays "rate of change" calculations across multiple symbols and timeframes simultaneously. See at a glance which pairs are moving, and how quickly. Receive alerts when any symbol + timeframe is experiencing very strong movement. You can display data for currency pairs, or for individual currencies (takes the average for each currency across all available pairs). See the CoralDash product description for the core functionality of the dashboard (symbol exposu

EMA Alert Pro v1.1
EMA Alert Pro warns you via sound and/or push notification in case the price approaches a given EMA of your choice. Drag & drop the EMA Alert Pro indicator to your chart. A small button will appear at the bottom-right corner of the screen. Turn it ON to trigger an alarm at the moment the price reaches the margin defined for your target EMA. While EMA Alert Pro is running, the button will inform about the difference in pips between current price and the target EMA.
- Specify

The indicator plots higher timeframe Kijun-sen (of Ichimoku ) on lower timeframes.
To change timeframes, in the timeframe field enter the number:
M1 PERIOD_M1 1 1 minute. M5 PERIOD_M5 5 5 minutes. M15 PERIOD_M15 15 15 minutes. M30 PERIOD_M30 30 30 minutes. H1 PERIOD_H1 60 1 hour. H4 PERIOD_H4 240 4 hour. D1 PERIOD_D1 1440 Daily. W1 PERIOD_W1 10080 Weekly. MN1 PERIOD_MN1 43200 Monthly.
By default, the Kijun is shifted 3 periods forward but if you wish to have it exactly as
---> Check all the other products <---
The Candle Bias is a coloring indicator that doesn't take account of the close price of the bars.
It will color the candle in the bearish color (of your choice) if the downard range is greater than the upward range. Conversely, it will color the candle in the bullish color of your choice if the upward range is greater than the downward range.
This is a major helper for Multi Time Frame analysis, it works on every security and every Time Frame. You ca

Trailing Step, Trailing Stop and Stop Loss as we used see how Pro traders used to make consistent profit. Traders who prefer the Stop Loss and Trailing Step trading style can use this EA to power their trading strategy and leverage from the movement of the price towards the Take Profit line with the continuous movement of the SL line. What is special about this EA is that it will immediately open the next trade in the opposite direction once the price hits SL. The EA has a built-in News Filter,
Stochastic Crossover Dashboard Pro uses the value of Stochastic indicator. The Stochastic's parameters can be adjusted via the Edit boxes of this dashboard. The monitoring pairs will be selected by adding to the Market Watch (no need to set prefixes or suffixes) , you can monitor many pairs as you like. This dashboard will check almost popular time frame (M1,M5,M15,M30,H1,H4 and D1). The colors can be customized. The parameters of Stochastic can be set at the input. Crossover signal can be sent
Spread Analysis Utility MT5 – Monitor & Analyze Broker Spreads in Real Time! Do you want to track your broker's spread fluctuations with precision? Spread Analysis Utility MT5 gives you real-time insights into the spread behavior of your broker, helping you assess trading conditions, detect unusual spread spikes, and make more informed trading decisions. What This Utility Does: Monitors live spreads and updates in real time Tracks the average spread over the last 100 data points Records the max

<LOGIC> Forex Robot EA VIX used VIX indicator.
The VIX Index is a calculation designed to produce a measure of constant, 30-day expected volatility of the U.S. stock market, derived from real-time, mid-quote prices of S&P 500 Index (SPX ) call and put options. On a global basis, it is one of the most recognized measures of volatility -- widely reported by financial media and closely followed by a variety of market participants as a daily market indicator. After entry is made with VIX index v
One of the basic needs of every trader is to have a checklist to enter every position. Of course, using pen and paper may not be convenient forever. With this indicator, you can have a small checklist next to the screen for each of your charts and use it for better use in your trades. MT5 Version This indicator will have many updates and special settings will be added to it.
You can contact us via Instagram, Telegram, WhatsApp, email or here. We are ready to answer you.
You can identify the strength of the main forex currencies with this tool. You can combine it with different styles and get the best strategy out of it. It has very high power. It can be customized.
MT5 version
This indicator will have many updates and special settings will be added to it.
You can contact us via Instagram, Telegram, WhatsApp, email or here. We are ready to answer you.
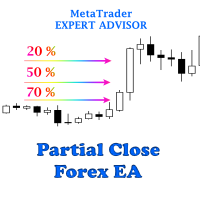
The easiest to use Partial Close Forex EA
How Partial Close EA works?
this is an automated MT4 EA to handle the management of trades for my system of “Take Profits”, “Stop Losses” and “Partial Closes”. The EA should be attached to each of trading charts. The EA can also be control via mobile MT4. When you place a market trade, the EA will setup a grid (hidden from broker) on the chart showing TP1, TP2, TP3 and SL (which can be seen). The SL will be based on the price you set on my mobile MT4
Time Line (Traders Club)
機能: 昨日高値、安値、本日始値、高値、安値の時間から線を引きます。 時間足により表示する時間が変わります。 1分、5分足では1時間ごとの表示 15分、30分足では4時間ごとの表示 1時間、4時間は12時間ごとの表示 日足以降は時間は表示されません。 高値安値は週足より下位足で表示されます。 各ラベルを変更可能になります。 更新頻度を変更できるのでチャート表示が 重くなることはありません。
各パラメータの説明: Difference hours form Server Time: サーバとの時間差を入力します。 Yesterday High Label:昨日高値のラベルを設定します。 Yesterday Low Label:昨日安値のラベルを設定します。 Show open line:true 始値の線を表示するかどうか Today Open Label:本日始値のラベルを設定します。 Today High Label:本日高値のラベルを設定します。 Today Low Label:本日安値のラベルを設定します。 Lim
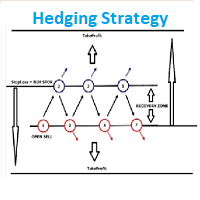
EA Hedging Strategy Is a high class automated expert advisor which is fully optimized for the future market in EURUSD etc. M5. No Loss forex Hedging Strategy and work with the open orders and open position orders to get opportunities to enter and exit trading.
ADVANTAGES: Advanced market entry filter. Automatic Money manager. High spread protection. Slip Protection. Does not use indicator.
Trailing stop and Take Profit.
No need for optimization.
RECOMMENDATIONS: leverage: 1:500!, working

Use this EA on your Prop Firm challenge to pass with a copy trader. Introducing Prop Firm Killer . This powerful EA is designed to help traders conquer the challenges of prop firms and achieve substantial growth in their trading accounts. It utilizes a Pending Position strategy combined with an advanced and secretive trading algorithm, making it a force to be reckoned with in the market. The strategy employed by Prop Firm Kille r incorporates a unique custom indicator, Trendlines, Support & Resi

Supply and Demand Indicator + FREE Currency Strength Meter ADD-ON Looking for a powerful tool that can help you identify the most reactive zones in the forex market? Our supply and demand indicator for MetaTrader 4 and 5 is exactly what you need. With its advanced algorithms and real-time analysis, this indicator helps traders of all experience levels make informed trading decisions. The supply and demand indicator is a cutting-edge tool that helps traders identify areas where buyers and seller
Draw On 1 Timeframe: Does exactly what the name says! When you draw a rectangle or trendline - the timeframe you draw it in, is the one it is visible. When you look at a higher or lower timeframe - the drawn object is not seen, but when you change back to the timeframe you originally draw in - the object can be seen. How to use it: This is an indicator that interacts with all trendline or rectangle objects drawn. Once running - it will automatically make any drawn trendline or rectangle objec
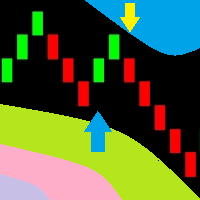
You can now use the conventional price charts to display Renko bars. This indicator can send dialog boxes with alerts, push notifications to mobile devices and emails. You can easily use this indicator to create Expert Advisors, because the indicator uses buffers.
Indicator parameters Renko size, points - size of Renko bars Arrows gap, points - distance to the signal arrows Alerts - true/false - use pop-up alerts when signals appear Push notifications - send Push notifications to the mobile ter

Volume DeltaPanel is a very powerful indicator that read the supply on Market. It calculates the Delta from movement of the price and the difference of BUY volumes and SELL volumes. The Volumes are added to price and normalized to symbol points.
Its special structure allows you to get all Time Frames values available on the platform MT4. Panel can show 28 instruments simultaneously all customizable according to the offer of the Broker. A good observation of this instrument can suggest great ent

Tired of plotting trendlines? The PZ TrendLines indicator applies a mechanical approach to the construction of trend lines for you! [ Installation Guide | Update Guide | Troubleshooting | FAQ | All Products ] It can draw up to 18 trendlines Trendlines can be optionally based on fractals Each line represents a breakout level Each trendline can be broken or rejected Configurable amount of lines Configurable colors
Author Arturo López Pérez, private investor and speculator, software engineer and

Do you need to check support and resistance lines? Do you need to find them really fast and automatically? Do you want to set your own settings how to find them? Indicator Lines is developed for finding support and resistance lines on chart. It does its job quickly and fully automatically. Main principle of algorithm is to get all extremes on chart (according to "Density" parameter). Then indicator tries to find minimally 3 points (according to "Minimal count of points" parameter) which can be u

Undefeated trend indicator, an indicator that uses MacD and Bollinger bands. It is a coded indicator to find trends. It finds these trends by its own algorithm. This indicator requires visual monitoring. It does not give any warning because it needs visual follow-up. The main trendline should turn down to find the down trend. The main trend line should go under the white line and then go under the yellow line. The main trendline should turn upward to find the upward trend. The main trend line sh

The principle of the indicator. The StatChannel ( SC ) indicator is a development of the Bollinger Bands indicator ( ВВ ). BB is a moving average, on both sides of which two lines are drawn, separated from it by standard deviations std multiplied by the corresponding coefficient. At the same time, a moving average with an averaging period (2n + 1) bars is always obtained lagging behind n bars. Sliding std is also lagging behind on n bars, also calculated by (2n + 1) points. Such
Concept Mean reversion is a concept in trading based on prices eventually returning to their mean or average level after a period of divergence or departure from the historical mean. Traders deploying mean reversion techniques typically wait for assets to diverge significantly from their mean values and then place trades on the assumption the price will return to the mean at some point in the future- this is also known as re-coupling or convergence. There are several mean reversion based trading
Indicator Description: Profit & Loss Tracker
This indicator helps you monitor your trading profits and losses in real time, making it easier to keep track of your trading performance. It organizes information in different ways so you can see exactly how your trades are doing. Here’s what it can do:
1. **Total Profit and Loss**: - Shows your total profit and loss for all open and closed trades.
2. **Profit and Loss in Pips**: - Displays your profit and loss in pips, so you can see market
The Stochastic Multicurrency Scanner Dashboard MT4 is a powerful tool for monitoring multiple currency pairs and timeframes using the Stochastic oscillator. It organizes signals in a grid format, displaying each symbol’s status across timeframes from M1 to MN1. Traders can enable or disable specific timeframes to suit their strategies. You can find the MT5 version here Stochastic Oscillator Multicurrenty Scanner MT4 For detailed documentation click here Stochastic Oscillator Integration: Th

Dual Super Trend Channel - Индикатор канала, целью которого является нахождение правильных уровней поддержки и сопротивления. За основу при разработке индикатора брались положения Теории Ганна. Прекрасно подходит как для начинающих, так и для профессиональных трейдеров. Рекомендуемый таймфрейм - H1, H4, D1. Рекомендуемые валютные пары: Мультивалютный. Работает как на 4-х, так и на 5-и значных котировках.

Use with disciplined risk management. Fibonacci entry system based on the golden zone 38.2 - 61.8 where the entry is confirmed at 23.6 with indications of Take Profit 3:1. Automatically plotted Fibonacci contains retracement and expansion Fibonacci in a single indicator. Up to 77% win rate with this system. FTMO challenge pass with 0.50% risk and 1.50% R:R.

Market Structure MTF Dashboard Alerts: Is an fast way of checking the currently market structure on 4 timeframes! It lets you know if you are trading in the direction of both long-term and shor-term market bias. It is setup to track the High and Low positions to determine the current bias. Once the bias is shifting on the any of the 4 timeframes - you have the option to have an alarm notify you of the change. Once the alarm has gone off - you will be able to see a break of structure (BOS) form

A indicator to show saturation in buying or selling With fast and complex mathematical calculations Easily find saturation points for buying or selling Can be used in all symbols and time frames with many signals Can be combined with different indicators and different time frames With simple settings and simple working methods
Features: Can be used on all symbols Can be used in all time frames Can be used in all markets (Forex, stock, etc.) Large number of signals Same performance on all time
This is a fully multi timeframe version of the Moving average standard indicator, which works for any combination of timeframes. The indicator allows quickly and effortlessly viewing the charts from different timeframes at the same time. You can create and set of intervals and freely switch to a higher or lower one. At the same time, the selected charts will always be displayed in a correct time scale. The interaction of the short-term and long-term trends will be clearly visible, and it will al
The Moving Average Multicurrency Scanner Dashboard MT4 is a powerful trading tool designed to monitor multiple currency pairs and timeframes using customizable moving averages. It organizes signals in a grid format, displaying each symbol’s status across timeframes from M1 to MN1. Traders can enable or disable specific timeframes to align with their strategies. You can find the MT5 version here Moving Average Multicurrency Scanner MT5 For detailed documentation click here Moving Average Integ
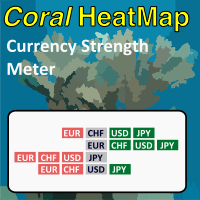
Coral Heatmap is a currency strength meter based on the ATR values for the selected timeframe. There are two main view modes: All Currencies (default) - see the ranked strength of all currencies in a single view Selected Currency - see the relative strength of all other currencies compared to a selected currency You can optionally display the timeframe selection toolbar; timeframe is always synchronized to the current chart timeframe. Use keyboard shortcuts to quickly navigate currencies (up/d

IBB Candles is a tool that is based on the concept of Inverse Bollinger Bands. It compares price relative to state of the bands and plots candles with different colors defining the current state of the market i.e range | trend | strong trend. As the name suggests IBB(Inverse Bollinger Bands) is a technique which is completely different from the traditional Bollinger Bands and proves to be much more effective in analyzing market. This personal implementation makes this tool a more reliable option

Every trader knows that he or she should never Risk more than 2% (or 5%) per trade. This is a Money Management law and an usable LotSize should be calculated each time because a trader must use a different StopLoss value for different Support and Resistant level. This indicator will calculate an appropriate LotSize for the moment when you will put it on the chart and each time you will drag the "Stop Loss Line" in any direction.
Inputs: Order_Type - Buy or Sell TakeProfitPoints - how many po

MT5 Version Kill Zones
Kill Zones allows you to insert up to 3 time zones in the chart. The visual representation of the Kill Zones in the chart together with an alert and notification system helps you to ignore fake trading setups occurring outside the Kill Zones or specific trading sessions. Using Kill Zones in your trading will help you filter higher probability trading setups. You should select time ranges where the market usually reacts with high volatility. Based on EST time zone, followin

------ GOOD LUCK -----
(Telegram: @MagicBinary) The indicator allows you to trade binary options. T his indicator give high winning ratio with over 20 years of backtesting The recommended time frame is М1 and the expiration time is 3, 5 minutes. The indicator suitable for Auto and Manual trading. A possible signal is specified as a arrows above/under a candle. You can entry current candle /intrabar or can wait until candle close Arrows are not re-painted Trade sessions: Any/ Rec

Welcome to the world of SMC (Smart Money Concepts) Trading, where we empower traders with the tools and knowledge to make smarter trading decisions. Our latest addition to our suite of trading tools is the SMC Trading Pro indicator, version 1.0. Key Features: Major Market Structure Identification with BODY break. Order Block must be in Major Swing ( not Small Swing ). Order Block with Fair Value Gap Detection. Order Block in Discount | Premium zone. Filter for only Bullish, Bearish or All Order

Stochastic Strategy EA MT4
an advanced tool designed exclusively for MetaTrader 4. This expert advisor streamlines trading activities by harnessing the power of the Stochastic indicator, automating trade entries and exits based on overbought and oversold conditions. The EA also facilitates reverse trading setups within these zones, offering a versatile approach to managing trades. For detailed documentation General Settings/Input Guide | Indicator Settings/Input Guide | Backtests and S
Check My Product
Contact me to discover all my services
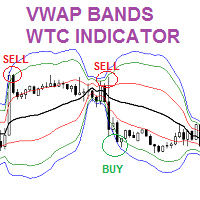
The VWAP Volume weighted Average Price Bands indicator is similar to the Moving Averages and Bollinger bands. In this indicator, more weight is given to the volume. The indicator provides great insight on support and resistance levels in the chart. Moreover, the indicator shows the fair value of a trading instrument. Thus, enabling forex traders to identify great trading opportunities to BUY LOW and SELL HIGH. Forex traders can combine t
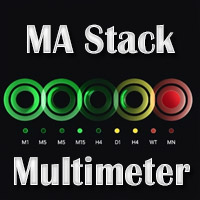
Basic MA Stack Indicator: This is a single timeframe & single currency indicator. It looks at MAs and show 3 possible states on chart: When all MA Align Upwards: Stack Up When all MA Align Downwards: Stack Down If MAs not aligned: Stack None Available for free here: https://www.mql5.com/en/market/product/69539
You can position the small block on your chart. And get current status of the Stack. It is simplistic and very eash to use and can guide you to find good trends in your strategies. Buy St
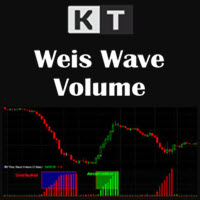
The KT Weis Wave Volume is a technical indicator based on the current market trend and description of the price movement's direction. The indicator is based on volume and displays the cumulative volumes for price increases and decreases in the price chart.
In addition, the indicator window shows a histogram of green and rising red waves.
The green color represents upward movement; the more the price rises, the larger the green volume. The red color represents a decreasing wave; the larger the
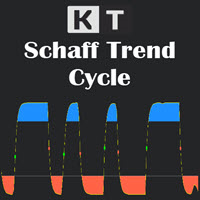
The Schaff Trend Cycle (STC) is a technical analysis tool that helps traders and investors plot highly-probable predictions on the price direction of an instrument. Due to its predictive properties, It's a good tool for foreign exchange (forex) traders to plot buy and sell signals. The Schaff Trend Cycle was developed by prominent forex trader and analyst Doug Schaff in 1999. The idea driving the STC is the proven narrative that market trends rise or fall in cyclical patterns across all time fr
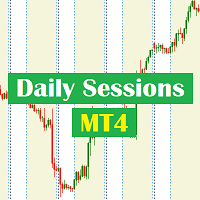
Daily Sessions utility is the best tool to highlight trading sessions , the trader can set any starting hour and ending hour to mark his trading session. Main features :
Customizable session time. Customizable Colors. Customizable vertical lines for the start and end of sessions
Set as many sessions as you want by simply plotting the indicator and changing the Indicator ID.
The KT Buy Sell Volume is a powerful tool traders use to gauge the strength and weakness of price movements. In the whirlwind of the Forex market, traders aim to identify and ride the waves of a bullish or bearish trend that exudes strength and potential. However, recognizing these trends necessitates a method, metric, or indicator to quantify their strength. One crucial factor that traders examine for this purpose is volume. Volume refers to the number of shares or contracts traded in a securit

*This is tradingview bot converted to mql4*
The UT Bot Alert Indicator is an advanced technical analysis tool designed to help traders optimize their trading performance. This innovative indicator is based on the proven UT Bot system, which utilizes multiple indicators to deliver accurate signals that can help traders make better decisions. The UT Bot Alert Indicator provides a range of features that can help you stay on top of market trends and capitalize on opportunities. Here are some of its
MultiTimeframe (MTF) Support and Resistance Indicator is use to measure last 320 bar (user input) of support and resistance of the dedicated timeframe. User can attached this indicator to any desire timeframe.
Features: User input desire timeframe (default Period H4) User input numbers of last bars (default 320 bars) User input measurement of last HH and LL (default 10 bars) Line styling and colors. MT5 version: https://www.mql5.com/en/market/product/31983

Investment Castle Legacy Expert Advisor is a trend-based Expert Advisor that uses a built-in Investment Castle indicator & Manual Buy / Sell Zones. Investment Castle Legacy EA has the following features: Volatility Index Integration for automating the Distance Reversed Martingale Strategy Auto enable / disable before the News and set the resumption after the news with option to stop and recover. Manual orders to contribute to the open series. If there are two series, the one in higher loss

Introducing the Investment Castle Expert Advisor - the ultimate trend-based trading tool that comes with built-in Investment Castle and Psychological Key Levels indicators. Whether you're a novice or a seasoned trader, this powerful tool will help you make informed decisions and maximize profits. Features: Automated Support and Resistance Key Levels: Say goodbye to manual chart analysis! Our AI-driven software automatically identifies key levels of support and resistance, allowing you to make s

Keep sleeping while your EA does his job! Keep Sleeping EA - is an expert advisor which trades at night. It uses calm but more predictable night time for achieving stable profits. It is recommended to use the EA on a number of instruments simultaneously. This will allow to raise profit and make profit curve smoother. EA's setup guide - https://www.mql5.com/en/blogs/post/746449 What you need to know before buy The EA trades at night (usually from 22:00 to 3:00 GMT+2(+3))
Small prof

Infinity Indicator MT4 3.3 Panel Win Rate based on CandleMT4 Exit Button Calculates the StdDev standard deviation indicator on the RSI data, stored in the matrix similar to the keltner. input int HourCalculate = 12; RsiLength = 5; RsiPrice = PRICE_CLOSE; HalfLength = 4; DevPeriod = 100; Deviations = 0.9; UseAlert = true; DrawArrows = true; TimerWork=300; LevelUp = 80; LevelDown = 20; MoreSignals = true;
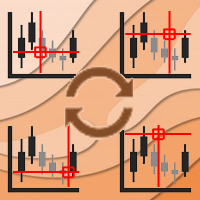
Async Charts is an indicator to synchronize charts and display a customized crosshair (cursor) on all selected charts. This is a useful utility for traders using multiple timeframes of analyzing multiple symbols for trade entry or exit.
Main Features : Real time Crosshair Synchronization on All Selected Charts
Supports Multiple Timeframes and Multiple Symbols at the same time
Auto Scroll Option
Graphical Adjustment of Color, Font, Size, ...
Locking All or Locking Specific Charts
More and More .
MT Moving Average
MT Moving Average is an easy to use multi time frame moving average indicator. It shows moving averages (SMA or EMA) of current symbol from all time frames (higher and lower). No need to switch between time frames anymore. With help of the indicator panel you can select which timeframe should be shown on the chart. I.e. your current timeframe is M5 and you can turn on M15 to see the the moving average of period M15. Indicator settings
Dark interface --> Set to true to use dark
Do you know why the MetaTrader Market is the best place to sell trading strategies and technical indicators? No need for advertising or software protection, no payment troubles. Everything is provided in the MetaTrader Market.
You are missing trading opportunities:
- Free trading apps
- Over 8,000 signals for copying
- Economic news for exploring financial markets
Registration
Log in
If you do not have an account, please register
Allow the use of cookies to log in to the MQL5.com website.
Please enable the necessary setting in your browser, otherwise you will not be able to log in.