Watch the Market tutorial videos on YouTube
How to buy а trading robot or an indicator
Run your EA on
virtual hosting
virtual hosting
Test аn indicator/trading robot before buying
Want to earn in the Market?
How to present a product for a sell-through
Expert Advisors and Indicators for MetaTrader 4 - 56
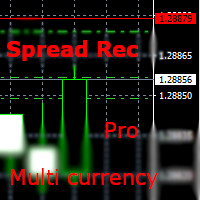
With this EA you are able to record the spread of any currency pair you place in the input parameter. Just drag and drop the EA to one currency. You can record all currencies from ONE chart. There is no need to open multiple charts! But fill the market watch with all specified symbols! Double click on the background of the panel. So you can move it to another position. parameters: RunEA >>> Rec yes/no right from the beginning Export Folder Export Filename Appendix >>> None / Date / Day of Week U
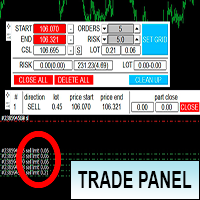
Торговая панель предназначена для установки сетки ордеров с различными параметрами на основных FOREX валютных парах. Панель не предназначена для торговли фьючерсов, золота, нефти и других подобных инструментов! Только для валютных пар. Имеет несколько основных функций по установке ордеров в заданном диапазоне и с заданным риском, закрытию части ордеров из сетки, переносом в безубыток, закрытие части по профиту на определённом уровне, а также отображает информацию по текущему риску и отображае
Check My Product
Contact me to discover all my services
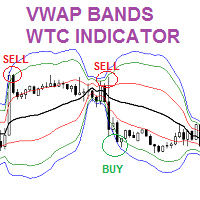
The VWAP Volume weighted Average Price Bands indicator is similar to the Moving Averages and Bollinger bands. In this indicator, more weight is given to the volume. The indicator provides great insight on support and resistance levels in the chart. Moreover, the indicator shows the fair value of a trading instrument. Thus, enabling forex traders to identify great trading opportunities to BUY LOW and SELL HIGH. Forex traders can combine

MetaCOT 2 is a set of indicators and specialized utilities for the analysis of the U.S. Commodity Futures Trading Commission reports. Thanks to the reports issued by the Commission, it is possible to analyze the size and direction of the positions of the major market participants, which brings the long-term price prediction accuracy to a new higher-quality level, inaccessible to most traders. These indicators, related to the fundamental analysis, can also be used as an effective long-term filter

KT Fractal Channel Breakout draws a continuous channel by connecting the successive Up and Down fractals. It provides alerts and also plots the Up and Down arrows representing the bullish and bearish breakout of the fractal channel.
Features
If you use Bill Williams fractals in your technical analysis, you must also include it in your trading arsenal. It can be very effective and useful for stop-loss trailing. A new market trend often emerges after a fractal channel breakout in a new directi

This indicator is designed to make reviews of many charts on different timescales quicker, and easier to do. Track Time and Price across multiple charts Change Symbol on one chart and all other charts of the same symbol will be changed too. Easy to use, quick to master The indicator allows you to identify the price and time where the mouse pointer is on the current chart, across all other charts open on the same Symbol. This allows you to quickly see information on multiple charts whereas normal

1分足から使える高精度のスキャルピング用逆張りサインツールです。
・すべての通貨ペア、時間足で利用でき、絶好のタイミングでのエントリー・チャンスをお知らせします ・ ボリンジャーバンドにタッチしてからの反転を 基本戦略とし、 独自のアルゴリズムを加えることで、精度の高い反転ポイントでサインを発信します ・勝敗判定機能により 直近の相場環境に対するこのインディケータの有用性を確認することができます ・ 初心者から上級者まで設定不要ですぐにお使いいただけます ・本サインツールの性能を確認いただくための専用EAを提供いたします。コメント欄をご覧ください
1分足での使用にも耐えるので、トレード頻度を高めることができます。またより高い時間足での使用では精度の向上が期待できます。トレンド・フィルターの機能を利用することで、トレンド方向での押し目買い、戻り売りに際し最適なタイミングでトレードすることができます。
設定項目は以下の通りです。 Bollinger Bands Period
Bollinger Bands Deviation
Bollinger Bands Shift

Tax Buddy creates a simple, sortable trading report which you can send to your local tax authorities alongside your annual declaration. I've been using this kind of report for the German Finanzamt in order to declare my capital gains ("Kapitalerträge") in a readily comprehensible manner. For testing purposes, the Demo version places random trades in the Strategy Tester on the symbol of your choice and creates a demo report for them.
Conveniently, all reports are stored in the common path for a
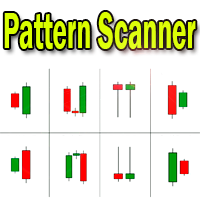
Candlestick pattern indicator - display found candlestick patterns on the chart. MT5-version: https://www.mql5.com/en/market/product/103134 Bearish patterns: Bearish Pattern Designations Pattern name SS
Shooting Star STR(S) Evening Star DJ(E) Evening Doji Star DC Dark Cloud Veil BEP Bearish Engulfing Bullish patterns: Designation of bullish patterns Pattern name HMR
Hammer pattern
STR(M) Morning Star DJ(M) Morning Doji Star PRL Piercing Line BEP Bulli
Hola Traders. Lot - lot size for pending orders. Martingale - double lot size of pending orders. *(No Martingale = 1.00) TotalGridEachSide - unit each side of pending orders. SpaceOfFirstOrder - distance for the first order in points. Take Profit - profit in points. Stop Loss - loss in points. The entire positioning uses POINTS only. (10 point = 1 pip)
and you can open order BUYSTOP, SELLSTOP, ALLBUYANDSELL you can Close Pending, Close orders Profit and Loss and Close All *** ideas for using

First of all, it is worth highlighting here that this Trading Indicator is Non Repainting, Non Redrawing and Non Lagging, which makes it ideal for manual trading. Never repaint and recalculate Once an arrow appears it never disappears, the signal comes at the opening of the new candle You will now be more profitable with this indicator The indicator will alert you when an arrow appears You can do swing trading or scalping trading The indicator helps you identify the trend Can be optimized acros

MetaCOT 2 is a set of indicators and specialized utilities for the analysis of the U.S. Commodity Futures Trading Commission reports. Thanks to the reports issued by the Commission, it is possible to analyze the size and direction of the positions of the major market participants, which brings the long-term price prediction accuracy to a new higher-quality level, inaccessible to most traders. These indicators, related to the fundamental analysis, can also be used as an effective long-term filter

Introducing the uGenesys Psychological Levels Indicator – Your Key to Precision Trading with Real-Time Alerts! Are you tired of guessing where the market might turn? Do you want a tool that can accurately identify psychological levels and notify you when price touches a key level? Look no further – the uGenesys Psychological Levels Indicator is here to revolutionize your trading experience. Imagine having a tool that not only identifies psychological levels with unmatched accuracy but also aler

"Awesome Market Prediction" is a revolutionary indicator designed to provide accurate and sophisticated market predictions to traders. Developed with cutting-edge technology and intelligent algorithms, this indicator offers deep insights into future market movements. Key features of "Awesome Market Prediction" include: High Accuracy Predictions : Utilizing in-depth data analysis and advanced prediction techniques, this indicator delivers highly accurate estimates of market direction. Multiple Ma

Gold Trend Following Expert Advisor (EA) is a sophisticated, fully-automated trading algorithm designed to maximize profitability in the gold market (XAUUSD). Optimized for a 1-minute timeframe, this EA is perfect for high-frequency traders and those who prefer to automate their trading activities. This EA implements a robust trend-following strategy, combining multiple technical indicators to make informed trading decisions. It utilizes the Moving Average Convergence Divergence (MACD), Exponent

This utility ensures a real-time synchronization of multiple charts. Any event of a graphical object creation/modification/deletion, chart scrolling and zooming is copied from the current source chart to one or more receiving charts. Note: demo-version of this product doesn't work in the backtester! ______________________________________________________________ Settings: Synchronize with - select the receivers: Same symbol - all charts with the same symbol; Same symbol - all charts with the same

EA Black Wolf initiate a cycle of buy or sell depending of the trend of a built-in indicator, thus the EA works according to the "Trend Follow" strategy, which means following the trend. Recommend pairs EURUSD,GBP USD, EURAUD,AUDJPY,GBPAUD,CADJPY
Time Frame M15
Recommend deposit 1000 usd or 1000 cents Recommend settings Default SETTINGS Lot type - lot type calculation (can be Constant, based on risk or Constant size per 1000) Lot size - lot size Trade Buy - allow the adviser to buy Trad

Product Name: BicsOut - The Ultimate MT4 Breakout Indicator Introducing BicsOut, the indispensable tool for MT4 traders seeking precision in detecting breakouts across any currency pairs. BicsOut is meticulously designed to streamline your trading experience, providing automatic identification of breakout opportunities coupled with seamless entry and exit point calculations. Features: Breakout Detection: BicsOut excels in swiftly pinpointing breakout moments, enabling traders to capitalize on ma

"BUYUK SAVDOGAR" TM has developed this strategy to support all who trade binary options. If you trade binary options, try this trading system. Most users report good results. The trading system is based on the best algorithm. The trading system helps to determine the market situation by volume. Loss of interest in one direction or another to the current price affects the further price movement. It is impossible to detect this information with the human eye. The numbers below the candle help us d
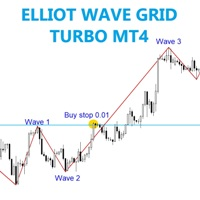
The EA trades will pending order when break price of wave 1 and run wave 3 . Best time frame 1h , Any pair any broker no limited, recommend minimum deposit 500$
SETTING Symbole - Set symbol to trade. Wave_depth - Set the wave size. Wave_deviation - Set wide of the wave. Lots - start lot. Multiple_lots - Multiply lot for next order. Max_lots - maximum lot. Grid_boost - Frequency of opening position (Less more order). Grid_minimum_pips - Check distance grid from last order. TP_pips - take
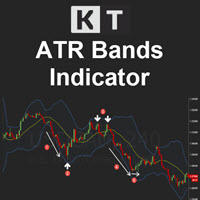
KT ATR Bands draws the volatility envelops and bands using a combination of Average True Range and Moving average. They are typically used to identify the potential reversal points and the periods of high and low volatility.
Features
Multi-Timeframe Ability: For example, you can have the atr bands from the daily timeframe on the H1 timeframe. Smart Alerts: You can turn on/off alerts for each band separately. Also, you can choose a minimum time interval between each alert to stop unnecessary,
This indicator (translated from the Japanese source) automatically identifies authentic Japanese candlepatterns (Japanese Sakata Gohou rules) and displays with arrows the following Japanese candlestick patterns:
BEARISH AND BULLISH ENGULFING CANDLES (known as Tsutsumi in Japanese) BULLISH THREE WHITE SOLDIERS BEARISH THREE BLACK CROWS BEARISH EVENING STARS BULLISH MORNING STARS THREE LINES THREE INSIDE DOWN (marks with a box) THREE INSIDE UP (marks with a box)
You can switch off or on to hav

Welcome to the world of advanced trading with the RSI Multicurrency Scanner! Maximize your trading experience with our powerful MT4 indicator designed for seamless analysis and real-time insights. Key Features: Effortless RSI Scanning: Unlock the full potential of the RSI Multicurrency Scanner by effortlessly scanning multiple currency pairs. Receive instant alerts when specific Relative Strength Index (RSI) conditions are met, ensuring you stay ahead of market movements. Comprehensive Dashboar

Short Term Scalper EA is an Expert Advisor works in the short-term direction and always uses a tight stop loss invisible to the broker. Only one order per currency pair can be opened at a time. When the short-term trend changes, the EA changes the type of the pending order, deletes the old one and places a new order. The pending order follows the price in anticipation of when the market begins its short-term movement. This scalper does not work in a flat, therefore it should be used on highly v
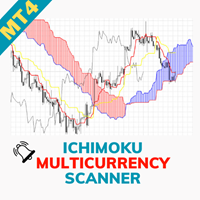
Welcome to the world of advanced trading with the Ichimoku Multicurrency Scanner! Maximize your trading experience with our powerful MT4 indicator designed for seamless analysis and real-time insights. Key Features: Effortless Ichimoku Scanning: Unlock the full potential of the Ichimoku Multicurrency Scanner by effortlessly scanning multiple currency pairs. Receive instant alerts when specific Ichimoku Cloud conditions are met, ensuring you stay ahead of market movements. Comprehensive Dashboar

The GGP Chandelier Exit Alert MT4 Indicator is a volatility-based indicator that identifies stop loss exit points for long and short trading positions. Chandelier Exit is based on the Average True Range (ATR) indicator. It is designed to keep traders in the trend until a defined trend reversal happens. Traders use CE to maximize their returns in a trade and make stop loss exit decisions. It is based on the principle that a trend reversal is highly probable when the price of an asset moves ag

Interceptor - professional volume and price extremes indicator. Interceptor is a powerful indicator, which thanks to a combination of four different types of normalized indicators in one algorithm can correctly identify extremes of the price leading to retracements and reversals in the trend. Algorithm is based mainly on combination of Accumulation/Distribution , On Balance Volume , Money Flow Index and Relative Strength Index . The first parameter of Interceptor is Interceptor_Depth which defin

This indicator is another variant of the famous powerful indicator Fibonacci-SS https://www.mql5.com/en/market/product/10136 but has different behaviour in placing Pending Order and TP Line. Automatically places Fibonacci retracement lines from the last highest and lowest visible bars on the chart with: An auto Pending Order (Buy/Sell). Taking Profit 1, Taking Profit 2 is pivot point and Taking Profit 3 for extended reward opportunity. The best risk and reward ratio.
Simple and powerful indica

Renko Trade Alarm is designed to work on chart with Renko and Mean Renko candles. It generate B uy and S ell signals on the chart and send notifications. Visualization of signals: Swing - Formations 123. Pattern - Double Bottom, Double Top, Triple Bottom, Triple Top, Formations 123 Reverse. Scalp - Periodic change in the price direction, plus additional filters in the form of oscillators Stochastic and MACD. Ichi - Signals filtered by the Ichimoku indicator. For correct operation an offl
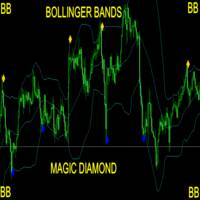
Take Your Trading Experience To the Next Level ! and get the Magic Bollinger Bands Diamond Indicator MagicBB Diamond Indicator is MT4 Indicator which can suggest signals for you while on MT4. The indicator is created with Non Lag Bollinger Bands strategy for the best entries. This is a system to target 10 to 20 pips per trade. The indicator will give alerts on the pair where signal was originated including timeframe. If signal sent, you then enter your trade and set the recommended pips target

Daily supply and demand levels for breakouts or reversals. Use on 1 Hour charts No nonsense, for the confident trader who trades price action supply and demand levels with daily projections without the fluff using 1 Hour charts. MT5 Version: https://www.mql5.com/en/market/product/108522 The Bank Trader Indicator is a sophisticated tool employed by institutional traders, particularly those in banking institutions, to navigate the complex world of forex markets. Rooted in the principles of daily

The EA closes market orders after a specified time interval (put simply - by timer) after they are opened. Use this utility if you need to close a trade after a certain time. The EA has the following input parameters: Only current symbol - if true , the EA will close only the selected symbol's orders; if set to false - it will close any order of any symbol. Timeout - time (in seconds), after which the EA closes the orders. This EA is simple and very easy to use, does not use up your CP

The indicator automatically sets trendlines on the really important points directly on the chart. Timeframe, color and style of the lines can be adjusted. Notification of a breakout above or below the line via a smartphone is possible.
Input Parameters TimeFrame : Choose timeframe AppliedPrice : Choose close , open, high, low, median, typical or weighted price Formation : Choose swing, Shoulder head shoulder or long term formation Alerts : true = alert is on SendEmail : Send message to email a

The Quick trade report separately by symbols script will be useful for simultaneous trading on multiple instruments. It provides the ability to assess the effectiveness of trading on each symbol separately. It is possible to set a time period for making the reports. The report visualizes the changes in the balance for deals on each symbol. Also, the following key trading parameters are calculated for each instrument: Total net profit - the financial result of all trades. This parameter represent
Trend Scanner is a trend indicator that helps to determine the current and forecast market direction using an advanced algorithm. Thanks to flexible alert settings, the indicator will promptly warn you about a trend reversal. The indicator is intuitive and easy to use, and will be an excellent filter in your trending trading strategies. The lines of this indicator are also an excellent dynamic level for stop loss, and is used as one of the types of trailing stop in Trading Panel . To fine-tune t
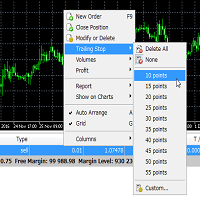
Trailing Stop Utility MT4 for automatic closing of deals by trailing stop levels. Allows you to take the maximum from the profit. Created by a professional trader for traders. Utility works with any market orders opened manually by a trader or using advisors. Can filter trades by magic number. The utility can work with any number of orders simultaneously.
WHAT THE UTILITY CAN DO: Set virtual trailing stop levels from 1 pip Set real trailing stop levels W ork with each order separ

Breakout Experts Advisor
Main strategy of this Experts Advisor is based on Daily High and Daily Low. If today's price break yesterday's high or low, this Experts will open trade. Please consider that is Experts are Martingale. But, their distance already set on the EA's program. FYI, distance for every order (on martingale) is also based on Fibonacci Retracement. It'll make every order not too close or too far. It's also help when the market are ranging/sideways. And, our maximum opened trade
This indicator shows you the angle of the moving average according to your settings in a separate window. It also shows the angle written on the chart, which can also be adjusted. The main features and input variables provided include: MAPeriod: This is the period for your moving average. The default MAPeriod is 5. LookBack: This is a very important variable. It allows you to set the look back bar, from which the angle will be measured. For example, if your LookBack is 5, then indicator will cal

Ever wondered why standard ADX is made unsigned and what if it would be kept signed? This indicator gives the answer, which allows you to trade more efficient. This indicator calculates ADX values using standard formulae, but excludes operation of taking the module of ADX values, which is forcedly added into ADX for some reason. In other words, the indicator preserves natural signs of ADX values, which makes it more consistent, easy to use, and gives signals earlier than standard ADX. Strictly s
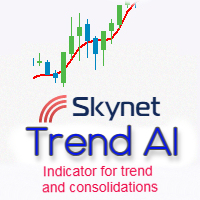
Skynet Trend AI shows trend on the price chart with a colored line. Usually, all traders are looking for a clue where to buy and where to sell using classic or downloaded indicators. But often it gets more and more confusing and every time you find it difficult and confusing to create a hint for yourself where to open a position. Self-reliance does not always justify the result. Therefore, it is better to use a simple and intuitive tool to solve your problem! Skynet Trend AI gives visual

Box martingale system is an indicator designed to trade martingale. This indicator sends a signal from the highest point where the trend is likely to return. With these signals the user starts the trades. These signals appear in the form of a box. The user can see from which point the signal is given. The important thing in trading martingale is to find a good starting point. This indicator provides this starting point.
Trade rules Start processing when the first trade signal arrives. The impo
Volume Volatility Dashboard is a great tool for quickest possible analysis of multiple currency pairs in terms of extremely high and extremely low accumulation to distribution ratio in comparison to values from past. The number of displayed symbols is 30 and the name of each symbol can be edited in the parameters, so we are able to analyze not only predetermined currency pairs, but also other ones, commodities, equities, indices, currency pairs with prefixes and suffixes etc... This analyzer is

Pivot trend indicator is a trend indicator that uses standard pivot calculation and some indicators. The purpose of the indicator is to calculate the possible trends using the pivot point. And to give the user an idea about trend direction. You can use this display as a trend indicator. Or with other indicators suitable for your strategy.
Features The green bar represents the upward trend. The red bar represents the downward trend. The blue pivot point represents the upward trend. The yellow p
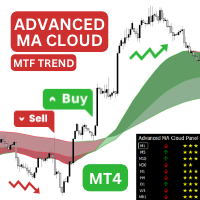
Introducing the Advanced MA Cloud indicator for MetaTrader 4 - a powerful indicator system that will help you identify potential buy and sell opportunities, as well as potential trend reversals. Advanced MA Cloud indicator is a great trend following indicator based on three fully customisable Moving Averages. In addition, t he indicator can also act as a support and resistance using the two clouds formed by the moving averages. Each moving average and each cloud changes its color according to
This indicator informs the user when the ATR is above a certain value defined by the user, as well as when the ATR prints a percentage increase or percentage decrease in its value, in order to offer the user information about the occurrence of spikes or drops in volatility which can be widely used within volatility-based trading systems or, especially, in Recovery Zone or Grid Hedge systems. Furthermore, as the volatility aspect is extremely determining for the success rate of any system based o

MetaCOT 2 is a set of indicators and specialized utilities for the analysis of the U.S. Commodity Futures Trading Commission reports. Thanks to the reports issued by the Commission, it is possible to analyze the size and direction of the positions of the major market participants, which brings the long-term price prediction accuracy to a new higher-quality level, inaccessible to most traders. The indicator of the net positions of the market participants displays the difference between the long a
Tick Chart — full-featured chart for MetaTrader 4. A utility for creating and working with a tick chart in the MetaTrader 4 terminal. You can create a tick chart that works exactly the same as a regular chart. You can apply indicators, Expert Advisors and scripts to the tick chart. You get a fully functional tick chart on which you can work just as well as on a regular chart. You can enable the output of the Ask price data. The data are generated in the form of the upper shadow of a tick bar. Fr
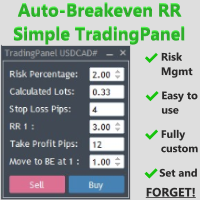
The Auto-Breakeven RR Simple TradingPanel EA is a simple and intuitive tool that will be an asset to your trading arsenal. Have you ever missed the perfect entry because you were busy calculating the lot size?
I have. Many times. Which is why I created this EA to simplify and automate risk management as much as I could.
A true SET AND FORGET tool - execute your trade and walk away to prevent micromanaging your trade. This tool secures the trade at your specified Risk-to-Reward (RR) level.

A tall upper shadow occurs when the price moves during the period, but goes back down, which is a bearish signal. A tall lower shadow forms when bears push the price down, but bulls pull it back up, which leaves a long line or shadow. This is considered a bullish signal.
Some technical analysts believe a tall or long shadow means the stock will turn or reverse. Some believe a short or lower shadow means a price rise is coming. In other words, a tall upper shadow means a downturn is coming, whil

The trade copier is designed for a fast and accurate copying of orders between the MetaTrader 4 terminals. The trade copier copies trades from the Master account to the Slave account by writing information to the total file, which is located in the common directory of the MetaTrader 4 terminals. This allows the trade copier to either customize various schemes for receiving and transmitting trade signals by changing the file name. Reading and writing the copier file is performed by timer. The tra

With this indicator you'll have a general reading of the market's range using Gann's calculating modes. Gann's swing is used to have a quick reading to the market latest movements at first glance. The foundation of this swing calculation is in the count of candles in relation to the break-up and break-down of the price. When the price breaks-up the last maximum, the swing will get traced if a certain number of candles is exceeded from the last minimum. It can be used a "pure Gann" or not: If set

Are you a day/week/month trader, or even a quick scalper? MCTS will show you the best trending currencies to trade on any timeframe. By using a unique algorithm MCTS measures the strengths of individual currencies and then combines them into pairs to show you the best pairs to trade. Monitor all 8 major currencies and all 28 pairs. Monitors the strengths of the following currencies: EUR, USD, GBP, JPY, AUD, NZD, CHF, CAD. Measure the true strength of a currency on any timeframe. Know which curre

SystemBinaryM1 - a professional indicator for trading short-term binary options, is a complete, self-contained author's strategy for working in the binary options market. The unique algorithm for analyzing the foreign exchange market is based on the calculation of reference points on three different time periods M15, M5. M1. Thus, the indicator simultaneously analyzes the long-term, medium-term and short-term price behavior before issuing a signal. The indicator is set in the usual way and work

If you like trading by candle patterns and want to reinforce this approach by modern technologies, this indicator and other related tools are for you. In fact, this indicator is a part of a toolbox, that includes a neural network engine implementing Self-Organizing Map (SOM) for candle patterns recognition, prediction, and provides you with an option to explore input and resulting data. The toolbox contains: SOMFX1Builder - a script for training neural networks; it builds a file with generalize

This indicator is based on the Weis wave principle of wave volume. Below are few features of the indicator It draws the wave on the chart while the accumulated volume per wave in a different window at the bottom of the chart You can configure the turning point move It displays the accumulated volume (in thousands, eg for 15000 volume it will show 15) at the end of each wave You can also configure to show number of candles in the wave along with the wave volume The indicator calculates the distin

This utility provides the ability to use hot keys in manual trading instantly responding to the current market situation. You can assign hot keys to open/close positions by their type, close all positions on the current chart and remove all orders on the current chart. You can also assign hot keys for five predefined trade volumes and switch between them if necessary with no need to change the volume manually from time to time. It is also possible to set the auto calculation of a trade volume in

The main idea of this indicator is rates analysis and prediction by Fourier transform. The indicator decomposes exchange rates into main harmonics and calculates their product in future. The indicator shows 2 price marks in history, depicting price range in the past, and 2 price marks in future with price movement forecast. Buy or sell decision and take profit size are displayed in a text label in the indicator window. The indicator uses another indicator as an engine for calculations - FreqoMet
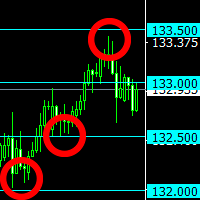
The indicator plots "round" levels, the step of which is specified in the settings.
Perfect as an addition to any trading systems.
Very low price - only $ 30! Round levels often become price support or resistance. MT5-version: https://www.mql5.com/en/market/product/67255
This allows you to either fix a profit, or open a position after a breakdown of the level, work towards a rebound in price. The indicator will be an excellent tool in a trader's arsenal!

The EA opens orders using the Wolfe waves indicator, also uses the Martingale and smart Trailing Stop, Stop Loss and Take Profit. Trades are always protected with STOPLOSS, Smart Trailing and Breakeven. This EA is easy to use. The EA has proven results on EURUSD M5, however you can change the settings for better results on other currencies.
Settings Setting EA - Settings of the Advisor. Invest More - at the value 'true' the lot size increases as the account balance grows.( Risk Management ). I

Currency Strength Meter is the easiest way to identify strong and weak currencies. This indicator shows the relative strength of 8 major currencies + Gold: AUD, CAD, CHF, EUR, GBP, JPY, NZD, USD, XAU. Gold symbol can be changed to other symbols like XAG, XAU etc.
By default the strength value is normalised to the range from 0 to 100 for RSI algorithm: The value above 60 means strong currency; The value below 40 means weak currency;
This indicator needs the data of all 28 major currency pair
Market Zones This indicator provides an easy way to get to trade based on Gaussian statistical levels similar to the Market Profile methodology. Using an exclusive formula the indicator estimates dinamic zones where the market movements statistically remains most of the time (70%), this allows to see the market on a simplified way avoiding following non-relevant bar movements. Prices stay calm inside market zones and tend to move faster outside the zones. This is crutial to identify best zones

Description: The indicator predicts, with a specific probability, if the actual candlestick range will expand or contract compared to the range of a previous candle. Furthermore, the indicator shows the possible high or low of the actual candle, based on trend direction. (Recommended for Daily, Weekly, or Monthly timeframes).
KEY LINKS: Indicator Manual – How to Install – Frequent Questions - All Products How to use the indicator: Determines, with a certain probability, if there will
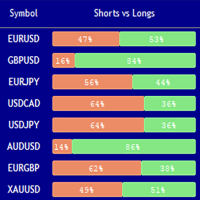
Market Sentiment Indicator Market Sentiment is a Trading Tool which allows you to see the positions of other currency traders. Until now, only institutional traders had access to such data which gave them a serious advantage over retail traders because of obvious reasons. With Market Sentiment, you too will finally know what other traders are doing which makes it easy to beat them on the forex battlefield.
Data comes from MyFxbook Community Outlook data feed and is based on up to 100 000 liv

MCAD stands for M ulti C urrency A ccumulation/ D istribution, so please don't confuse it with the well-known MACD. MCAD calculates relative strengths of Accumulation/Distribution of volumes for plain Forex currencies (that is their synthetic behaviour extracted from Forex pairs), market indices, CFDs and other groups of tickers. It uses standard Accumulation/Distribution formula ( Wikipedia's article ) and can apply it either to tick volumes, or to pseudo-real volumes ( volume surrogates , intr

KT Heiken Ashi Alert plots the buy and sell arrows and generate alerts based on the standard Heiken Ashi candles. Its a must use tool for the traders who want to incorporate Heiken Ashi in their trading strategy. A buy arrow plotted when Heiken Ashi change to a bullish state from bearish state. A sell arrow plotted when Heiken Ashi change to a bearish state from bullish state. Mobile notifications, Email, Sound and Pop-up alerts included.
What exactly is Heiken Ashi? In Japanese, the term Hei

This indicator displays Point & Figure charts (PnF charts) in the indicator window. PnF charts show only price movements that are bigger than the specified box size. It helps to eliminate noise and allows focusing on main trends. Time is not a factor here. Only price movements are taken into account. That is why PnF chart is not synchronized with the main chart it is attached to. More about PnF charts: http://stockcharts.com/school/doku.php?id=chart_school:chart_analysis:pnf_charts Indicator wor
FREE

Vizzion is a fully automated scalping Expert Advisor that can be run successfully using GBPJPY currency pair at H1 timeframe. Very Important
This Expert Advisor can not run with any EAs in the same account. As part of the money management plan, it calculates and monitors the Margin Level % and assumes that all open trades are created by it. If you want an Expert Advisor that trades in a daily basis, this EA is not for you because using this requires a patience to wait for a few days or weeks o

Expert Description: Equity Profits Overview: "Equity Profits" is an efficient and user-friendly Forex expert advisor designed to manage trades based on equity profits rather than balance. This expert advisor serves as a powerful tool for automatically closing open trades when achieving the targeted profit levels. Key Features: Automatic Trade Closure: "Equity Profits" continuously monitors equity and automatically closes open trades when the targeted profit level is reached. Customizable Profit

After working during many months, with the help of Neural Networks, we have perfected the ultimate tool you are going to need for identifying key price levels (Supports and Resistances) and Supply and Demand zones. Perfectly suitable to trigger your trades, set up your future actions, decide your Take Profit and Stop Loss levels, and confirm the market direction. Price will always move between those levels, bouncing or breaking; from one zone to another, all the remaining movements are just mark

MASi Three Screens is based on the trading strategy by Dr. Alexander Elder. This indicator is a collection of algorithms. Algorithms are based on the analysis of charts of several timeframes. You can apply any of the provided algorithms.
List of versions of algorithms:
ThreeScreens v1.0 - A simple implementation, with analysis of the MACD line; ThreeScreens v1.1 - A simple implementation, with analysis of the MACD histogram; ThreeScreens v1.2 - Combines the first two algorithms
FREE
The MetaTrader Market offers a convenient and secure venue to buy applications for the MetaTrader platform. Download free demo versions of Expert Advisors and indicators right from your terminal for testing in the Strategy Tester.
Test applications in different modes to monitor the performance and make a payment for the product you want using the MQL5.community Payment System.
You are missing trading opportunities:
- Free trading apps
- Over 8,000 signals for copying
- Economic news for exploring financial markets
Registration
Log in
If you do not have an account, please register
Allow the use of cookies to log in to the MQL5.com website.
Please enable the necessary setting in your browser, otherwise you will not be able to log in.