Handelsroboter und Indikatoren für den MetaTrader 4 - 57

FuturePriceM15 - один из немногих индикаторов, который делает прогноз цены прямо на ценовом графике. Алгоритм расчета индикатора основан на быстром преобразовании Фурье. Имея колебательное поведение цены, функция Фурье прогнозирует ее поведение в дальнейшем. Индикатор устанавливается обычным образом на график с торговым инструментом указанным в переменной symbol с периодом M15 , данный временной период является самым оптимальным для работы с любыми торговыми символами. После установки, индикато
FREE

1. Make sure you trade only with GBP/USD on an 1h chart as this model is built specifically for the hourly Cable trading. 2. If you are backtesting the EA during weekends, make sure to specify a reasonable spread (such as 30 or 50) instead of using current spread because the market is not trading and the current spread may be some awkward number. During weekdays, feel free to use current spread as it is the correct current spread value. 3. If you want to have an even more stable-performing EA,
FREE

Telegram Forwarder can forward all activities related to trades and position taking as a signal to Telegram messenger. It can also forward indicators' alert to Telegram if you modify indicator code (I can do it for you too) to hand over alerts to Telegram Forwarder. This EA is intended for business and professional usage. You can introduce your own Telegram bot and customize water mark in screenshots.
Telegram forwarder is able to forward signals for "new order", "modification of order", "Pendi
The MACD and MA filter EA trades on the MACD indicator, uses the filter as two moving averages (fast MA is higher than slow MA - buy, sell - contrary), the Martingale is applied at the request of the User (the amount of lot multiplication for a series of losses is limited), breakeven, trailing stop, inverting the signal. In EA version 1.4. added closing an order by a reverse signal, separately by the MACD indicator (parameter Close_By_Reverse_MACD_Signal), separately by moving averages (paramete
FREE

The Bolliger Bands On-Off let you control the indicator using the keyboard or a button . You can choose if you want the indicator always shown or always hided while switching among different time frames or financial instruments . ---> This indicator is part of Combo Indicator OnOff
The Bollinger Bands identify the degree of real-time volatility for a financial instruments . A lower amplitude corresponds to a low volatility, conversely a greater bandwidth corresponds to high volatility. N
FREE

This indicator scans the Moving Average values for 2 Moving Averages on multiple pairs and multiple timeframes in realtime and displays a Buy signal when the fast MA is above the slow MA and a Sell signal when the fast MA is below the slow MA.
-All the MA parameters(Period, Method and Applied price) can be changed from the inputs window.
-You can either add your own list of pairs to scan or set the scanner to automatically use the pairs in the market watch using the Symbols Source input.
FREE

By default Metatrader will show any newly created chart object on all timeframes.
This handy utility will set the visibility of any new chart object drawn to be that of the current chart only.
e.g. If the chart timeframe is H4 then a new object will only be visible on the H4 timeframe.
Each object type can be included or excluded as required and, of course you can change the timeframes setting afterwards as this only operates at the point the chart object is created.
Add to your chart a
FREE

This is a free version of the EA TrendSurfer OsMa https://www.mql5.com/en/market/product/104264 TrendSurfer OsMa receives signals from a technical analysis of in-built MetaTrader 4 indicator Oscillator of a Moving Average (OsMA) and then implements The Quantum Forex Trading System to generate positive results. Discover: The Quantum Forex Trading System _Mastering the Market with Advanced Algorithms & Multifaceted Strategies_ --- Redefining Forex Trading: In the vast realm of forex, wh
FREE

TPP : Turning Point Pattern The indicator shows the market Turning Point Pattern as arrows. The reversal signals are based on observation of price action and market behavior. It is based on the principles of searching for extremums, volatility, and candlestick pattern. The indicator provides signals on the following principles: Search for the end of the ascending/descending trend Search for the reversal pattern based on candlestick pattern Confirmation of the reversal by the volatility. The in
FREE

Easy to use, fully automated neural network trading robot. Works on the H1 timeframe with two currency pairs (AUDCAD, USDCAD). Limitations of the free version - only two currency pairs support (7 in the full version) and 0.01 lots max order size.
Minimal recommended deposit size: with grid enabled - $150 per symbol; with grid disabled - $100 for all symbols.
Parameters Instruments - currency pairs to trade; Order size calc method - type of the calculation of the order size; Fixed order size
FREE

This is a reduced version, demo if you like, of the published Elliott Wave Tool 7Pasos . The limitations for this tool vs Elliott Wave Tool 7pasos are the following: Only one account possible, the original tool has 1 principal and 4 alternative accounts. Only one degree (Primary) is available, in the original tool 12 different degrees (6 in micro) are at your disposition. As only one degree is available, the functions to upgrade and downgrade the degree of the selected wave are disabled. Fixed c
FREE
***** The REAL , ORIGINAL, Non-Repainting, Non-Delaying, Arrow Trade Entry indicator for Very Low-Risk market execution *****
***This is the Golden standard in arrow indicators for MT4.*** BING Setup Arrows Indicator(BSA) will show easy-to-read High Probability trading situations with Non-Repainting , Non-Delaying , Up or Down arrows on the graph. So simple, it's brilliant. Always shows very good trading setups, no flashy colors, confusing configurations, hard-to-read dashboards, etc. Perfe
DepoControl – Full Control Over the Deposit Closers Expert Advisor controls the overall account status and closes ALL market orders on the account when certain conditions occur. The trading robot closes ALL orders on the account in the following cases (by profit): Close ALL orders by a total profit on the account in monetary terms . For example, suppose that the settings specify that positions should be closed when profit of 100 is reached. In this case, the Expert Advisor closes all mark

A multi-currency Expert Advisor with its own indicator. The main principle of operation is averaging using martingale, the EA has a built-in function for opening deals with a spread limit. For safe trading, the account must have at least $ 100 on a cent account, or $ 10,000 on a classic one . Recommended broker for a classic account www.icmarkets.com or alpari.forex/ru for a cent account. Recommended pairs : EURUSD , AUDUSD , EURGBP, EURCHF, USDCHF, USDCAD on a 1-minute chart( M1 ), spread up to

This dynamic indicator will identify when Fast Moving Averages (EMA, SMA, or LW) cross Slow Moving Average lines on any timeframe and with any symbol.
When the moving averages cross and price close above or below the crossing, the User will receive an alert via pop-up, push, or email.
Choose any two Moving Averages to cross to receive an alert and the Indicator will also paint the Moving Average Lines and Arrows.
You can choose Exponential Moving Averages (EMA). Simple Moving Averages (SMA

Tester Periods is the useful indicator for visual strategy tester which extend chart periods. Its designed for the trading utility Trade Shell (included Trade Shell SMC ).
Run the Trade Shell on the visual tester. Then put the Tester Periods indicator on the chart. If you wanna see timeframes M1, M5, M10, M15 , for example, then you have to run visual tester on M1 and to define multipliers like that: TimeFrame_Periods_Multiplier = 1,5,10,15 If you wanna see timeframes M5, M20, M30, H1, fo
FREE

This utility identifies certain candle open times on chart, this can help you to see your favorite candle open and use it as it fits in your strategy. This tool is very useful for intraday charting and indicating your sessions. ___________________________________________________________________________________
Disclaimer: Do NOT trade or invest based upon the analysis presented on this channel. Always do your own research and due diligence before investing or trading. I’ll never tell you what
FREE

VR Ticks ist ein spezieller Indikator für Scalping-basierte Strategien. Dank dieses Indikators kann der Händler den Tick-Chart direkt auf dem Hauptchart des Finanzinstruments sehen. Mit einem Tick-Chart können Sie eine Position am Markt so genau wie möglich eingeben oder schließen. VR Ticks stellt Zeckendaten in Form von Linien dar, deren Farbe sich je nach Richtung ändert – so können Sie die Situation an Zecken visuell verstehen und beurteilen. Der Vorteil von Tick-Charts besteht darin, dass si
FREE

Trade Receiver Free is a free tool to copy trades/signals from multiple MT4/MT5 accounts. The provider account must use copier EA to send the signal. This version can be used on MT4 accounts only. For MT5 accounts, you must use Trade Receiver Free for MT5 . Reference: - For MT4 receiver, please download Trade Receiver Free .
- For MT5 receiver, please download Trade Receiver Free MT5 .
- For cTrader receiver, please download Trade Receiver Free cTrader .
- If you only need copy from MT
FREE

Optimizes the value of overbought and oversold on each new bar. This expert strives to choose the best values for a simple strategy where it sells when the indicator crosses below an overbought level and executes a buy when it crosses above an oversold level. The best overbought and oversold level is calculated on each new bar according to how that value would have performed during the optimizing periods which can be specified.
Inputs Unique number for this EA - can be any integer value. Optim

SpreadLive shows the full Spread history of a chart with different colors. It alerts you (MT4, E-Mail and Mobile) when the spread reaches the limit, which you can define in the settings. The menu contains Current Spread , Average Spread and Highest Spread of current chart. The main idea is to use it with an EA and analyze negative profits from the spread history. This helps you to see how your broker varies the spread.
Inputs Spread limit - limit to alert. Type - Show in points or pips. Alert:
FREE

Indicator draws Round Number lines by distance of pips. 1. You can enable / disable indicator to show / hide the lines. 2. You can set distance of pips between the lines. 3. You can edit the number of lines. 4. You can edit properties of lines by inputs (style (DASH, DOT, SOLID, ...) , width (1 for DASH, DOT, 2 is not for DASH, DOT, it only SOLID), color). When indicator is deleted from the chart, the lines will be removed.
FREE
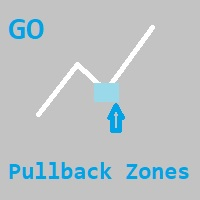
GO Pullback Zones is a unique trend following indicator that helps you enter a trade at an early stage, right after a pullback is over. After purchase, leave a review, a comment or make a screenshot of your purchase and contact me to receive the Trade Entry Manager utility !
Feel free to check out my other products here : https://www.mql5.com/en/users/gyila.oliver/seller#products The default settings are for M1 timeframe ! The indicator detects candlestick patterns forming at reversal zones

This indicator is the translated version of Anıl ÖZEKŞİ's MOST Indicator, developed on the Matriks Data Terminal, into the MQL4 language. It is a trend-following indicator and quite successful. Its usage will be free and unlimited for a lifetime. You can click on my profile to access the MQL5 version of this indicator. You can also get your programming requests for MQL4 and MQL5 languages done at İpek Bilgisayar with an invoiced service. You can reach İpek Bilgisayar at www.ipekbilgisayar.org .
FREE
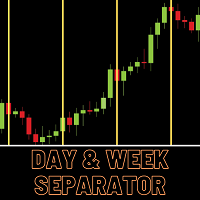
Day and Week separator is a very simple tool to show day and week separator lines from a specific time mentioned in the input. This is specially helpful for the trades who has time zone differences in their broker terminal. Let us take an example If user know that at 7:00 in the chart his local time 00:00 then he will simply put 7:00 in the input . Separator lines will starts drawing from current day's 7:00 There is also a bold line for weekly separator
FREE

The "MACD Trend Follower" is an indicator based on the MACD oscillator. It serves to spot the trend direction by giving it a fixed color until the trend changes (the trend direction colors are customizable). The default MACD settings for the indicator has been changed to adapt to the fast moving Forex market, but they can be changed to suit the trader.
Recommended settings for the indicator : - MACD Fast EMA : 8 Periods. - MACD Slow EMA : 13 Periods. - MACD SMA : 5 Periods.
Indicator inputs
FREE

Having to check constantly if your CCI has reached a specific level can be tedious and draining at times, especially if you have to monitor different asset classes at a time. The Alert CCI indicator will assist in this task, ensuring that you get the most with little effort. When the CCI values get to a specified level, the alerts will go off, on the chart, on the MT4 phone app or via email (You can receive text messages to your phone if you activate texts on your Gmail account). The indicator d
FREE

Triple Exponential Moving Average Technical Indicator (TEMA) was developed by Patrick Mulloy and published in the "Technical Analysis of Stocks & Commodities" magazine. It works as the same as EMA. However, it provides smaller lags, even compared to Double EMA. Input Description: period: MA's period. Must be higher than 1. applied_price: Define the price to be applied. Use 1 of these integers. 0 -> applied_price is Close price 1 Open price 2 High price 3 Low price 4 Median price 5 Typical price
FREE

Convenient and intuitive understandable EA for modify breakeven for orders opened by user or other advisors with a indent. It is useful both for modifying single orders and for calculating the breakeven level of a group of orders or martingale grid.
Expert Advisor can set both Take Profit and Stop Loss indented from the BU level in pips or percent of the deposit.
There are three options for working with orders goals: Only calculating and displaying levels on a chart, modify specified goals,
FREE

Was: $99 Now: $34
Blahtech Daily Range indicator displays the average daily range alongside the individual session ranges. Using the daily open price as a reference the indicator shows fixed range and dynamic range targets as lines on the charts. These lines clearly show when the average range has been exhausted. Daily and session ranges can be useful for confirming entries or setting targets and is an excellent odds enhancer for many trading systems. Links [ Documentation | Install |
The RSI S-RoC indicator differs from the standard RSI in that it takes into account the price rate of change when calculating values. When the price moves in a trend, the indicator produces good entry signals oncethe price touches its levels. The level values can be configured in the indicator settings. They can also be modified and adjusted directly in the indicator window. You can also set on a chart signal lines. Once they are crossed, the indicator will produce a sound alert or play a user
FREE
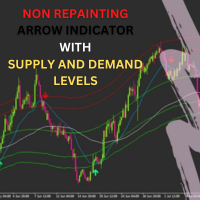
*****ARROWS NON REPAINT ***** Trade With Sam Simple Strategy Guide : https://www.mql5.com/en/blogs/post/740855
MT5 version of the indicator
Try Out and see the Difference
The Sam's Trend Blaster indicator tracks the market trend with an unmatched reliability, by ignoring sudden fluctuations and market noise. It has been designed to trend-trade intraday charts and small timeframes. Its winning ratio is around 85%. This is an arrow indicator that shows precise price reversals. A great ar

EA_SMI is based on SMI indicator. The Stochastic Momentum Index (SMI) is a technical indicator used to assess the momentum and direction of a trend. It is an improved version of the traditional Stochastic Oscillator, designed to provide a more accurate reflection of price changes. Below is an explanation of the basic concepts and usage of the SMI. Basic Concepts of SMI Calculation Method : The SMI measures where the current price stands relative to the range of prices over a specific period, co
FREE

Vorstellung des Goldgramm Preisrechner-Indikators Interessieren Sie sich dafür, den Goldpreis in Ihrer lokalen Währung stets im Blick zu behalten? Suchen Sie nicht weiter, denn der Goldgramm Preisrechner-Indikator bietet Ihnen ein innovatives Tool, mit dem Sie den Echtzeitpreis pro Gramm Gold in Ihrer bevorzugten lokalen Währung berechnen können. Mit diesem Indikator können Sie finanzielle Erkenntnisse nutzen, um informierte Entscheidungen zu treffen. Hauptmerkmale: Lokalisierter Goldpreis: Der
FREE

如果产品有任何问题或者您需要在此产品上添加功能,请联系我 Contact/message me if you encounter any issue using the product or need extra feature to add on the base version.
PA Touching Alert is a tool to free you from watching price to touch certain critical price level all day alone. With this tool, you can set two price levels: upper price and lower price, which should be greater than/ less than the current price respectively. Then once price touches the upper price or lower price, alert and/or notification would be sen
FREE

This EA has a very unique logic, meaning it does not use any indicators at all. It relies solely on monitoring the movement of candlesticks to determine entries. Specifically, it enters trades when certain conditions are met, such as the relationship between the previous candlestick and the current candlestick, or the timing of new highs or lows being reached. The number of entries is not significant, but it consistently generates profits by increasing the lot size when a loss occurs.
Please T
FREE

Questo Expert Advisor è un professionale EA il quale sarà sempre aperto. Userà diversi indicatori, tra cui il parabolic Sar. Attualmente è possibile fissare il numero di lotti (0.20 di defoult); Non usa Martingala, non usa grid o altri sistemi rischiosi. Provalo in demo. Ottimi risultati su tante coppie di scambi. Consiglio di non usarlo su leva altissima.
FREE

Trailing Step is an EA that lets the order's stop loss at a specific distance of current price, set by pips. Its configuration is very simple:
Trailing stop in pips - sets the stop loss distance in relation to the current price in pips. Trail step in pips - sets the "step" of stop loss in pips.
Never miss a trade by forgetting to move the stop. Guarantee your profit!
Any doubt or suggestion do not hesitate in contact us.
Enjoy!
Obs. You need to set the stoploss when you open your trade
FREE

This EA will open Buy and Sell simultaneously after attached to chart. It has customized grouping grid step and lot multiplier group. Please contact me if you have any question. Please Like, Share & Subscribe to my Youtube Channel. I will give this FULL VERSION EA for FREE for everyone if there is 2k Subscriber on my Youtube channel , please ask your friend, because subscribe is FREE :).
Need at least 10k balance (10k cent or 10k$), or you can adjust with various setting inside the EA to get t
FREE
A free program for copying orders between terminals on the same computer.
Any orders are copied in any direction, between any accounts.
The principle of operation:
On the terminal from which you want to copy, the "Server" parameter is set. On the terminal or terminals where the copied positions need to be opened, the "Client" parameter is set. It is also necessary to enter the account number of the "Server" terminal on the client.
In the future, it is planned to increase the functiona
FREE
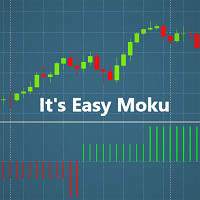
Introduction:
Welcome dear Users, This indicator has been developed in order to help traders who are daily struggling to find a strategy . I have always been acctracted by Ichimoku Strategy, however took me sometime figure out how it does work. Easy Moku makes Ichimoku Simple!
Aspect:
Easy Moku shows 2 principal ICHIMOKU signals: kijun sen/tenken sen sen crossover Span A Span B + Kijun sen/tenken sen Get Rid of all the Ichimoku Lines!
On the Mt4 Chart the Easy Moku paints an Histog
FREE

This adviser trades by volume, analyzing candles. It is a free version of Volume candlex master . Differences from the paid ones are that there are not some functions here: working on 2 timeframes, using Moving average, dynamic stop-loss and take-profit, and also the maximum lot is limited (no more than 0.10). Recommended timeframes: M5, M15, M30. Before trading, optimize the parameters of the advisor for your account. Input parameters Lots - lot size; MaxSpread - the maximum spread for the op
FREE

TitanFury Forex EA is a work based on the method of correlationtrading. Best to work in most market conditions. Since it uses the absorb method ,low drawdown,no martingale,autolot system.
This EA has been integrated withh a multi-pair trading system,so this EA only enough to be installed on a chart. This TitanFury is a fully automatic forex robot but you can manually interact with thhis EA using its dashboard. Also,this EA ill not work on BACKTESTING because it's a multicurrency. Try a demo
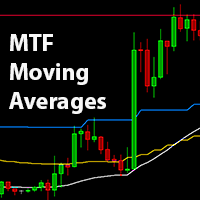
MTF Moving Averages is an useful indicator that brings you data from fully customizable higher timeframe Moving Averages on your charts, you can add multiple Moving Averages to use even more data of current market conditions. Check the indicator in action [Images below]
What MTF Moving Averages does apart from showing higher timeframe MA's?
Time saver , having all your higher timeframe MA's in just one chart, time is key, avoid switching between timeframes. Enter Trends precisely, easy to fol

This scanner is monitoring the entire market for trade opportunities for all symbols and for all time frames. You don't have to look to all the charts, for all symbols and for all time frames. This scanner will alert you on your computer, or on your mobile, when a trade opportunity has been found. You never have to miss a trade opportunity! This indicator is designed to scan all pairs and symbols, for all time frames, to find a cross of the MACD main and signal line. MACD Definition
The

This is a standard Bollinger Bands indicator. I have added a quick control panel in the bottom left corner for it. When multiple different parameters of this indicator are simultaneously enabled, the control panel can quickly switch between different parameters of the indicator, making it easier to observe multiple indicators simultaneously. For example, it is possible to quickly switch observations while combining a period of 20 and a period of 30. Parameter description: Indicator ID: The uniqu
FREE

you can plan you exit in terms of money/floating with this tool Once the negative or positive floating value reached this tool will close all opened positions
How to deal with big negative floating profit?
It will be very difficult to overcome this phase you can prevent with this phase with a exit strategy
It can be stop loss or close all orders if account has reached this much floating
FREE

This is the countdown of the last candle Indicator. How much time remains in the current candle of your chart CTime display exactly how many hours, minutes and seconds remain before the current candle closes, and a new one opens. This allows you to be on the ball as soon as the next candle appears It could be useful for a trader who trades with candles as the main attention Available option to change the text color to suit the chart background. This Indicator is related to the system here .
FREE
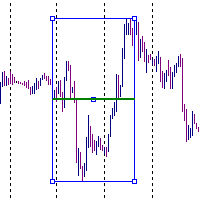
It is just an alternative fibo lines, because mt4 have is a very strange drawing of fibo lines A simple Box (Rectangle) graphic element with adjustable levels binding: it is possible to specify up to 17 custom levels, all rectangles on the chart with the given prefix in their name are processed. Levels are specified in % of the height of the rectangle. A convenient graphical element for analyzing charts by growth-correction levels. Enjoy your work!
FREE
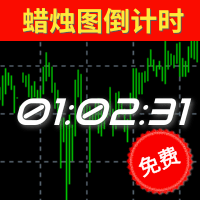
倒计时指标功能介绍 类别
解释
备注
预计结束倒计时 计算当前周期蜡烛图的结束时间(可应用于所有周期),其考虑了蜡烛图可能会因为日常休市而提前结束的情况; 如果该蜡烛图包含多个休市和开市的情况下,以最后的休市或者蜡烛图收盘时间为准。 值得特别注意的是:本指标并没有将平台额外公布的节假日休市、修改休市或者开市时间等因素纳入考虑范围,它仅仅是基于MT4所公开的交易时间做计算,无法100%确保本品种的收盘或者开盘时间无误 ,故使用者需提前明确该品种交易时间情况。
预计开盘倒计时 仅限于状态为"休市中"的提示,根据MT4上公开显示开市时间进行预估大约还有多久时间开盘; 和预计结束倒计时类似,并没有将额外公布的时间纳入考量。由于W1和MN1周期中包含多次的开盘和收盘,所以该两周期无休市提示。
【状态】 颜色 状态 备注 绿色 正常 一切正常 黄色 服务器无报价 服务器实际上传送到MT4并非是毫无中断的,可能是1分钟之内出现多次,甚至是连续较长的时间无报价,取决于您所处的网络延迟、服务器的情况等等。
本品种已有X秒无报价 MT4上并不是所有的品种的报价都是最新的,有可能某
FREE

This forex robot was specially designed for XAUUSD Gold.
The best time frame is H1 and the logid is base on Moving average.
If the price touch the range of 2 moving average, the EA will make an entry.
Stoploss is made based on the outer band of the moving average. The trade time is already ptmized and you can use the time filter to make a good profit. You can change these parameters. tp and stoploss and time trade time and lot size.
FREE
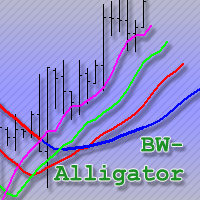
An improved version of the classic Alligator indicator by Bill Williams.
Description The Alligator technical indicator is a combination of moving averages (balance lines). Blue line (Alligator Jaw) is a 13-period smoothed moving average, shifted by 8 bars into the future; Red line (Alligator Teeth) is an 8-period smoothed moving average, shifted by 5 bars into the future; Green line (Alligator Lips) is a 5-period smoothed moving average, shifted by 3 bars into the future; Purple line (Fast Gat

The ICT Concepts indicator regroups core concepts highlighted by trader and educator "The Inner Circle Trader" (ICT) into an all-in-one toolkit. Features include Market Structure (MSS & BOS), Order Blocks, Imbalances, Buyside/Sellside Liquidity, Displacements, ICT Killzones, and New Week/Day Opening Gaps. It’s one kind of Smart money concepts. USAGE: Please read this document ! DETAILS Market Structure Market structure labels are constructed from price breaking a prior extreme

Do you think it's impossible to consistently win in the field of FX (foreign exchange trading)?
I've experienced numerous setbacks. However, I never give up.
Because persisting leads to achieving dreams.
TP (Take Profit) closes up to 10 orders at 10 pips each.
This EA (Expert Advisor) holds the potential to fulfill your dreams.
Operating on EURUSD M15 yields the most effective results, but profits can be targeted on other pairs as well.
With advanced analysis and automated trad

The indicator finds candlestick patterns based on Gregory L.' Morris "Candlestick Charting Explained: Timeless Techniques for Trading Stocks and Futures". If a pattern is detected, the indicator displays a message at a bar closure. If you trade using the MetaTrader 5 terminal, then you can download the full analogue of the " Candle Pattern Finder for MT5 " indicator It recognizes the following patterns: Bullish/Bearish (possible settings in brackets) : Hammer / Shooting Star (with or without con

********* 60% discount . you can buy this amazing EA at $280 now. (the price before the discount was $700). *********
Ultimate Trader MT4 is a completely automated trading robot that has been designed and created based on our best strategies in forex trading. All trades are protected by stop loss. the EA uses one same stop-loss for all the trades in one circle so the risk is limited with a safe lot size. The EA contains a special DrawDown control function. Users can use a fixed lot or a

MerkaStudent is a basic version of an expert advisor that allows us to understand part of the behavior of a chart in historical time.
It uses some basic parameters in trading, which allows us to understand mathematically how a chart moves and thus know what is our mathematical expectation in the historical period analyzed. Starting from a mathematical logic, we can create a strategy to evaluate its results.
FREE
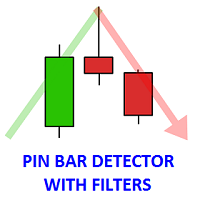
The indicator finds the Pin bars on the chart, perhaps, the most powerful Price Action pattern. The indicator has additional filters, and the user can: specify all parameters of the pin bar size as a percentage of the total candle size (minimum length of the large wick, maximum values of the short wick and body size). set the number of fractals for the last N bars, the Pin bar is based on, i.e. define the support/resistance levels. specify the required number of bearish/bullish bars before the P

The purpose of this new version of the MT4 standard indicator provided in your platform is to display in a sub-window multiple timeframes of the same indicator. See the example shown in the picture below. But the display isn’t like a simple MTF indicator. This is the real display of the indicator on its timeframe. Here's the options available in the FFx indicator: Select the timeframes to be displayed (M1 to Monthly) Define the width (number of bars) for each timeframe box Alert pop up/sound/ema
FREE
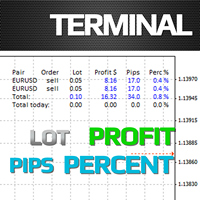
The Terminal indicator is a substitution for the standard Terminal tab. The indicator is displayed as a kind of table consisting of several elements: A row with column descriptions; Open orders; Summary information of open orders; Summary information of current day closed orders. The indicator settings: Graph corner for attachment - the corner of the chart where the table will be positioned Font - font type Fontsize - font size Text color - display settings
Profit color - display settings Loss
FREE

This is a new kind of trailing. Forget about pips and points and start thinking about money!
With this Expert Advisor you choose the amount in money (your currency) and when the price reaches that amount the trail will be activated. Let's say you want to lock $10.00 when any order has a floating $20.00 .. Just set the trigger to 20 and the step to 10. This means that when the profit for any order is $20.00, it will lock the price $10.00 bellow . So you lock and guarantee $10.00 profit . As lon
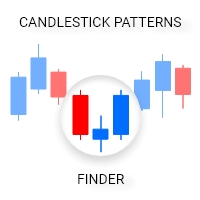
Candlestick Patterns Finder is a great tool to analyze candlestick charts. Indicator contains an advanced search algoritm and friendly graphic interface based on modified EasyAndFastGUI library. Has the ability to recognize 24 candlestick patterns. It was designed with the idea of simple and more efficient use of the indicator. It supports decision-making by automatically identifying candlestick patterns on the chart. The indicator has the ability to run in mode with and without a graphic

ICT Kill zone and Macros Indicator mark and display the following zone times on the chart: Kill zones Kill zone Forex Asian
London Open New York Open London Close Central Bank Dealing range
Kill zone Indices Asian London Open New York AM New York Lunch New York PM Power Hour
Macros London 1 London 2 New York Am 1 New York AM 2 New York Lunch New York PM 1 New York PM 2
Silver bullet London Open New York AM New York PM
Sessions Asian London New York
Chart The display of Kill zone ,

Das Panel hat die intuitivste Benutzeroberfläche, mit der jeder Anfänger umgehen kann.
In der Spalte SLp müssen Sie die SL-Größe in Pips angeben. Wenn der Wert grau wird und gleichzeitig auch die Bay / Sell-Buttons inaktiv sind, dann haben Sie einen SL-Wert angegeben, der niedriger ist als der zulässige, bevor er von Ihrem Broker festgelegt wurde.
In der Spalte TP% - geben Sie TP in% des Kontostands an. In den Einstellungen können Sie auswählen, wie dieser Indikator berechnet wird, nach Eig
FREE

Introduction Excessive Momentum Indicator is the momentum indicator to measure the excessive momentum directly from raw price series. Hence, this is an extended price action and pattern trading. Excessive Momentum Indicator was originally developed by Young Ho Seo. This indicator demonstrates the concept of Equilibrium Fractal Wave and Practical Application at the same time. Excessive Momentum detects the market anomaly. Excessive momentum will give us a lot of clue about potential reversal and

The FxSProMT indicator shows the current market trend and trend change.
Indicator Parameters Ind_Period - the number of previous bars used to calculate actual values. Number_Bars - the number of bars to display the indicator.. Too many bars may significantly slow down the operation of the trading terminal. Signal_Sound - sound alert to notify of trend change. The sound can be played multiple times until the signal is confirmed (the bar closes). Default is disabled. Signal_Alert - an alert to n
FREE

News Filter Alerts EA. Low, Medium & High impacts News
This EA will not work on the Demo version in backtest
You only need to authorize this url in the MT4 options:
To see the url and how to add it to MT4, visit this post:
https://www.mql5.com/en/blogs/post/754794
Many traders will recommend NOT trading during the news since indicators and Expert Advisors tend to make mistakes unnecessarily arriving several times in SL in a very few minutes since at that moment some politician is ta
FREE

This is the free version of EA LIUK TREND. The different is only this is limited use only, maximum 100 trades. But not limited for back test purpose. Lot will be only 0.01. For more detail in original version, please visit : https://www.mql5.com/en/market/product/86874
EA LIUK TREND The best way to get profit in trading is to follow the Market trend. Good money management is important too to keep your investment save, by minimizing the Draw Down. With this EA LIUK TREND, you will be able to c
FREE

Function Indicate Buy Sell Signals Indicate Strength of Buy Sell Signals This system is for both type of traders (Short & Long Term) Instead of Other Calculations, Parabolic Sar & Awesome are also used In Any time frame this can be use. What is in for Trader? Trading Switch: Short Term & Long Term Finally, we all knows that Forex Trading needs completely concentrate & proper cash management, So I never promising that my program will never give you loss but I tried well to provide good and respo
FREE

Panel Display is a free utilities indicator, to display basic account information, in a beautiful way. This indicator is a plug and play, where the is no input required except for display corners. User can quickly engage how much profit/loss for current day / week! This Week's Performance - This week closed order for all pairs. Today's Performance - Today's closed order for all pairs. Current Floating Profit / Loss - Current Floating Profit/Loss (all pairs) in the account
FREE
Der MetaTrader Market ist die beste Plattform für den Verkauf von Handelsroboter und technischen Indikatoren.
Sie brauchen nur ein gefragtes Programm für die MetaTrader Plattform schreiben und schön gestalten sowie eine Beschreibung hinzufügen. Wir helfen Ihnen, das Produkt im Market Service zu veröffentlichen, wo Millionen von MetaTrader Benutzern es kaufen können. Konzentrieren Sie sich auf dem Wesentlichen - schreiben Sie Programme für Autotrading.
Sie verpassen Handelsmöglichkeiten:
- Freie Handelsapplikationen
- Über 8.000 Signale zum Kopieren
- Wirtschaftsnachrichten für die Lage an den Finanzmärkte
Registrierung
Einloggen
Wenn Sie kein Benutzerkonto haben, registrieren Sie sich
Erlauben Sie die Verwendung von Cookies, um sich auf der Website MQL5.com anzumelden.
Bitte aktivieren Sie die notwendige Einstellung in Ihrem Browser, da Sie sich sonst nicht einloggen können.