Watch the Market tutorial videos on YouTube
How to buy а trading robot or an indicator
Run your EA on
virtual hosting
virtual hosting
Test аn indicator/trading robot before buying
Want to earn in the Market?
How to present a product for a sell-through
Expert Advisors and Indicators for MetaTrader 4 - 60

Currency Explorer is the absolute tool for traders that want to know with quantified certainty the currency strength & weakness of each currency and to trade these by using applicable strategies. Our machine learning models run and provide the strength/weakness of each currency based on multiple factors besides price action. It provides the trader with a QUANTIFIED result for the strength of the 8 most popular and major currencies (EUR, USD, JPY, GBP, AUD, NZD, CAD and CHF) with a scale from 0-1
FREE

Enhance your trading and add more excitement with the new version of the RSI Scanner! Automatic Instrument Grouping: The scanner automatically collects all instruments from your Market Watch and organizes them into four categories: Majors, Minors, Exotics, and Others. Customizable Signal Selection: On the settings page, you can choose which instruments you want to scan for signals. Flexible Timeframe Selection: You can also specify the timeframes you wish to monitor for signals. RSI Parameter
FREE

ATR on Prices is simply an ATR indicator that plot a line for Resistance and Support using the Average True Range calculation. You can set the ATR daily periods, to be calculated. As well you can set the reference price to add and subtract the ATR measure to obtain the ATR Top and ATR Bottom lines, using the Open Price (that is fixed) or the Middle (HL/2) price (that will vary on the day) Or adding the ATR to the daily low and subtracting it from the daily high . You can use full ATR measure or
FREE

This indicator resolves an unrecognised defect in the Commodity Channel Index Oscillator (CCI). The CCI is based on a high pass filter calculated by subtracting the p-period simple moving average of a price signal (usually typical value) from the price signal itself. Then, the result is divided by the absolute mean deviation of the same period. The frequency response of a signal minus its simple moving average is shown in the first screen shot (in Blue). (see my free indicator : Q n D Frequency
FREE
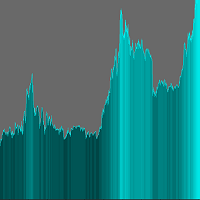
The indicator adds an overlay to the graph to create a histogram.
There are no parameters to set.
On the chart you can choose the color in the upper right corner by clicking on the appropriate brick.
The histogram is shaded depending on the price value.
Remember to set a line chart (shown in the screenshot). ........................... I invite you to purchase.
FREE

For traders, monitoring price movements is a constant activity, because each price movement determines the action that must be taken next. This simple indicator will helps traders to display prices more clearly in a larger size. Users can set the font size and choose the color that will be displayed on the chart. There are three color options that can be selected to be displayed on the chart.
FREE
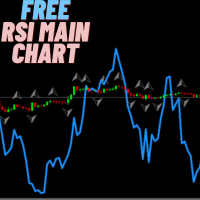
This indicator functions similarly to the traditional Relative Strength Index (RSI), but it's integrated directly onto the main price chart. This setup allows traders to more easily identify price fluctuations and recognize conditions of overbought or oversold markets. By observing the indicator in conjunction with price movements, you can gain valuable insights into potential trend reversals or continued momentum. Keep an eye on these signals to enhance your trading strategy. Happy trading, eve
FREE
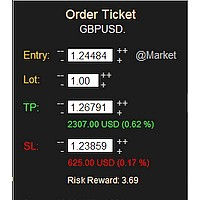
MONEY MANAGEMENT IS A CRITICAL COMPONENT OF SUCCESSFUL TRADING
One of the most important aspects of money management is risk management. YOU need to have a clear understanding of the risks associated with your trades, and mitigate those risks. This free MT4 indicator allows you to efficiently and easily protect your capital and avoid catastrophic losses. Download it and use it before every single trade! ***Please comment, rate and share it to your friends if you like it***
Tags: money managem
FREE
The purpose of this new version of the MT4 standard indicator provided in your platform is to display in a sub-window multiple timeframes of the same indicator. See the example shown in the picture below. But the display isn’t like a simple MTF indicator. This is the real display of the indicator on its timeframe. Here's the options available in the FFx indicator: Select the timeframes to be displayed (M1 to Monthly) Define the width (number of bars) for each timeframe box Alert pop up/sound/ema
FREE

Having to check constantly if your Stochastic has reached a specific level can be tedious and draining at times, especially if you have to monitor different asset classes at a time. The Alert Stochastics indicator will assist in this task, ensuring that you get the most with little effort. When the Stochastic values get to a specified level, the alerts will go off, on the chart, on the MT4 phone app or via email (You can receive text messages to your phone if you activate texts on your Gmail acc
FREE

Kita Biikin acak saja karena ini adalah Ea untuk percobaan apakah bisa hasil compile SQuant di upload ke MQL5, dan hasilnya ternyata bisa . Find out how to add the product description . Product rating in the Market depends on the built-in editor . If your product has inputs, add them as a list of parameters with descript ou can freely edit data on all tabs. Don't forget to save your changes. Fill in all the information about your Product and send it for the moderator check using the "Ready"
FREE
Use Forex Trading Profit Tracker to keep a record of your earnings across accounts. This indicator will show a dashboard in the Meta Trader chart to show for the profit or loss money in your account. It’s easy to see just how much money you’re making matched betting with the Forex Trading Profit Tracker. Key features: Track your profit over time Check out your stats. Track expected profits against actual profits. Export account history to Excel.
MT5 version(*): https://www.mql5.com/en/market/
FREE
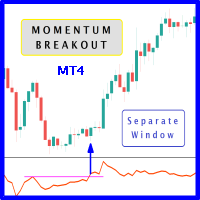
When prices breakout resistance levels are combined with momentum oscillator breaks out its historical resistance levels then probability emerges to record farther prices. It's strongly encouraged to confirm price breakout with oscillator breakout since they have comparable effects to price breaking support and resistance levels; certainly short trades will have the same perception. Concept is based on find swing levels which based on number of bars by each side to confirm peak or trough and in
FREE

Diversify the risk in your trading account by combining our Expert Advisors. Build your own custom trading system here: Simple Forex Trading Strategies
The expert advisor opens trades after CCI indicator exit the oversold or overbought areas. The Stop Loss, Take Profit, and Trailing Stop are calculated based on the ATR indicator. The recommended currency pair is GBPUSD and the recommended timeframe to operate and to do backtests is D1. This Expert Advisor can be profitable in any TimeFrame a
FREE
Loop Pattern EA is an automatic long term strategy trader. Minimum trading account 10,000. Best performance on GBPUSD 1h. This EA calculates amount of candles back controllable by the user and applies certain function:
if (calculate_Green_Body()>calculate_Red_Body() && calculate_Green_High()<calculate_Red_Low() && newcandle()) { buy(); } ... There are no stoploss or takeprofit and the trades closes then the opposite signal arrives. this EA operates only once per bar
FREE
StarkerFX EA is a martingale and trend following robot with trailing stop . This expert advisor is using MACD and Parabolic SAR indicators. There are no complicated settings. The only one input is the equity multiplier for automatic lot calculation. If you want to change it, please backtest it before using on real account. higher equity multiplier = higher lots = higher risk (recommended setting is: 1.0) This EA has been optimized for EUR/USD currency pair and for M5 timeframe. Feel free to ba
FREE

This is a simple and free Expert Advisor that trades candlesticks. It compares several nearest bars and their volumes, and opens a trade based on that data. Unlike the professional version , it analyzes only 1 timeframe. The recommended timeframes for this EA are H1, H4, D1, it works with any currency pairs. The parameters always need to be optimized before trading, as well as after some period of trading.
Input Parameters Lots - lot size (if Lots=0, then the lot will be calculated based on the
FREE
Close All Charts – Instantly Close All Open Charts in MT4 Declutter your workspace and improve efficiency with Close All Charts , a simple yet powerful script that instantly closes all open charts in MT4 with a single click. No more manually closing charts one by one—this tool helps you manage your trading environment effortlessly. Key Features: One-Click Chart Closure – Instantly close all open charts in MT4 with a single action.
Streamlined Workspace – Remove unnecessary charts for a c
FREE

This indicator is designed for calculating the value of points for the specified lot sizes. The MT5 version is here https://www.mql5.com/en/market/product/29230 Description by lines Line 1 - deposit currency. Line 2 - lot size (10 input parameters) . All further values are calculated into columns below each lot size. Line 3 - calculation of value for one point. Line 4 - calculation of value for spread. All subsequent lines - calculation of value for points (20 input parameters) . All you need t
FREE

MQLTA Support Resistance Lines is an indicator that calculates the historical levels of Support and Resistance and display them as Lines on chart. It will also Alert you if the price is in a Safe or Dangerous zone to trade and show you the distance to the next level. The indicator is ideal to be used in other Expert Advisor through the iCustom function. This DEMO only works with AUDNZD, the full product can be found at https://www.mql5.com/en/market/product/26328
How does it work? The indicator
FREE

For the convenience of traders, many features have been added to make trading more comfortable and secure.
The Expert Advisor has a built-in author's indicator of protection against unidirectional grid.
Recommended tools : USDCHF; GBPUSD;
EURUSD;
USDJPY;
USDCAD;
AUDUSD;
EURJPY;
recommended minimum mm and settings: usdchf, deposit = $ 1000 , lot = 0.01 , expected annual profit on the instrument = 15-25% ;
GBPUSD , Deposit = $ 1000 , Lot = 0.01 , Expected annual profit on the i
FREE

The Future Price indicator shows the probable variants of a future price movement based on the searching for matches in the quotes history. The indicator works in two modes: the first iterates over and displays the specified number of variants, the second - the indicator displays one specified variant.
Settings Static_VARIANTS = 0; - display a specific variant; if = 0, iterates over all variants TOTAL_VARIANTS = 20; - the number of variants in the set, not greater than 30 is recommended Time_Se

This is a very fast and not redrawing ZiGZag; it supports switching the segments at breakouts of price levels located at a specified distance (H parameter) from the current extremum. MinBars parameter sets the depth of history for drawing the indicator; 0 means drawing on the entire history. SaveData parameter allows writing the coordinates of extremums to a file (time in the datatime format and price). Some statistics calculated on the basis of the ZigZag is displayed in the form of comments.
FREE

Kusama is an automated trading system that uses and candlestick patterns in combination with Standard Deviation calculations to open and close trades. This Expert Advisor is designed specifically for the USDJPY H1 Foreign Exchange(FX) market to open, monitor, modify and adjust orders automatically.
Entry signals utilize Shooting Star Candlestick patterns and Hammer Candlestick patterns . Long Exit Signals work on the Bearish Engulfing Candlestick patterns in combination with Standard Deviati
FREE

Vertical time lines. A simple indicator that draws on the graph vertical lines of time. 1,3,5,10,12,15,20,30,60 minutes. You can change the line color, line style, select a time period from 1 to 60 minutes. Applies to any chart, timeframe. Incoming parameters: Minute_Num = 20; // step 3,5,12,10,20,15,30,60 minutes color Line_Color = clrYellow; // color line Line_Dash = 2; //0,1,2,3,4... solid, dash, dot, dash dot,dash dot dot
FREE
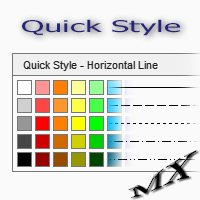
The Quick Style utility is designed for facilitation and acceleration of working with the properties of graphical objects. Left-click a graphical object while holding the Shift key to open the quick access window for configuring the object properties. In the window, you can change the color, style and line width with one click, including those of other graphical objects. All changes are displayed immediately. To close the Quick Style , simply click the free space on the chart. The utility is eas
FREE

This indicator filters the Zigzag indicator to calculate the main support and resistance
levels.
Variables
minimum gap between peaks : is the distance (GAP) between the peaks of
the Zigzag
peaks sensitivity : Minimum number of nearby peaks
look back: it means that it has to test the last 50 peaks in the Zigzag
object name perfix: a prefix for level’s line name on chart
FREE
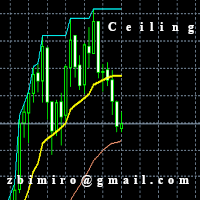
The "Ceiling MT4" indicator has been designed to determine the exit point from the market and it is based on a moving average set in parameters and shows 3 lines. 1. Ceiling lines, that is the highest / lowest value currently achieved on the chart in the horizon set in the "Plafon Horyzon" parameter. 2. The "Signal" line that shows the line shifted to the part specified in the "Signal_Part" parameter is set by default to 2, which means that it is halfway between the moving average and the plafon
FREE

The parabolic stop and reverse (PSAR) indicator was developed by J. Welles Wilder, Jr. as a tool to find price reversals which can be utilized as stop-loss levels as well as trade triggers. The notable difference about the PSAR indicator is the utilization of time decay. The PSAR indicator forms a parabola composed of small dots that are either above or below the trading price. When the parabola is below the stock price, it acts as a support and trail-stop area, while indicating bullish up t
FREE
This simple but useful script calculates the lot in % of the deposit. It is indispensable for risk management. There is only one customizable parameter: MaxRisk - risk in % for lot calculation. The product works as a standard script. Launch it once on an appropriate chart and start trading using the calculated lot value. Genious is simplicity! Happy trading!
FREE

As we know, МТ4 and МТ5 do not store tick history, which may be necessary to develop trading strategies and market analysis. I have developed a method allowing you to receive tick history very easily. The indicator gathers tick history in real time and writes it to XXXXXX2.hst file, where XXXXXX is a symbol name. This file can be used to create an offline chart or something else. If you use a trading robot, then launch the indicator and control your broker by examining the spread and quotes. All
FREE
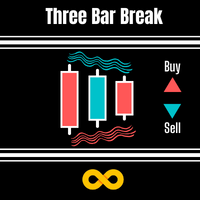
DESCRIPTION 3 Bar Break is based on one of Linda Bradford Raschke's trading methods that I have noticed is good at spotting potential future price volatility. It looks for when the previous bar's High is less than the 3rd bar's High as well as the previous bar's Low to be higher than the 3rd bar's Low. It then predicts the market might breakout to new levels within 2-3 of the next coming bars. Must also be traded during the active hours of the market you want to trade. EG EURUSD 7am - 5pm This
FREE
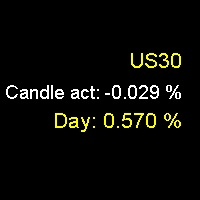
Daily Percentage and Current Candle Would you like to know how much an asset has risen or fallen in a day or in the last candle? Do you want a numerical reference for the strength and direction of price movement? Then, the Daily Percentage and Current Candle indicator is the tool you need. The Daily Percentage and Current Candle indicator shows you the percentage increase or decrease of an asset in the current day or in the last candle, depending on the timeframe you choose. The indicator allows
FREE

What is The Commitment of Traders (COT)? The Commitment of Traders (COT) report is a weekly publication of net positions in the future market that is released on Fridays by CFTC commission. It is an outline for the commitment of the classified traders as commercial traders, speculators (non-commercial traders), and non-reportable traders. We use this report to understand the dynamics of the market. The commitment of commercial traders is not important for us because they take a position to he
FREE
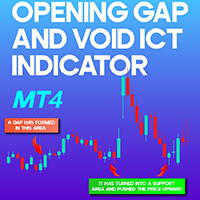
Opening Gap and Void ICT Indicator MT4 The Opening Gap and Void ICT Indicator MT4 for MetaTrader 4 is specifically developed to identify price gaps that occur between trading sessions. A gap forms when a candlestick’s opening price significantly differs from the prior candlestick’s closing price.
This indicator automatically marks these price gaps on the chart. Once the market fills a gap, the indicator removes it, ensuring only unfilled zones remain highlighted. «Indicator Installation & User G
FREE

Free version of https://www.mql5.com/en/market/product/44606 Simple indicator to calculate profit on fibonacci retracement levels with fixed lot size, or calculate lot size on fibonacci levels with fixed profit. Add to chart and move trend line to set the fibonacci retracement levels. Works similar as default fibonacci retracement line study in Metatrader. Inputs Fixed - select what value will be fix, lot or profit (available in full version, lot is set on free version) Fixed value - value t
FREE

Candlestick Oscillator is a truly unique Oscillator that uses the concepts of within candlestick trading called the Record Session High. This is a method of analysing candlesticks to gauge when a trend might be wearing out and therefore ready for reversal or pause. We call it a record session high when we get 8 or more previous candles that have higher closes. We call it a record session low when we get 8 or more previous candles that have lower closes.
We don't rely on the typical Oscillation
FREE

Price Predictor is an indicator that shows precise price reversals taking into account a higher time frame and a lower time frame candle patterns calculations it is great for scalping and swing trading . Buy and sell arrows are shown on the chart as for entry signals. BIG Arrows indicates the trend - SMALL Arrows signal a trade (BUY/SELL) - A Green BIG UP Arrow with a support green line indicates a Bull Market : wait for buy signal - A Green SMALL Up Arrow after a BIG green arrow is

I have designed a logic based on the widely used RSI indicator in Forex trading. Normally, it is well known that entering trades when the RSI value is overbought or oversold is effective, but it is not very effective when the trend reverses. Therefore, as a countermeasure, this EA (Expert Advisor) enters counter-trend trades after entering based on the RSI value. In other words, it uses a grid order strategy, but instead of placing orders at fixed intervals, it places additional sell orders when
FREE

Odie Trade Manager EA is a simple semi-automatic (two in one) assistant for a manual trader, when having a losing trade the EA begins its work in the form of a martingale or hedging (recovery zone) to leave it in breakeven or positive, it depends on its configuration.
For professional traders and gamblers .
Adapt it to your strategy, MANAGE YOUR RISK CORRECTLY and all your operations will be positive.
TEST ON STRATEGY TESTER WITH YOU STRATEGY AND CREATE YOUR SET FILE AND... GOODBYE LOSSES.
FREE

This indicator calculates average speed of moving average indicator. Here is parameters: BarsToProcess - indicator calculating period; MaPeriod - period of Moving Average indicator; AveragingPeriod - period (MA values) of the basis of which the average value is calculated; MA_Method, MA_Apply_to - using to set MA indicator parameters; Thats all! Good luck.
FREE

Индикатор для синхронизации и позиционировании графиков на одном и более терминалах одновременно. Выполняет ряд часто необходимых при анализе графиков функций: 1. Синхронизация графиков локально - в пределах одного терминала при прокрутке, изменении масштаба, переключении периодов графиков, все графики делают это одновременно. 2. Синхронизация графиков глобально - тоже самое, но на двух и более терминалах, как МТ4, так и МТ5. 3. Позиционирование графика на заданном месте при переключении периодо
FREE

It's a simple but useful tool for creating a grid based on Envelopes.
Only 2 parameters can be set: 1) "Period" - the period of all visible Envelopes (i.e. 4) and 1 Moving Average (Envelopes axis), 2) "Deviations Distance" - the distance between Envelopes.
Naturally, the colors of all 9 lines can be changed as desired. It works with everything that is available in your Market Watch.
Good luck!
FREE
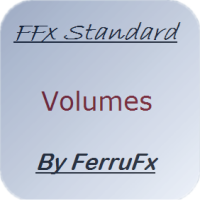
The purpose of this new version of the MT4 standard indicator provided in your platform is to display in a sub-window multiple timeframes of the same indicator. See the example shown in the picture below. But the display isn’t like a simple MTF indicator. This is the real display of the indicator on its timeframe. Here's the options available in the FFx indicator: Select the timeframes to be displayed (M1 to Monthly) Define the width (number of bars) for each timeframe box Alert pop up/sound/ema
FREE

RaysFX StepMA+Stoch Caratteristiche Principali Adattabilità: Il nostro indicatore RaysFX StepMA+Stoch è progettato per adattarsi alle mutevoli condizioni di mercato. Utilizza l’Average True Range (ATR) per misurare la volatilità del mercato e regolare di conseguenza le sue strategie di trading. Precisione: L’indicatore genera segnali di trading quando la linea minima incrocia la linea media. Questi segnali sono rappresentati come frecce sul grafico, fornendo punti di ingresso e di uscita chiari
FREE
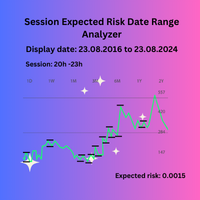
Session Expected Risk Date Range Analyzer: Analyzes price data across specified date ranges to provide detailed insights into financial risk and volatility, using each bar's price metrics for accurate risk assessment.
The Session Expected Risk Date Range Analyzer is a sophisticated tool designed to offer traders and analysts detailed insights into the expected financial risk across specific date ranges. Unlike traditional session-based analysis, this indicator focuses on calculating risk metr
FREE

Introduction and Description
Colored candlesticks showing the trend based on two moving averages and the slope of the slow moving average. A trend is the overall direction of a market or an asset's price. In technical analysis, trends are identified by trendlines or price action that highlight when the price is making higher swing highs and higher swing lows for an uptrend, or lower swing lows and lower swing highs for a downtrend. Many traders opt to trade in the same direction as a trend, whil
FREE

Triple Exponential Moving Average Technical Indicator (TEMA) was developed by Patrick Mulloy and published in the "Technical Analysis of Stocks & Commodities" magazine. It works as the same as EMA. However, it provides smaller lags, even compared to Double EMA. Input Description: period: MA's period. Must be higher than 1. applied_price: Define the price to be applied. Use 1 of these integers. 0 -> applied_price is Close price 1 Open price 2 High price 3 Low price 4 Median price 5 Typical price
FREE
It is based on Surfing strategy. USES MARTINGALE. The EA catches the moments when the previous candle crosses the moving average indicator and eliminates the false breakouts using the RSI+MA indicator, and at the same time analyzes the trend direction. The EA trades pending orders, which also allows to avoid false movements. If the pending order was not triggered and the chart reversed, then the EA deletes the pending order. If the pending order was not triggered and the chart reversed, then the
FREE

The EJ_15_201514104_S_SM_CF_SQ4 is an algorithmic trading strategy for MetaTrader, tested on EURJPY using the M15 timeframe from April 1, 2004, to April 24, 2024. There is no need to set up parameters, all settings are already optimized and fine-tuned.
Recommended broker RoboForex because of EET timezone.
You can find the strategy source code for StrategyQuant at the link: https://quantmonitor.net/eurjpy-awesome-oscillator-master/
Key details are:
MagicNumber: 201514104
Main Chart: Curre
FREE

Are You Tired of Break Even Turning into a Winning Trade Without You? Unwickable Stop Loss (USL) Keeps You In The Trade! You've meticulously planned your trades, exercised patience, and entered at the 'perfect' moment. As the trade moves in your favour, you move your stop loss to break even, feeling secure with no capital at risk. But then, the market takes an unexpected turn, stops you out, and proceeds in your intended direction (see Screenshot A). Ever wonder what could be done differently?
FREE

The Buyside & Sellside Liquidity indicator aims to detect & highlight the first and arguably most important concept within the ICT trading methodology, Liquidity levels. SETTINGS
Liquidity Levels
Detection Length: Lookback period
Margin: Sets margin/sensitivity for a liquidity level detection
Liquidity Zones
Buyside Liquidity Zones: Enables display of the buyside liquidity zones.
Margin: Sets margin/sensitivity for the liquidity zone boundaries.
Color: Color option for buysid

Индикатор "Buy Sell zones x2" основан на принципе "остановка/разворот после сильного движения". Поэтому, как только обнаруживается сильное безоткатное движение, сразу после остановки - рисуется зона покупок/продаж. Зоны отрабатывают красиво. Или цена ретестит зону и улетает в космос, или пробивает зону насквозь и зона отрабатывается с другой стороны так же красиво. Работает на всех таймфреймах.
Лучше всего выглядит и отрабатывает на Н1.
Может использоваться как: индикатор зон, где лучше вс
FREE

The Sextet is an MT4 indicator that displays 6 levels of Moving Averages, where the second is the moving average of the first, the third of the second, and so on. It gives a signal when all the moving average levels align in order. Get a Free Sextet EA, and read discussions about using The Sextet Indicator on Forex Factory:
The Sextet EA @ Forex Factory Check out the The Sextet Scalper Pro for a more elaborate scalping strategy also with Free EA . Key Features: Is a Moving Average of a Movin
FREE

Sirius is a simple Expert Advisor that uses Price Action level conditions from the MACD Indicator for opening trades with managing and closing trades based on TEMA and BBWR. Though the algorithms are constantly monitoring the opening and closing of trades, the TP and SL will close on signals and ATR range with possible BE or trailing. The EA was created using advanced Artificial Intelligence combined with simulated walk forward designs. Recommended pairs are listed below. Working on ot
FREE

Trend Monkey is an EA that integrates various strategies such as trend identification, grid, and hedging. After using it, I believe you will be able to start your journey of wealth. This is the free version, you can download the professional version. This EA trades based on trends, so trading is not very frequent, and you need to wait until a clear trend appears.
Feature Spread requirements are not particularly demanding, general platforms can run Follow trends, use trends to trade Using hedgi
FREE

EA scans trades by magic numbers from trading robots in mt4 terminals.
Then it passes the data on trades to EA`S HOLDER which filters the entry and exit signals by applying its own filters for opening and closing orders. Thus EA`S HOLDER conducts its trading based on the signals of running robots. Opening your own orders. Your trading robots transmit signals to this scanner. The scanner transmits signals to the senior EA and you have a lot of opportunities. Such as:
- Maintain
FREE
This indicators when combine with its slave version can help you a better view in backtesting visual mode. https://www.mql5.com/en/market/product/61574 They will help you in developing a multi time frame trading strategy. 1) Run backtest in visual mode 2) Add the master indicator to the backtesting chart 3) Add the slave indicators to other charts of the same symbol with different time frames. Run the backtest and you will see all the charts auto scrolling.
FREE
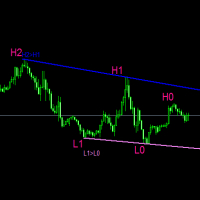
#forex #sharemarket #trading Disclaimer :- My videos, presentations, and writings are strictly for educational purposes and should not be considered investment advice. I cannot guarantee the accuracy of any information provided. It is essential to conduct your own research and consult a qualified financial advisor before making any investment decisions. I bear no responsibility for any financial losses or negative outcomes resulting from the use of my content. Please exercise caution and seek
FREE

Full Force WSK is a multicurrency EA that is optimized to trade on specific Gaps on market open using intelligent algorithm looking for daily volume and gaps pattern variation optimized for the last years for 14 forex pairs.
Trading Strategy:
FullForce WSK is fully optimized for the following pairs:
Majors: EURUSD / GBPUSD / USDCHF / USDJPY
Minors: AUDCHF / CADCHF / CADJPY / CHFJPY / EURCHF / EURGBP / EURJPY / GBPAUD / GBPCHF / GBPJPY
We really do not recommend any other pair because ou
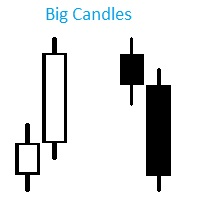
Индикатор Big Candles показывает кратное превышение размера свечи относительно среднего показателя рассчитанного за определенный период. Индикатор отмечает размер свечи на графике в пипсах и сигнализирует о появлении “большой” свечи. Описание параметров: HistoryBars - Количество баров для отображения индикатора countN - Период расчета среднего размера свечи f actor - Во сколько раз длина свечи превышает средннее значение, для отображения сигнала
FREE

This is the script needed to use The News Filter . This script selects any chart that you want to filter and sends the inputs to The News Filter program. Every input is specific to that chart, so you have the flexibility of setting different inputs for every chart. Links to The News Filter (free demo) can be found below: The News Filter Guide + Download Links
News selection News source is Forex Factory's economic calendar . Feature to add your own custom news events . Selection can be based o
FREE

EA will trade base on manual entry. It will do martingale if your position in losses. There are no backtests available. This is a semi-automated EA that requires human intervention or initial order to be triggered by user. The main purpose of this EA is to open trade in the same direction with bigger lot size when initial trade losses. It is barely impossible for human being to trade like this 24 hours a day. This technique is well known to many trades and many use it to recover their losses. Ho
FREE

The presented indicator is the author's implementation of the classic trading idea: Moving averages of different periods diverge over time on a strengthening trend and converge on a weakening trend. The proposed product allows you to clearly demonstrate: The direction of price movement; Temporary price rollbacks; Zones of multidirectional price movement. Namely: The indicator lines go up and diverge from each other - a strong bullish trend; The indicator lines go down and diverge from each othe
FREE

Forex Flakes is a powerful trading robot designed to help traders maximize their profits in the forex market. Using advanced algorithms and cutting-edge technology, Forex Flakes employs the martingale strategy to keep a safe distance between trades and double the lots until the position is closed with a profit.
The martingale strategy is a popular technique in forex trading that involves increasing the trade size after each loss, in the hopes of recouping previous losses with a single trade. F
Stoch–Cross Scalper is an Expert Advisor based on the Stochastic oscillator indicator using the 80 threshold as overbought and 20 as oversold while utilizing a 14 day rolling period to analyze High and Low closing prices in relation to the current close price. The Stochastic oscillator is a commonly used indicator and many trading philosophies are based upon it. This expert is the result of over ten years of my fine tuning and perfecting this trading system. Almost all of the indicators availabl
FREE

This indicator is designed to detect the best divergences between price/MACD and price/RSI. MACD and RSI produce by far the best divergence signals therefore this indicator focus on those two divergences. This is the FREE version of the indicator: https://www.mql5.com/en/market/product/28375
Important Information How you can maximize the potential of the scanner, please read here: www.mql5.com/en/blogs/post/718074
The free version works only on EURUSD and GBPUSD! This indicator scans for you u
FREE

I came up with an idea for an EA, so let's put it in English.
Here's the logic:
First, wait for a candlestick to touch either the upper or lower Bollinger Band.
When it touches, don't enter immediately.
For a SELL entry, wait for the price to touch the upper band, then if the closing price moves inside the upper band, initiate the SELL order.
For a BUY entry, it's the opposite.
The default number of orders to hold simultaneously is set to 5.
In other words, all orders will close at a tota
FREE

!!! In [CodeBase] I published Mql4 indicator code. Download the code for free!!! (You have to adapt the code when you update the terminal).
This indicator is a trader's tool. It shows the movement of stochastics on all periods and symbols: М1, М5, М15, М30, Н1, Н4 every minute (the time scale from the current to -240 minutes, i.e. tha last 4 hours). Step_Stoch overcomes the disadvantage of stochastic indicators - lagging. For example, a rise after a fall on H1 (or M30) after can be seen on a usu
FREE

The Unreal Engine Official MQL5 Channel
https://www.mql5.com/en/channels/theunrealengine contribution of profitable patterns by you are welcome ,You will find the discussion group in the channel. Please Read The Robot description carefully. It's not the usual yada yada!
What is The Unreal Engine? The Unreal Engine is a revolutionary EA designed to trade static patterns. The difference between other neural networks robots and the Unreal Engine is that the user can set his own p
FREE
The MetaTrader Market is the only store where you can download a free demo trading robot for testing and optimization using historical data.
Read the application overview and reviews from other customers, download it right to your terminal and test a trading robot before you buy. Only on the MetaTrader Market you can test an application absolutely free of charge.
You are missing trading opportunities:
- Free trading apps
- Over 8,000 signals for copying
- Economic news for exploring financial markets
Registration
Log in
If you do not have an account, please register
Allow the use of cookies to log in to the MQL5.com website.
Please enable the necessary setting in your browser, otherwise you will not be able to log in.