YouTubeにあるマーケットチュートリアルビデオをご覧ください
ロボットや指標を購入する
仮想ホスティングで
EAを実行
EAを実行
ロボットや指標を購入前にテストする
マーケットで収入を得る
販売のためにプロダクトをプレゼンテーションする方法
MetaTrader 4のためのエキスパートアドバイザーとインディケータ - 57

This indicator filters the Zigzag indicator to calculate the main support and resistance
levels.
Variables
minimum gap between peaks : is the distance (GAP) between the peaks of
the Zigzag
peaks sensitivity : Minimum number of nearby peaks
look back: it means that it has to test the last 50 peaks in the Zigzag
object name perfix: a prefix for level’s line name on chart
FREE

In physics, "Jerk" is the third time-derivative of position, with acceleration being the second derivative and velocity the first derivative. In technical analysis, the first derivative of price is the price momentum, with the second derivative,acceleration, being seldom used and the third derivative virtually unknown. The magnitude frequency response of a digital differentiator is a positive-slope straight line passing through zero frequency. Therefore, every instance of a digital signal differ
FREE

Indotrend is a Smart indicator to detects the Trend and also view support & resistance, multiple timeframe to get validate the trend. it can be use for Forex,Index,Metal,Stock and Crypto. Parameters: Alerts - show popup alert message on Metatrader Hi Lo H1 Timeframe - Show LIne Hi/Low Price base on H1 timeframe Show Fibonaci level - Show Fibonaci retracement level
Show Support Resistance, - Show Support & Resistance H1 timeframe.
FREE
The "Open grid of pending orders" script is designed to automate the process of creating buy (Buy) and sell (Sell) orders on the MT4 trading platform. It provides the user with the ability to set the distance between orders and the number of orders in this grid. This script allows traders to quickly build a grid of orders that covers a specific price range. The main functions of the script include: Ability to select the direction of orders: Buy (purchase) or Sell (sale). Setting the distan
FREE
Description
The base of this indicator is an ZigZag algorithm based on ATR and Fibo retracement. This indicator is not redrawing in sense that the ZigZag's last shoulder is formed right after the appropriate conditions occur on the market. The shoulder doesn't change its direction afterwards (can only continue). Note: An indicator with advanced possibilities is also available.
Indicator input parameters
The input parameters allow to change the sensitivity of the ZigZag. ATR period ATR mul
FREE
The Light Pullback Breakout Trading can determine the breakdown of price highs and lows and trade after a small pullback (depending on settings). It does not use risky methods, there are not as many settings as in the advanced version , but this EA is free and can trade on all currency pairs and timeframes. There are various settings for finding lines and filters for transactions. Full (extended version): https://www.mql5.com/en/market/product/41327 Differences from the free one: customizable
FREE

The Expert Advisor of the Forex Fraus family, the system is designed for scalping the EUR/USD pair on the M1 timeframe (for five digit quotes), and adapted for the accounts with fast execution of orders.
Operation Principle Buys at the extreme Lows and sells at the extreme Highs of the Stochastic indicator values. When a signal is received the orders are opened by injection, using tick data. Positions are closed by Trailing Stop Not closed positions are closed at the opposite trade Built-in ad
FREE

Parabolic SAR extreme When the Parabolic SAR value indicates an uptrend or downtrend, the EA will open a buy or sell trade respectively, given that all other criteria are met This EA allows you to set up to 21 separate Parabolic SAR criteria for the EA to work on There are 3 input parameter sets (SAR1, SAR2, and SAR3) Each set allows you to determine the parameters (such as the step and max step) for each set And within each set, you get to indicate up to 7 timeframe for the EA to operate in
FREE

The indicator shows De Mark patterns and gives trading signals in the form of arrows and alerts. Shows De Mark lines on the history of quotes. Has a multiframe., Can show DeMark patterns of higher timeframes on lower timeframes. Has a switchable function for displaying fractals. Trading signals are accompanied by sound alerts, as well as sending them to mail and mobile devices.

Indicator that alerts by push notification to the mobile phone or by alert on the platform of the touch of the candle with the selected average. The alarm can be set to receive "x" seconds before the candle closes. Specially suitable for those who cannot or want to spend a lot of time in front of the screens to see a movement start from a moving average and therefore miss the movement. You can configure any average method and the time to receive the alert before the candle closes.

"Make it Horizontal" will convert any trendline to horizontal by just selecting it and then pressing the H key. This tool must be included in your charts as an indicator. It has no inputs, just drag it to your charts and that's it! I created this tool because the MT4 doesn't have any built-in feature like this. How many times have you drawn a line and you need to double click it in order to configure the start and end price level so you can make it horizontal? Well, that's not an issue anymore!
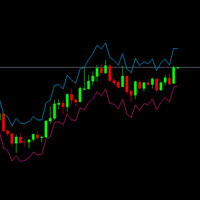
For all temporalities and all charts. Based on the ATR indicator. Calculates and draws on the chart the appropriate points to place Stop Loss or Take Profit according to the current market volatility. The following inputs can be adjusted for a more customized use of the indicator: ATR_Period: number of previous candles to be taken into account for the calculation. ATR_Multiplier: Number by which the ATR will be multiplied to draw the points on the chart. A low multiplier will mean a high risk a

VWAP Bands Metatrader 4 Forex Indicator
The VWAP Bands Metatrader 4 Forex indicator is a quite similar to the Bollinger bands, but it deploys volume weighted average as the core value of the bands. There is an option of using the tick volume or real volume for calculation when using the VWAP Bands Metatrader 5 custom forex indicator, especially when the forex broker displays symbol alongside real volume. Similarly, you can decide to have deviations calculated with the sample correction or not
The RMI Scalper EA is a fully automated Expert Advisor that trades pullbacks from the major trend using RMI and limited averaging. The EA trades using market orders and uses averaging to safely turn otherwise negative trades positive. This EA works best on USDJPY, EURUSD, GBPUSD, USDCAD, USDCHF, AUDJPY, EURCAD, EURGBP and EURJPY using the M30 timeframe and has the option to trade multiple pairs but only one pair at any one time to increase trade frequency without increasing draw down.
Please no
FREE

Some candles have a strong tendency to continue the movement or to revert it. With the help of the Colored candles indicator such movements are clearly visible. This indicator calculates the parameters of each candle, as well as its volume, and after that it paints the candles depending on its strength and direction. Bullish candles are colored green and bearish candles - red. The greater the power of the bulls or the bears, the brighter the color. You can change the colors if you want. The indi

This is an implementation of the market cycle indicator described by Raghee Horner in the book "Forex Trading for Maximum Profit" . The current state of the market can be determined by analyzing the inclination angle of the exponential moving average (EMA) running on a period of 34 bars. If the EMA inclination is defined as the direction of the hour hand on the dial from 12 to 2 hours, then an uptrend is considered to be present; from 2 to 4 hours, the market consolidates; from 4 to 6 hours, a d
FREE

Automated medium-term Expert Advisor. It is based on Bollinger Bands . The EA is optimized for EURUSD H1 . The robot should be optimized for use on other instruments. The Expert Advisor does not use hedging, martingale, grid, arbitrage etc. The results obtained in the strategy tester are identical to the results of real trading. Since the results for Control points are close to results of optimization in every tick mode, the EA allows for quick optimization using Control points .
Parameters Mo
FREE

このEAは、マーケットの変動に関係せず安定したトレードをできるようにデザインされました。
M5のタイムフレームが最適です。上位足H1とH4の価格の変更を計算して、大きくトレンドが発生した後に、価格が戻されるタイミングを見てEntryします。
takeprofit と stoplossはあえて、広めに設定しておくのがコツです。1日1回のトレードにはちょうど良いですね。
そして、もし1回のトレードが負けてしまった場合、ロットサイズを2倍で再トレードの機会を待ちます。
もしトレードがtake profitでクローズした場合は、その日のトレードは終わりです。
また次の日になるまでEAは停止します。
今まで、数多くのトレードを重ねて大きなドローダウンや損失を出してきた反省からこのEAはつくられました。
初期設定ではtakeprofit =40pip, stoploss =40pipsの設定にしてありますが、最適な値に調整してください。
また、stoplossでオーダーがクローズした場合の次のロットサイズの倍率も変更可能です。
安定した利益をコツコツ重ねて大きな夢をつかみまし
FREE

Based on commonly used ZigZag indicators, in-depth mining was conducted on the indicators, with two main improvements: 1、 Annotate each ZZ price point; Annotate the distance points between adjacent ZZ points for a more convenient and intuitive view of price fluctuations. 2、 Draw a Fibonacci line for the current price direction of ZZ. The Fibonacci line includes two types: the Fibonacci retracement level and the Fibonacci expansion level. When the last four ZZ points comply with Dow's 123 rule,

Ichiichiichiku This EA trades based on the ADX, ADX rising/falling, Di+ and Di- difference, RSI, 5-timeframe 2-ichimoku conversion, base line, total 10 MAs indicators. Can trade single bets, can trade Martingale. This EA is suitable for all markets, including gold, indices, forex, and more.
======
一齊一齊一齊沽 此EA跟據 ADX, ADX 升緊/跌緊, Di+ 和 Di- Difference, RSI, 5 個 TimeFrame 2 條 ichimoku conversion, base line 指標共10條MA, 作出交易; 可玩單注, 可玩馬丁 此EA適用於所有市場, 黃金, 指數, 外匯......

automatically closes orders from a preconfigured number of pips.
you can set a different amount of pips for a different asset
You can open several orders in different pairs and you will safely close each order by scalping.
a friendly EA easy to use and very useful
open orders and don't worry about closing the orders since this EA will close automatically
close all trades profits
Price Alert Indicator PRO
Description:
Configurable price alert indicator for when the price crosses upwards or downwards.
Characteristics:
It can be configured one-way, or both ways.
Horizontal lines are used to indicate the level to which you want to be alerted.
On-screen buttons to hide or show the lines.
Alerts:
MT4 alert.
Push alert to mobile phone.
Zig Zag Swing Detector is a talking indicator tool, that let you track new highs and lows using Zig Zag patterns and allows you to react to new highs and lows. For example for uptrend each time there is higher hi spotted, the strength of the trend is increased. Trend is ended with lower low than the previous one. Be notified by Alerts, Speech and Notifications and be alerted about new highs/lows! You can also setup conditions to open trades automatically on new heights. Speech synthesis allows y

This is a multicurrency and multitimeframe indicator that calculates the angle between two points. Points for measuring the angle can be taken from the ZigZag (the last two points), or from the Moving Average (between two given bars), or it can be the closing prices of bars.
Angle measurement is possible in degrees or in radians. You can select the scale for the calculation. For a better understanding of the indicator, you can study the free Angle High Low indicator. In the parameters you can

News Filter EA that send you a Push notification to your MT4 phone APP and TURN OFF MT4 Automatically Before News. This EA doesn't work in backtest From 1.7 version the EA have Close all trades before news functions added.
You only need to allow that url in MT4 options: To see the url and how to add it to MT4, visit this post:
https://www.mql5.com/en/blogs/post/754402
When Metatrader is turned off, it saves the status of all the charts, indicators and Expert Advisors that you have in t

The Quality trend indicator expresses the ratio of the strength of a trend or the speed of its growth (fall) to the degree of its noisiness or a certain norm of amplitudes of chaotic fluctuations of a growing (falling) price. The position of the indicator line above zero shows an increasing trend, below zero - a falling trend, the fluctuation of the indicator line near zero shows a flat. If the indicator line begins to fluctuate rapidly around zero and approach it, then this indica

The indicator signals the appearance of a possible divergent bar based on the shape of the bar without angulation detection. A bullish divergent bar is a bar that closes in its upper half (the higher the better), has a lower minimum than the previous bar, and drops sharply away from the Alligator indicator. A bearish divergent bar is a bar that closes in its lower half (the lower the better), has a higher high than the previous bar, and moves up sharply from the Alligator.
SETTINGS History - h
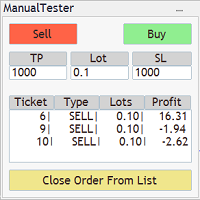
The Manual BackTester Panel utility allows to simulate the manual trading in the MetaTrader 4 strategy tester. The panel works only in the virtual mode of the MetaTrader 4 strategy tester. The demo version allows to open and close ten orders, then the program will automatically turn off. The utility has no parameters at initialization.
Panel Description: The panel has Buy and Sell buttons for placing market orders. It is possible to set the Take Profit and the Stop Loss in the TP and SL fields
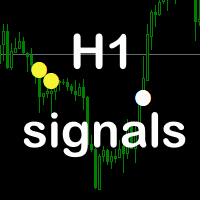
Signal H1
Welcome! Study the H1 signal indicator.
As the name suggests, this indicator is created for the H1 timeframe.
The white circle indicates the initiation of the operation to buy, and the yellow circle, to sell.
Please review the images below.
A demo download is indicated beforehand.
If the indicator doesn't show, read my comment in the comments section.
Thank you. Success!

Fantastic indicator
Welcome!
Fantastic indicator is created for time frames on M5, M15, M1.
On longer time intervals, signals are sparse.
I recommend a TPmin. = 5, 10 pips for M5.
This indicator can trigger longer trades.
Also check out the images below.
A demo download is indicated beforehand.
If the indicator doesn't show, read my comment in the comments section.
Thank you. Success!
Meta indicator
Hello!
Study and experience Metaindicator. There are three indicators integrated into one.
This indicator is created for all time frames and all pairs. I prefer the M15.
Analyze the images below.
The longer the time interval, the more reliable the indicator will give results. Of course a demo download is indicated beforehand.
If the indicator doesn't show, read my comment in the comments section.
Thank you. Success!

ISKANDER indicator
Welcome back!
Study and experience the ISKANDER Indicator ! Deserve.
It works on all time frames and all pairs. See the results shown in these images and in the video. The longer the time interval, the more reliable the indicator will give results. Of course a demo download is indicated beforehand.
If the indicator doesn't show, read my comment in the comments section.
Thank you. Success!

The Prop Trading Scalper indicator is a tool used for manual traders to assist in passing prop trading challenges, which are evaluations set by proprietary trading firms to determine a trader's skill and discipline. This indicator is particularly designed for scalping, a strategy that involves making numerous small trades to capitalize on minor price movements.
With this automatic trading software, the transaction is entered into when conditions comply with the rules of the algorithm (settings that can be changed by you). When a certain profit occurs, the system automatically takes profit and closes the transactions.
You can benefit from many unique features of the control panel. Detailed information about its use will be shared with people who purchase it.

In addition to understanding market trends and logic, surviving in the forex market requires a grasp of risk management, discipline, and a sound trading strategy. While the Grid EA you mentioned may offer a simplified approach, it's important to note that relying solely on grid trading without a deeper understanding of market dynamics and risk management could be risky. Grid trading strategies involve placing buy and sell orders at regular intervals or price levels, aiming to profit from market
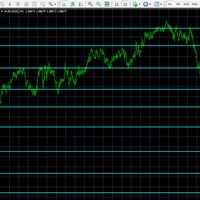
A powerful chart indicator which intelligently analyses Index, FX & Commodity prices to identify the strongest support and resistance price boundaries. Each line shows where prices consistently close, while the frequency of these matching prices is quoted to reflect each boundary strength. Use these predictive boundaries to identify pivot points, resistance and support levels for crossover, trending, reversal and channel strategies. For FX pairs, set volatility filter = 1 For Indices & Commodi

Default settings:XAUUSD(GOLD)M1,M5,M15 No repaint, no redraw, no recalculate Can be optimized in all pairs You can fully optimize it and apply it to your strategy You can use it alone or in addition to your strategy. Suitable for beginners You will see the trading zones and identify the most profitable points to open positions. To open an order, the price must be in the yellow zone Full entry points, 5 different take profit zones https://www.mql5.com/en/users/ummuhan/seller For your questions an
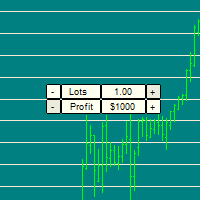
Easily manage your risk and position sizing! It can be tricky to size your trade in the moment, due to different currency / commodity values. For example, placing a 1 Lot position on XAUUSD can easily blow an account that could handle 1 lot on GBPUSD. See screenshots to see how Gold can move $500 on 1 lot much faster than GBPUSD.
THe indicator draws horizontal lines that allow you to easily compare the potential risk/reward across timeframes and symbols. ---- Inputs are: Risk Size: The Loss/Pr
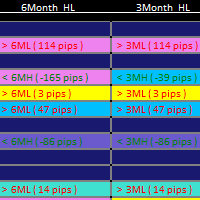
1. Updated usage instructions in blog below: Smart Market Structure Trading System and Automatic Scanner - Trading Systems - 13 October 2023 - Traders' Blogs (mql5.com) https://www.mql5.com/en/blogs/post/754495 2. YouTube video link for introduction: https://youtu.be/tMU04wo0bc8 3. The Smart Market Structure Opportunity Scanner is a great tool to find trading entries and exits based on Smart Money Concepts. It has a build-in custom choice of Forex pair lists to choose from for the scan, and

The Royal Mint New indicator for MetaTrader is a trend-following system that analyzes the trend bias of any currency pair. It is a superior version of the regular Heiken Ashi indicator, designed with more advanced technical tools like the trend reversals, a T3 line, and the moving average. The T3 line of the indicator works as an extra layer of confluence to confirm when the moving average crosses over. Moreover, the Heiken Ashi bars of the indicator would change to blue to depict a potential bu

The SuperTrend indicator is a popular technical analysis tool used by traders and investors to identify trends in the price of a financial instrument, such as a stock, currency pair, or commodity. It is primarily used in chart analysis to help traders make decisions about entering or exiting positions in the market. this version of super trend indicator is exactly converted from trading view to be used in MT4
This is a simple utility which will put automatic Stop Loss and Take Profit on all your open trades based on ATR indicator values. Whenever you open a trade, it will put ATR times Stop Loss and Take Profit automatically. Stop loss and take profit are two important tools used by traders to manage risk and set profit targets in financial markets. The Average True Range (ATR) indicator can be a valuable tool in helping traders determine appropriate levels for these orders. Here's an explanation of

This robot is designed to trade based on supply and demand, It trades currency pairs. Use this robot on the m1 and m5 timeframe. avoid using the robot during news as this can have a negative affect on the performance of this EA. This robot uses the alligator indicator with the RSI indicator to get its entries. Its aim is to catch the lowest and highest points of a market trend during the specific time period.
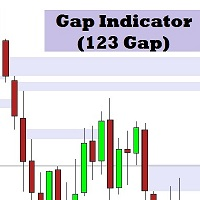
This indicator identifies the gap between the first and third candles in 3 consecutive candles. This area can be used to identify strong areas that the price may return to after a reversal or pullback.
The indicator has 4 user defined settings: 1. Display Distance: This is how many previous candles the indicator will use to identify gaps.
2. BearBarColor: This is the color that will be used for gaps created during a downtrend.
3. BullBarColor: This is the color that will be used for gaps cre
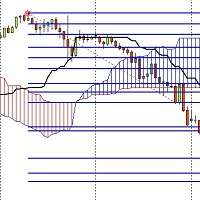
I have developed an indicator based on both the fibo musang strategy and the price breaking of the ichimoku cloud and it has amazing results
the features are:
1- Once activated it give you the trend where you are from the chart
2- After a trend change it gives you an alert on PC or notification on your phone if you are away.
3- It sends you the exact prices to take an order and 3 take profit levels and your stoploss.
4- It works on every timeframes from 1m to MN.
5- It works on pairs
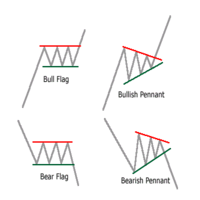
This indicator shows the Pennant and Flag pattern hidden inside your chart. Accuracy has maintained , unlike other indicators it acts way accurately because of the code we applied . Feel free to take a trade on higher timeframe breakout of this patterns. Using naked eye its often difficult to find out these price action build ups. Now you have access to worlds best Flag and Pennant indicator.

Engulfing candlestick patterns are comprised of two bars on a price chart. They are used to indicate a market reversal. The second candlestick will be much larger than the first, so that it completely covers or 'engulfs' the length of the previous bar.
By combining this with the ability to look at trend direction this indicator eliminates a lot of false signals that are normally generated if no overall trend is taken into consideration
FREE

Identify Engulfing candle pattern with Arrows & Alert ( built-in RSI filter). This indicator helps you to identify Engulfing candle pattern or Outside bar (OB) on the chart with arrows, along with an alert when a new Engulfing candle appears. Engulfing candle pattern is one of the most important reversal Price Action signals. You can choose between standard Engulfing (Engulfing based on candle body) or non standard Engulfing (Engulfing based on candle high - low )
Alerts can be turned on a

EA " Swing trade by porl " can use for EURUSD XAUUSD GBPUSD time frame H1 for good. The default settings can be used for saving ports EURUSD. but the minimum profit If you want high profit You can set the inputs you want. only that the value that is put into the supplied, if managing money in the port To fit, there will be a relatively stable profit. If adjusting the higher lot, the risk will be higher as well, but the profit will come according to the risk we invest. We recommend that every

''Trendlines'' is an Indicator, that every Trader need and shows Trendline and Support and resistance levels in all Timeframe's. Also In 1-hour, 4-hour and daily time frames and Current timeframes, support, and resistance levels are specified and trend lines are drawn so that the trader can see all levels on a chart. In Properties it is possible to turn off unnecessary Lines.
In ' Tendency indicator '' , as full package of Predictions that every Trader need, there is also the Predic
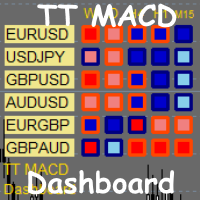
TT MACD Dashboard is multi-time frame and multi-currency market scanner. It is telling you the value of MACD and MACD histogram (a difference between MACD line and Signal line) in a form of small rectangle. If MACD value is above zero (MACD is bullish). Rectangle border color is bullish (Navy by default). If MACD value is below zero (MACD is bearish). Rectangle border color is bearish (OrangeRed by default). If MACD histogram is rising and above zero (Bullish histogram). Rectangle color is bull

This Scalper uses a Quick Trading Strategy on Gold (XAUUSD). Dynamic Trading Grid Allows better risk management. Choose Between Higher and Lower Risk settings. NEW: Advanced news filter to configure filter for each event! Economic, Fed, Jobs all have their own configured news filter! Safe stop loss and max lot size options for compatibility with funded accounts like FTMO. SEE LIVE RESULTS - Dynamic new filter doesn't apply to backtesting! MAIN SETTINGS Add to allowed websites: Tools>Options>Expe

The Alligator indicator uses three smoothed moving averages, set at five, eight, and 13 periods, which are all Fibonacci numbers. The initial smoothed average is calculated with a simple moving average (SMA), adding additional smoothed averages that slow down indicator turns. Scan all your favorite pairs with Alligator, and get notified on your preferred time frames.
Setting is Customizable
Click to change time frame or open new pairs
Notification: Phone/Popup/Email
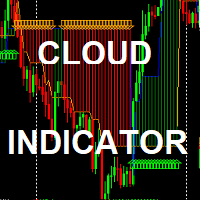
The Simple Cloud Indicator : (FREE limited time for evaluation) Strategy: Strategy is based on moving averages indicator in addition to support /resistance levels crossing *It works on any timeframe *it works on any symbols *it generates alerts *it draws uptrend / Downtrend clouds and BUY/SELL arrows inputs : *drawn start point ( in bars): not affecting strategy - it just gives you indicator history depth *alerting enable/disable
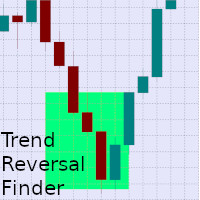
Listed in his faous book "Trading chart patterns like the pros", Suri Duddrella outlines the N-bar rally and decline reversal pattern, which simply states that when stocks make a new high or new low, momentum players will push this stock down or up until eventually they run out of steam. This indicator will look back a certain number of bars to find a continuous uninterrupted rally or decline. Once found, the pattern will look forwards to find the first bar that closes, within a certain range,

ProTools MT4 made By Traders for Traders ! This is the ProTools that should be included in standard MT4.
With ProTools MT4, you will be able to open, close, take partials TPs, apply a breakeven by keyboard shortcuts or buttons on chart. Stay focus on the trade and not on the tool !
Never waste time opening a position again, choose the lotage, never waste time choosing a partial TPs and finally apply a breakeven on chart.
ProTools MT4 will allow you to control each of if your trade as

This EA is a hedging EA. So, please make sure your broker supporting this rule. Works well on ANY PAIRS. WARNING! MARTIANGLE tactic used. Martiangle can boost your money very fast, BUT Martiangle can also be a dangerous strategy since it is increasing size by the time. That's why we recommend: - Please use as small as possible lot at start; recommended: 0.01 lot for $1000. - RangeOP : set this value with the 1/4 of average daily candle range - MaxOP : this value handle maximum running positions
Hedge Expert : Its a simple Hedge technique gives you the ability to control entry points with a click of a button. When you hit Start the expert opens two orders, one buy and one sell according to the settings in the dashboard ( Lot , SL , TP). when you hit Stop, all of opened orders will be closed.
When one of the orders closed to stop loss ( i.e Buy order) the sell order will adjust its stop loss according to a variable called (SL_Adjust), setting a new stop loss at (Sl_Adjust) pips away fr

Harami is a two candle pattern with recent candle formed inside the previous candle's high and low . It represents indecision in the market and is used for breakout price action trading strategy. This indi fires all signals to a dashboard on the chart including pop_up alert, push to phone notification and email. Harami has two types, bullish and bearish pattern. Enter long for bullish Harami and enter short for bearish Harami. Inputs : Currency Symbols: EURUSD,GBPJPY,USDJPY,USDCAD (default) , u
FREE

The indicator plots higher timeframe Kijun-sen (of Ichimoku ) on lower timeframes.
To change timeframes, in the timeframe field enter the number:
M1 PERIOD_M1 1 1 minute. M5 PERIOD_M5 5 5 minutes. M15 PERIOD_M15 15 15 minutes. M30 PERIOD_M30 30 30 minutes. H1 PERIOD_H1 60 1 hour. H4 PERIOD_H4 240 4 hour. D1 PERIOD_D1 1440 Daily. W1 PERIOD_W1 10080 Weekly. MN1 PERIOD_MN1 43200 Monthly.
By default, the Kijun is shifted 3 periods forward but if you wish to have it exactly
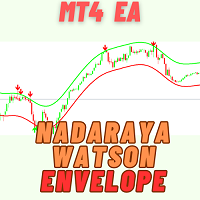
Nadaray Watson Envelope Strategy: The Nadaray Watson Envelope strategy is a technical analysis tool used to identify trends and support and resistance levels. It is based on the Nadaray Watson estimator, which is a non-parametric regression method. The strategy uses envelopes around price data to signal entry and exit points. For detailed documentation Overall Settings/Input Guide High Level Overview of Features Category Setting Description GENERAL SETTINGS Lot Size Initial volume for the fir

Trailing Step, Trailing Stop and Stop Loss as we used see how Pro traders used to make consistent profit. Traders who prefer the Stop Loss and Trailing Step trading style can use this EA to power their trading strategy and leverage from the movement of the price towards the Take Profit line with the continuous movement of the SL line. What is special about this EA is that it will immediately open the next trade in the opposite direction once the price hits SL. The EA has a built-in News Filter,

Previous Period High Low . This indicator shows the previous Day, Week, Month and Years High and Low. It's great for price action strategies. : Provides clear and visible breaks in structure. : Easy to see breakout levels. : Easy to see gaps between previous high, low levels after breakouts have occurred. The indicator works on every time frame. Multiple periods can be selected and be seen on the same chart. Every line can be customized to Your liking. Color, style and thickness. Enjoy!

Why the RSI Alert Indicator is Essential for Your Trading Toolkit
In the fast-paced world of trading, timely and accurate information is crucial. The RSI Alert Indicator is a powerful tool designed to help you stay ahead of the market by providing real-time alerts when the Relative Strength Index (RSI) reaches critical levels. Whether you're a novice trader or a seasoned professional, this indicator can significantly enhance your trading strategy by pinpointing potential market reversals with
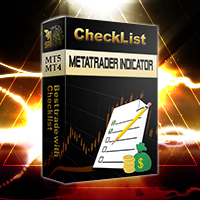
One of the basic needs of every trader is to have a checklist to enter every position. Of course, using pen and paper may not be convenient forever. With this indicator, you can have a small checklist next to the screen for each of your charts and use it for better use in your trades. MT5 Version This indicator will have many updates and special settings will be added to it.
You can contact us via Instagram, Telegram, WhatsApp, email or here. We are ready to answer you.

A flexible 2-Line MACD indicator The default MACD indicator inside MT4, limits you to using the MACD with a fast-EMA, slow-EMA, and signal-SMA. This MACD indicator allows you to set your own MA-Method choices for these 3 components, separately! You can select from SMA-EMA-SMMA-LWMA-DEMA-TEMA, and can even use a separate method for each 3 fast-slow-signal periods. On-chart colored candles, with drawing condition types is included, with a show/hide button too.
Features - MA Methods: SMA, EMA, S

Euro Hedge is a combination of hedging, averaging, pyramiding, lot martingale and anti-martingale strategies plus the ability to close partial losing positions, which the aim of getting in and out of the market as quickly as possible so as not to be trapped by unexpected market changes.
Bot Explanation | MT5 version | Setfile: pls leave a message on the comment tab, I will send you the latest setfile
Suggested pairs: EURUSD, GBPUSD, XAUUSD
Expert parameters: 1. Manage Open Positi
This indicator is based on the same famous fractal indicator with a slight difference:
MetaTrader version 5 click here
Advantages:
Works on all instruments and time series,
Does not redraw its results,
Comparison depth is adjustable,
Works well with any popular strategy,
Adjust the power of fractals
Input settings:
Number of comparisons - The number of candles that each side selects for comparison.
Marker distance from the candlestick
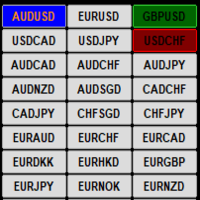
This indicator display current profit/loss status for each pair visually on a single chart. If the current open chart pair is selected and a trade/s are opened for that pair only the Symbol name is highlighted and the button color reflects the current trade/s status if the selected chart pair does not have any open trades then the button color is Blue. The input options are :
1/ Select Pairs automatically from the Market Watch
2/ Manually select your own Pairs
3/ Select all MT4 Timeframes

Introducing a sophisticated BreakOut and RecoveryZone tool designed to empower traders in any market scenario, facilitating the optimization of trade opportunities.
The core strategy revolves around executing price breakouts using BuyStop and SellStop orders to achieve specific profit targets in dollars. Notably, traders can manually set the BuyStop and SellStop levels by simply clicking and dragging lines on the chart (FixedZone=true is required).
For swift market entry, you can dr
MetaTraderプラットフォームのためのアプリのストアであるMetaTraderアプリストアで自動売買ロボットを購入する方法をご覧ください。
MQL5.community支払いシステムでは、PayPalや銀行カードおよび人気の支払いシステムを通してトランザクションをすることができます。ご満足いただけるように購入前に自動売買ロボットをテストすることを強くお勧めします。
取引の機会を逃しています。
- 無料取引アプリ
- 8千を超えるシグナルをコピー
- 金融ニュースで金融マーケットを探索
新規登録
ログイン