
Custom symbols: Practical basics
The MetaTrader 5 features the ability to create custom symbols having their own quotes and ticks. They can be accessed both from the terminal interface and at the program level, via MQL API. Custom symbols are displayed on standard charts, allowing the application of indicators, marking with objects, and even creation of trading strategies based on these symbols.
Custom symbols can use real symbol quotes provided by brokers or external resources as data sources. In this article, we will consider several popular methods for transforming working symbols that provide additional analytical tools for traders:
- equal volume and equal range chart
- tick charts
- time shift of quotes with the conversion of candlestick shapes
- Renko
Additionally, we will develop a mechanism for adapting Expert Advisors to trading a real symbol which is associated with a derivative custom symbol on whose chart the EA is running.
In this article, source (standard) symbol charts use a black background, and custom symbol charts use a white background.
Equal volume/range charts
An equivolume chart is a bar chart based on the principle of equality of the volume enclosed in bars. On a regular chart, each new bar is formed at specified intervals, which match the timeframe size. On an equivolume chart, each bar is considered formed when the sum of ticks or real volumes reaches a preset value. After that, the program starts calculating the amount for the next bar. Of course, price movements are also controlled when the volumes are calculated, and thus you receive the usual four price values on the chart: Open, High, Low and Close.
Although the horizontal axis on the equivolume chart still means chronology, the timestamps of each bar are arbitrary and depend on the volatility (number or size of trades) in each time period. Many traders consider this bar formation method to provide a more adequate description of a changing market compared to a constant timeframe value.
Unfortunately, neither MetaTrader 4 nor MetaTrader 5 provide equivalent volume charts out of the box. They should be generated in a special way.
In MetaTrader 4, this can be done using offline charts. This method was described in the article Equivolume Charting Revisited.
The same algorithm can be implemented in MetaTrader 5 using custom symbols. To simplify the task, let us use a non-trading Expert Advisor from the specified article and adapt it to the MetaTrader 5 MQL API.
The original file EqualVolumeBars.mq4 has been renamed to EqualVolumeBars.mq5 and it has been slightly modified. In particular, the 'extern' keywords describing input parameters have been replaced with 'input'. Instead of two parameters, StartYear and StartMonth, one parameter StartDate is used. The CustomPeriod which was used in MetaTrader 4 to set a non-standard timeframe is not required now and has therefore been deleted.
Pay attention that MetaTrader 4 volumes are all tick volumes, i.e. they represent the number of ticks (price changes) in a bar. The original idea was to process M1 bars (with their tick volumes) or an external csv file with ticks provided by another broker, to count incoming ticks per time unit and to form a new equivolume bar as soon as the specified number of ticks is reached. Bars were written to a hst file which could be opened in MetaTrader 4 as an offline chart.
The code part related to reading of a csv file and to writing of an hst file is not needed in MetaTrader 5. Instead, we can read real tick history and form bars using the custom symbols API. In addition, MetaTrader 5 enables brokers to provide real volumes and ticks (for exchange instruments, but they are usually not available for forex instruments). If this mode is enabled, equivolume bars can be built not by the number of ticks, but by real volumes.
The FromM1 input parameter determines if the EA will process M1 bars ('true' by default) or the tick history ('false'). When starting tick processing, do not select a too distant past as the beginning, as this may require a lot of time and disk space. If you have already worked with the tick history, then you understand your PC capabilities and the available resources.
Equal range bars are plotted in a similar way. However, here a new bar opens when the price passes a specified number of points. Please note that these bars are only available in tick mode (FromM1 == false).
Chart type — EqualTickVolumes, EqualRealVolumes, RangeBars — is set by the WorkMode input parameter.
The most convenient way to work with custom symbols is to use the Symbol library (by fxsaber). It can be connected to an Expert Advisor using the #include directive:
#include <Symbol.mqh>
Now, we can create a custom symbol based on the current chart symbol. This is done as follows:
  if(!SymbolSelect(symbolName, true))
  {
    const SYMBOL Symb(symbolName);
    Symb.CloneProperties(_Symbol);

    if(!SymbolSelect(symbolName, true))
    {
      Alert("Can't select symbol:", symbolName, " err:", GetLastError());
      return INIT_FAILED;
    }
  }
where symbolName is a string with the custom symbol name.
This initialization fragment and many other auxiliary tasks related to custom symbol management (in particular, resetting an existing history, opening a chart with a new custom symbol) will be performed in all the programs in a similar way. You can view the relevant source codes in the attachment below. I will omit them in this article as they are of secondary importance.
When a new equivolume bar appears or the current one changes, the WriteToFile function is called. This function is implemented by calling CustomRatesUpdate in MetaTrader 5:
  void WriteToFile(datetime t, double o, double l, double h, double c, long v, long m = 0)
  {
    MqlRates r[1];

    r[0].time = t;
    r[0].open = o;
    r[0].low = l;
    r[0].high = h;
    r[0].close = c;
    r[0].tick_volume = v;
    r[0].spread = 0;
    r[0].real_volume = m;

    int code = CustomRatesUpdate(symbolName, r);
    if(code < 1)
    {
      Print("CustomRatesUpdate failed: ", GetLastError());
    }
  }
Surprisingly, the M1 bars cycle (FromM1 = true mode) is almost the same as in the MQL4 version, which means that by simply adapting the WriteToFile function we can receive a functional MQL5 code for M1 bars. The only part which needs to be changed is the generation of ticks in RefreshWindow. In MetaTrader 4, this was done by sending Windows messages to emulate ticks on an offline chart. MetaTrader 5 uses the CustomTicksAdd function:
  void RefreshWindow(const datetime t)
  {
    MqlTick ta[1];
    SymbolInfoTick(_Symbol, ta[0]);
    ta[0].time = t;
    ta[0].time_msc = ta[0].time * 1000;
    if(CustomTicksAdd(symbolName, ta) == -1)
    {
      Print("CustomTicksAdd failed:", GetLastError(), " ", (long) ta[0].time);
      ArrayPrint(ta);
    }
  }
Tick generation calls the OnTick event on custom symbol charts, which potentially allows Expert Advisors running on such charts to trade. However, this technology requires some extra actions, which we will consider later.
The mode in which equivolume bars are generated from the tick history (FromM1 = false) is a bit more complicated. This requires reading real ticks using standard CopyTicks/CopyTicksRange functions. All this functionality is implemented in the TicksBuffer class.
  #define TICKS_ARRAY 10000

  class TicksBuffer
  {
    private:
      MqlTick array[];
      int tick;

    public:
      bool fill(ulong &cursor, const bool history = false)
      {
        int size = history ? CopyTicks(_Symbol, array, COPY_TICKS_ALL, cursor, TICKS_ARRAY) : CopyTicksRange(_Symbol, array, COPY_TICKS_ALL, cursor);
        if(size == -1)
        {
          Print("CopyTicks failed: ", GetLastError());
          return false;
        }
        else if(size == 0)
        {
          if(history) Print("End of CopyTicks at ", (datetime)(cursor / 1000));
          return false;
        }

        cursor = array[size - 1].time_msc + 1;
        tick = 0;

        return true;
      }

      bool read(MqlTick &t)
      {
        if(tick < ArraySize(array))
        {
          t = array[tick++];
          return true;
        }
        return false;
      }
  };
Ticks are requested in the 'fill' method in fragments of TICKS_ARRAY and are then added to 'array' from which then are read by the 'read' method one by one. The method implements the algorithm for working with the tick history similar to that of M1 history bars (the complete source code is provided in the attachment).
    TicksBuffer tb;

    while(tb.fill(cursor, true) && !IsStopped())
    {
      MqlTick t;
      while(tb.read(t))
      {
        ...
        // New or first bar
        if(IsNewBar() || now_volume < 1)
        {
          WriteToFile(...);
        }
      }
    }
Every time the Expert Advisor starts, it erases the existing history of the specified custom symbol, if it exists, using the Reset function. If necessary, this behavior can be improved by saving the history and continuing to generate bars at the position where the previous generation ended.
You can compare the source code of EqualVolumeBars.mq4 and of the resulting EqualVolumeBars.mq5.
Let's see how the new Expert Advisor works. This is the EURUSD H1 chart on which the EA is running:
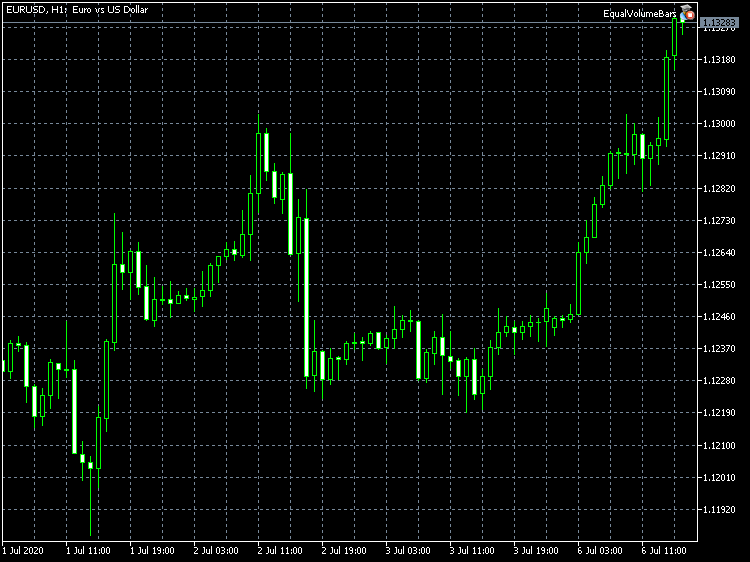
The EqualVolumeBars Expert Advisor on the EURUSD H1 chart in MetaTrader 5
Below is the equivolume chart created by the EA, in which each bar consists of 1000 ticks.
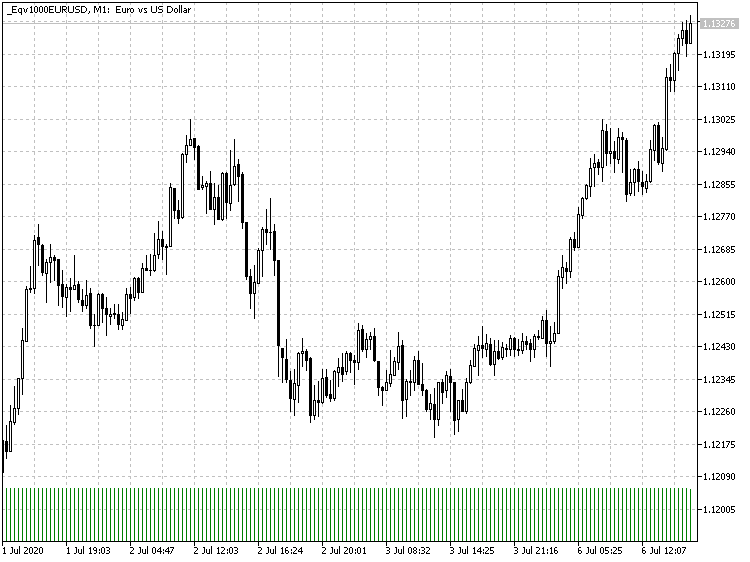
EURUSD equivolume chart with 1000 ticks per bar, generated by the EqualVolumeBars EA in MetaTrader 5
Note that tick volumes of all bars are equal, except for the last one, which is still being formed (tick counting continues).
Let's check another operating mode - equal-range charts. Below is a chart consisting of bars with a swing of 100 points.
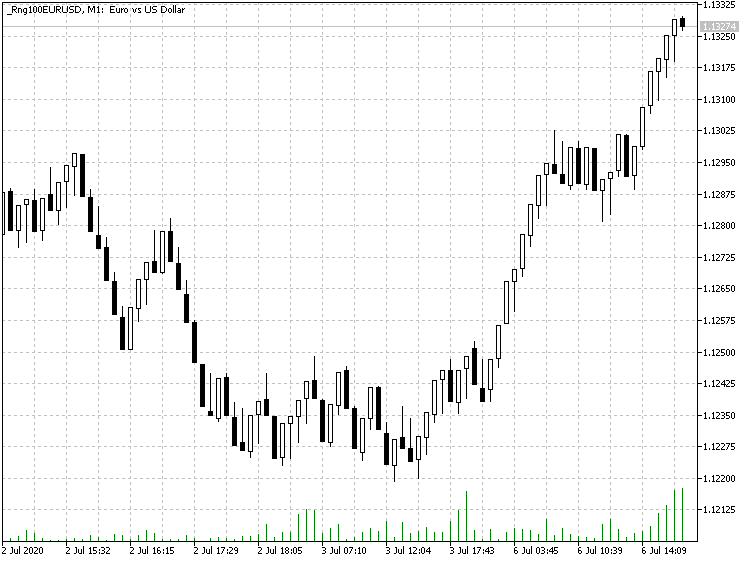
EURUSD equal-range chart with 100 points per bar, generated by the EqualVolumeBars EA in MetaTrader 5
Also, the EA allows using the real volume mode for exchange instruments:
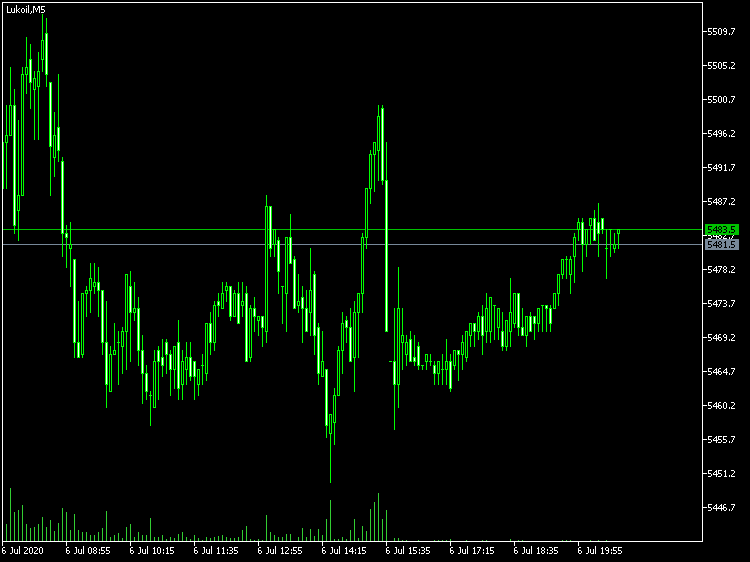
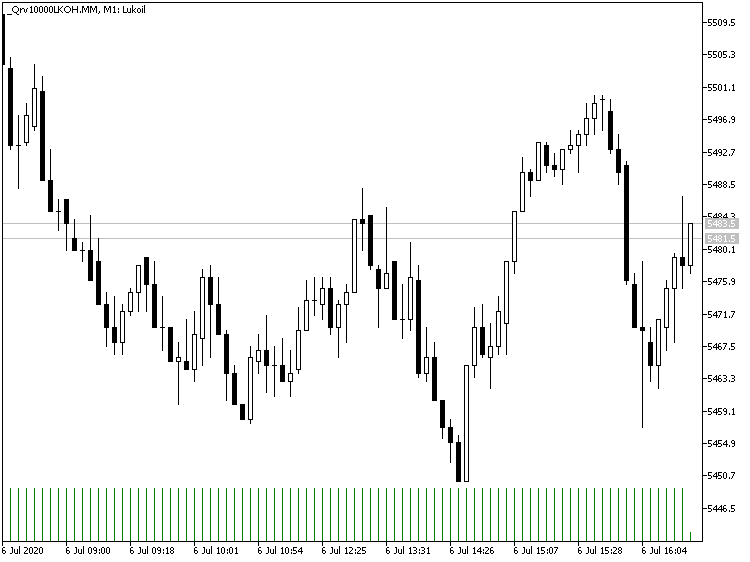
The original (a) and the equivolume (b) LKOH chart with the real volume of 10000 per bar, generated by the EqualVolumeBars EA in MetaTrader 5
The timeframe of the symbol on which the EA is running is not important, since either M1 bars or tick history are always used for calculations.
The timeframe of the custom symbol charts must be equal to M1 (the smallest available timeframe in the terminal). Thus, the time of bars, usually closely corresponds to their formation moments. However, during strong market movements, when the number of ticks or the size of volumes forms several bars per minute, the time of the bars will be ahead of real ones. When the market calms down, the time marks of the equivolume bars will return to normal. This platform limitation is probably not particularly critical for equal-volume or equal-range bars, since the very idea of such charts is to unbind them from absolute time.
Tick Charts
The tick chart in MetaTrader 5 is available in the Market Watch window. For some reason, its implementation differs from regular charts. It displays a limited number of ticks (as far as I know, up to 2000), it is small and cannot be expanded to full screen, and it lacks all the capabilities which are usually provided by standard charts provide, such as the ability to use indicators, objects and Expert Advisors.
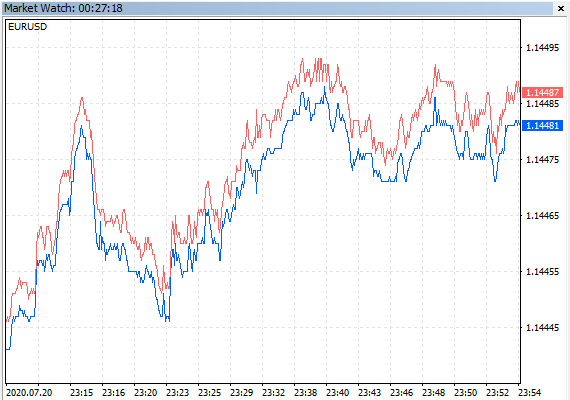
Tick charts in the MetaTrader 5 Market Watch window
So why the standard analysis tools are not supported for tick, while MetaTrader 5 features native support for real ticks and offers High Frequency Trading (HFT) capabilities? Some traders consider ticks to be too small entities or even noise. Other traders try to generate profits form ticks. Therefore, it might be useful to display ticks in a standard chart with the ability to scale, to apply templates and event to use Expert Advisors. This can be implemented using the custom symbol functionality.
Again, we can use already known MQL API functions, such as CopyTicks and CustomRatesUpdate. Using them, we can easily implement a non-trading Expert Advisor that generates a custom symbol based on the current chart symbol. Here, each M1 bar in the custom symbol history is a separate tick. An example of such a source code is attached below in the Ticks2Bars.mq5 file. For example, if you run the Expert Advisor on the EURUSD chart (any timeframe), it will create the EURUSD_ticks symbol.
Inputs of the EA are following:
- Limit — the number of bars (ticks) created after launch, default is 1000; if you set 0, online tick generation will start, without a previous history.
- Reset — the option resets the previous tick/bar history after launch, set to true by default.
- LoopBack — the option enables a circular buffer mode in which ticks (with indexes higher than Limit) are pushed out of the internal array of "quotes" as new ticks are added at the beginning, so that the chart always has Limit bars; set to true by default; when LoopBack is enabled the Limit parameter must be greater than 0; when LoopBack is disabled, the array is constantly expanded and the number of bars in the chart increases.
- EmulateTicks — the option emulates new tick arrival events for a custom symbol which is an important feature for Expert Advisor calls, set to true by default.
- RenderBars — bar/tick display method: OHLC or HighLow; OHLC by default; in this mode a tick is i fully featured bar with a body (high = ask, low = bid, last (if available) = close; if last = 0, then open and close are equal to one of the appropriate high or low, depending on the price movement direction since the previous tick; in the HighLow mode ticks are shown as pin bars in which high = ask, low = bid, open = close = (ask + bid) / 2.
The main operations are performed by the 'apply' function:
  bool apply(const datetime cursor, const MqlTick &t, MqlRates &r)
  {
    static MqlTick p;

    // eliminate strange things
    if(t.ask == 0 || t.bid == 0 || t.ask < t.bid) return false;

    r.high = t.ask;
    r.low = t.bid;

    if(t.last != 0)
    {
      if(RenderBars == OHLC)
      {
        if(t.last > p.last)
        {
          r.open = r.low;
          r.close = r.high;
        }
        else
        {
          r.open = r.high;
          r.close = r.low;
        }
      }
      else
      {
        r.open = r.close = (r.high + r.low) / 2;
      }

      if(t.last < t.bid) r.low = t.last;
      if(t.last > t.ask) r.high = t.last;
      r.close = t.last;
    }
    else
    {
      if(RenderBars == OHLC)
      {
        if((t.ask + t.bid) / 2 > (p.ask + p.bid) / 2)
        {
          r.open = r.low;
          r.close = r.high;
        }
        else
        {
          r.open = r.high;
          r.close = r.low;
        }
      }
      else
      {
        r.open = r.close = (r.high + r.low) / 2;
      }
    }

    r.time = cursor;
    r.spread = (int)((t.ask - t.bid)/_Point);
    r.tick_volume = 1;
    r.real_volume = (long)t.volume;

    p = t;
    return true;
  }
In this function, MqlTick structure fields for the current time moment 'cursor' are ported to the fields of the MqlRates structure which is then written to history.
The below figure shows a tick-bar chart of a custom symbol (a standard tick chart is shown for comparison):
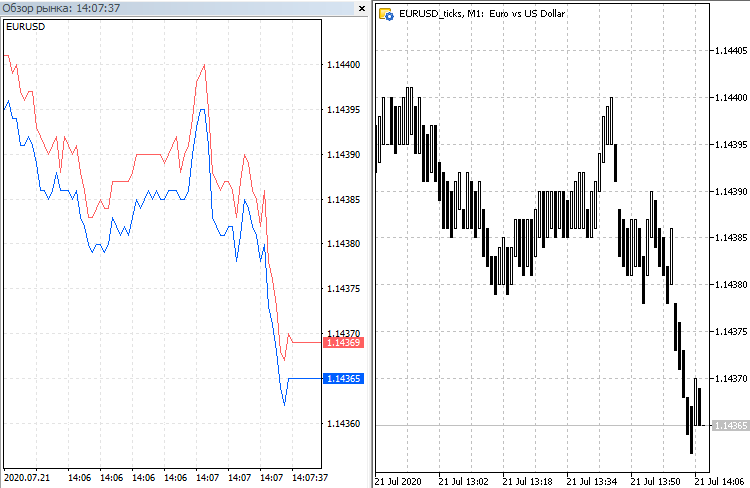
Fully featured EURUSD tick chart in MetaTrader 5
This is the chart where we can use indicators, objects or experts to automate tick analysis and trading.
Pay attention that the times of bars on the tick bar chart are fictitious. If the LoopBack mode is enabled, the last bar always has the current time accurate to a minute, and previous bars are distant with a 1-minute step each (which is the minimum timeframe size in MetaTrader 5). If the LoopBack mode is disabled, bar times are increased by 1 minute starting with the expert launch time, so all bars above the initial limit are in a virtual future.
However, the right-most M1 bar corresponds to the most recent tick and the current "close" (or "last") price. This allows trading on such charts using Expert Advisors, both online and in the tester. To work online, the EA needs slight modification, because it must be able to trade the original XY symbol from the "XY_ticks" symbol chart (custom symbols exist only in the terminal and are not known on the server). In the above example, "EURUSD_ticks" should be replaced with "EURUSD" in all trade orders.
If an Expert Advisor receives trading signals from indicators, then it may be enough to create their instances on the custom symbol chart instead of the current working symbol, and to run this EA on this working symbol chart. But this method is not always applicable. Another method of adapting Expert Advisors for trading custom symbols will be described further.
Some difficulty in working with tick charts is connected with the fact that they update very quickly. Due to this it is almost impossible to analyze and mark the charts manually - everything must be automated using indicators or scripts.
The presented approach with "tick quotes" allows the testing of scalping strategies without special data accumulation in internal buffers and calculation of signals based on the buffers, while we can simply use usual indicators or objects.
Time Shift and Candlestick Metamorphosis
Many traders use candlestick patterns in their practice as a main or an additional signal. This method is visually informative, but it has an important disadvantage.
Candlestick patterns describe a predefined geometry of a sequence of bars. All bars are formed as the price changes over time. However, time is inherently continuous, though charts present time artificially divided into segments corresponding to bars and aligned to a certain time zone (chosen by the broker). For example, if you shift an H1 bar chart by a few minutes (say, 15 minutes), the geometry of bars will most likely change. As a result, earlier existing patterns can completely disappear, and new ones will be formed in other places. However, price action is the same.
If you view some popular candlestick patterns, you can easily see that they are formed by similar price movements, and the difference in their appearance is caused by the bar calculation start time. For example, if you shift the time axis by half a bar, then a "hammer" can be transformed into a "piercing"), and a "hangman" can turn into a "dark cloud cover". Depending on the shift value and local price changes, the pattern can also turn into bearish or bullish "engulfing". If you switch to a lower timeframe, all the above patterns can turn out to be a "morning star" or an "evening star".
In other words, each pattern is a function from the start of time and scale calculation. In particular, by changing the starting point, we can detect one figure and intercept all the others which are equivalent to it.
Reversal patterns (which are very popular among traders as they allow determining the beginning of a movement) can be presented in the following simplified form:
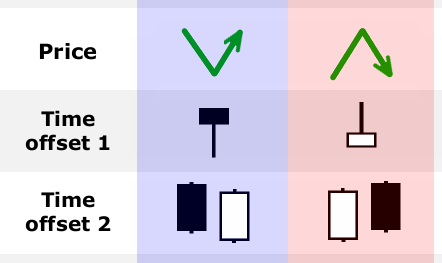
Price reversals and equivalent candlestick structures
The figure shows a schematic presentation of an upward reversal and a downward reversal, each of them with two bar configuration variants. We have seen earlier that there can be more patterns of a similar meaning. It would not be reasonable to track all of them. A more convenient solution would be the ability to determine candlestick patterns for any time beginning.
Moreover, the time transformation may represent an acceptable shift relative to GMT for some other time zone, which means theoretically that these new candlestick patterns should also work in this new area, as the ones formed in our time zone. As trading servers are located all over the world, in all time zones, somewhere traders can definitely see absolutely different signals. Every signal is valuable.
We can come to the conclusion that the fans of candlestick patterns should take into account their variability depending on the starting point. This is where custom symbols come in handy.
A working symbol-based custom signal allows building bars and ticks with timestamps shifted by the specified value to the future or to the past. This shift value can be interpreted as part of a bar of any selected timeframe. The prices and the movement do not change, but this still can provide an interesting result. Firstly, it provides detection of candlestick patterns which would go unnoticed without such a shift. Secondly, we actually can see one incomplete bar ahead.
For example, if you shift quotes by 5 minutes ahead, bars on an M15 chart will be opened and closed by one third earlier than the source chart (at the 10th, 25th, 40th, 55th minute of an hour). If the shift is insignificant, then the patterns in the original and custom charts will be almost identical, but signals (calculated by bars, including indicator signals) from the custom chart will come earlier.
The creation of such a time-shifted custom symbol is implemented in the TimeShift.mq5 Expert Advisor.
The shift value is specified in the source Shift parameter (in seconds). The EA works using ticks, allowing to calculate at start the history of transformed quotes, starting with the date specified in the Start parameter. Then ticks are processed online if the OnTick event generation mode is enabled, for which the EmulateTicks parameter is provided (true by default).
Time conversion is performed in a simple, which is the for historic ticks and for online ticks: for example, the 'add' function is used in the latter case:
  ulong lastTick;

  void add()
  {
    MqlTick array[];
    int size = CopyTicksRange(_Symbol, array, COPY_TICKS_ALL, lastTick + 1, LONG_MAX);
    if(size > 0)
    {
      lastTick = array[size - 1].time_msc;
      for(int i = 0; i < size; i++)
      {
        array[i].time += Shift;
        array[i].time_msc += Shift * 1000;
      }
      if(CustomTicksAdd(symbolName, array) == -1)
      {
        Print("Tick error: ", GetLastError());
      }
    }
  }

  void OnTick(void)
  {
    ...
    if(EmulateTicks)
    {
      add();
    }
  }
The source and modified EURUSD H1 charts are shown below.
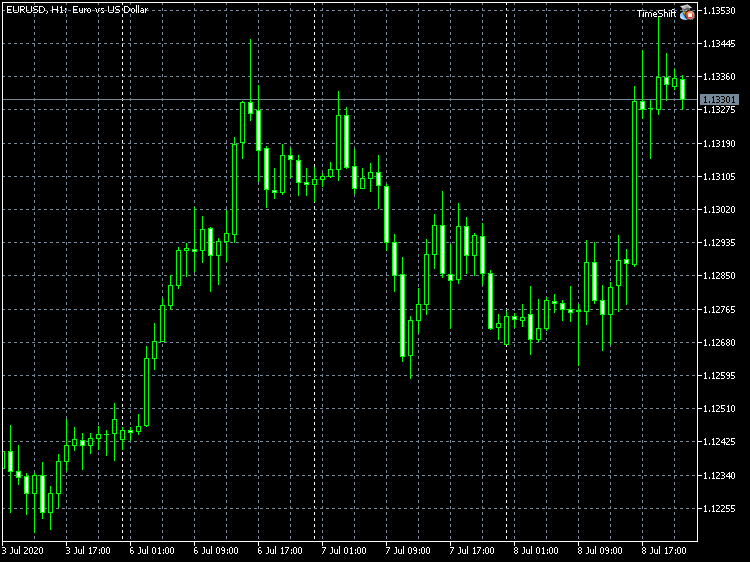
EURUSD H1 chart with the TimeShift Expert Advisor
After a half-bar (30 minutes) shift, the picture changes.
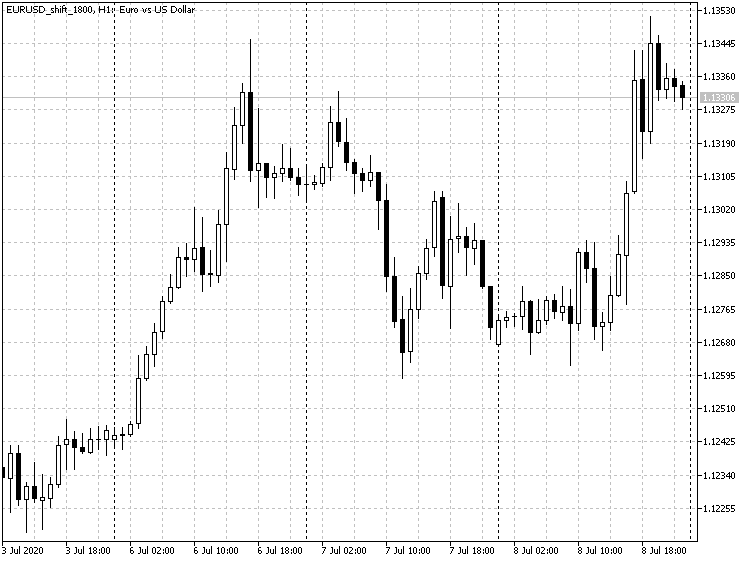
The EURUSD H1 custom chart with a half-hour shift
Those who are well familiar with candlestick patterns, will definitely notice a lot of differences, including new signals which were not present on the original chart. Thus, by applying an ordinary candlestick indicator on a custom symbol chart, we can receive twice as many alerts and trading opportunities. The process could even be automated using Expert Advisors, but here we need to teach the EA to trade a real symbol from a custom symbol chart. This task will be considered at the end of the article. Now, let us consider another custom chart type, which is probably the most popular one - Renko.
Renko
The non-trading Expert Advisor RenkoTicks.mq5 will be used to implement Renko charts. The EA generates renko as custom symbol quotes while processing real ticks (available in MetaTrader 5 from your broker). We can use any source symbol quotes (bars) and the timeframe of the working chart on which RenkoTicks is running.
When generating renko, an alternative to custom symbols could be an indicator or drawing (using objects or on a canvas), but in both cases it would be impossible to use indicators or scripts on resulting pseudo-charts.
All renko bars are formed on the M1 timeframe. This is done intentionally, as sometimes renko bars can be formed very quickly one after another, for example during high volatility times, and the time between bars should be as short as possible. A minute is the minimum distance supported in MetaTrader 5. That is why the renko chart should always have the M1 timeframe. There is no point in switching the renko chart to another timeframe. The time of each 1-minute bar beginning matches the time when the formation of the appropriate renko bar starts. The time of such a minute bar completion is fake and you should check the beginning of the next 1-minute bar instead.
Unfortunately, sometimes several renko bars must be formed within one minute. Since MetaTrader 5 does not allow this, the EA generates bars as sequences of adjacent M1 bars, artificially increasing the counts every minute. As a result, the formal time of renko bars may not coincide with the actual time (can be ahead of it). For example, with a renko size of 100 pips, a movement of 300 pips that occurred at 12:00:00 and took 10 seconds would have created renko bars at 12:00:00, 12:00:05, 12:00:10. Instead, the EA will generate bars at 12:00, 12:01, 12:02.
When this happens in the quote history, the following problem may arise: such renko bars transferred from the past will overlap with other bars formed from the later bars of the original chart. Suppose another movement of 100 points happens at 12:02 and so we need to generate a renko bar with an opening time of 12:02, but this time is already busy! To resolve such conflicts, the Expert Advisor has a special mode with a forced increase of the next formed bar time by 1 minute, if the required count is already busy. This mode is set by the SkipOverflows parameter which is set to false by default (bars do not overlap, instead they move to the future if necessary). If SkipOverflows is true, bars with overlapping times overwrite each other, and the resulting renko will not be fully correct.
Please note that such a situation with a strong movement and the generation of several "ahead" bars is possible in real time - in this case the bars will actually form in the future! In our example, renko bars with the opening times of 12:00, 12:01, 12:02 will exist at 12:00:10! This should be taken into account in analysis and trading.
There are a couple of ways to solve this problem, for example to increase the size of the renko bar. However, it has an obvious drawback - this will decrease the accuracy of renko, i. e. it will register rougher quote movements and will generate less bars. Another possible way is to pack (shift to the left) older bars, but this pay require redrawing of indicators or objects.
Due to the specific platform features, the EA generates fictitious ticks with a time equal to the opening time of the last renko bar. Their only purpose is to launch the OnTick handler in a trading Expert Advisor. If ticks were translated from the original symbol to a custom symbol without changes, it would spoil the very structure of renko. Again, we can take the strong movement as an example and try to send to a renko chart a tick with an actual time at 12:00:00. But the time of this tick will correspond not to the last (current) bar 0, but to bar 2 with the opening time 12:00. As a result, such a tick will spoil the 12:00 renko bar (which is in history) or will produce an error. Renko can be spoiled by an opposite situation, when the movement is too slow. If quotes are in the range of one bar for a long time, the renko bar stays with the same opening time, while new ticks may have a time more than a minute greater than the 0th renko bar. If such ticks are sent to a renko chart, this would form phantom bars in "future".
Note that historical renko ticks are formed in a minimalistic style, 1 tick per box. When working online, all ticks are sent to renko.
Similar to other custom symbols, this approach allows us to use any indicators, scripts and objects on renko charts, as well as to trade using Expert Advisors.
Main Parameters
- RenkoBoxSize — renko bar size in points, 100 by default.
- ShowWicks — wick showing flag, true be default.
- EmulateOnLineChart — tick sending flag, true by default.
- OutputSymbolName — custom symbol name for the generated renko, an empty string by default — the name is formed as "Symbol_T_Type_Size", where Symbol is the current working symbol, T is the tick mode sign, Type — "r" (renko) with wicks or "b" (brick) without wicks, Size — RenkoBoxSize; example: "EURUSD_T_r100".
- Reset — flag for the recalculation of the entire renko chart, set to false by default. If you set it to true, it is recommended to wait for the result and to set it back to false to avoid recalculation at each terminal restart. This mode is useful when generation of renko bars failed at some position. Usually the option is always disabled as the EA can continue calculation from the last available renko bar.
- StartFrom, StopAt — history period beginning and end; zeros are used by default, which means that the entire available history will be used. During the first EA use, it is recommended to set StartFrom to the recent past, in order to evaluate the system speed when it generates renko bars by real ticks.
- SkipOverflows — flag for processing box overlapping conflicts; set to false by default, which means the new bar time will be forcedly increased by 1 minute, if the required calculation is already occupied by the previous box.
- CloseTimeMode — if true, boxes are formed entirely at the close time (one "tick" event per box); false by default.
The Renko class handles the tick stream and creates new renko bars on its basis. Its main components are indicated in the following pseudocode:
  class Renko
  {
    protected:
      bool incrementTime(const datetime time);
      void doWriteStruct(const datetime dtTime, const double dOpen, const double dHigh, const double dLow, const double dClose, const double dVol, const double dRealVol, const int spread);

    public:
      datetime checkEnding();
      void continueFrom(const datetime time);
      void doReset();

      void onTick(const MqlTick &t);
      void updateChartWindow(const double bid = 0, const double ask = 0);
  };
The protected methods incrementTime and doWriteStruct, respectively, switch to the next free, closest to the specified time, M1 sample for the next renko box, and write the bar itself using the CustomRatesUpdate call. The first three methods in the public part are responsible for initializing the algorithm at startup. The Expert Advisor can check for the existence of previous Renko quotes (this is done by the checkEnding method, which returns the history end date and time) and, depending on whether they exist or not, the EA either continues from the specified moment using the continueFrom method (restoring the values of internal variables), or uses doReset to handle ticks from an "empty" state.
The onTick method is called at every tick (both in history and online) and, if necessary, forms a renko bar using doWriteStruct (I used an algorithm from the famous RenkoLiveChart.mq4 EA with some corrections). If tick emulation is specified in EA settings, the updateChartWindow is additionally called. Full source codes are attached below.
The TickProvider class is responsible for the "delivery" of ticks to the Renko object:
  class TickProvider
  {
    public:
      virtual bool hasNext() = 0;
      virtual void getTick(MqlTick &t) = 0;

      bool read(Renko &r)
      {
        while(hasNext() && !IsStopped())
        {
          MqlTick t;
          getTick(t);
          r.onTick(t);
        }

        return IsStopped();
      }
  };
It is abstract, since it declares a common interface for reading/receiving ticks from two different sources: the tick history of the basic symbol at the EA and the OnTick event queue when working online. The 'read' method is a universal tick loop that uses the virtual methods hasNext() and getTick().
The tick history is read in the HistoryTickProvider class in a familiar way: it uses CopyTicksRange and the MqlTick array[] intermediate buffer, in which ticks are requested by day:
  class HistoryTickProvider : public TickProvider
  {
    private:
      datetime start;
      datetime stop;
      ulong length;     // in seconds
      MqlTick array[];
      int size;
      int cursor;

      int numberOfDays;
      int daysCount;

    protected:
      void fillArray()
      {
        cursor = 0;
        do
        {
          size = CopyTicksRange(_Symbol, array, COPY_TICKS_ALL, start * 1000, MathMin(start + length, stop) * 1000);
          Comment("Processing: ", DoubleToString(daysCount * 100.0 / (numberOfDays + 1), 0), "% ", TTSM(start));
          if(size == -1)
          {
            Print("CopyTicksRange failed: ", GetLastError());
          }
          else
          {
            if(size > 0 && array[0].time_msc < start * 1000) // prevent older than requested data returned
            {
              start = stop;
              size = 0;
            }
            else
            {
              start = (datetime)MathMin(start + length, stop);
              if(size > 0) daysCount++;
            }
          }
        }
        while(size == 0 && start < stop);
      }

    public:
      HistoryTickProvider(const datetime from, const long secs, const datetime to = 0): start(from), stop(to), length(secs), cursor(0), size(0)
      {
        if(stop == 0) stop = TimeCurrent();
        numberOfDays = (int)((stop - start) / DAY_LONG);
        daysCount = 0;
        fillArray();
      }

      bool hasNext() override
      {
        return cursor < size;
      }

      void getTick(MqlTick &t) override
      {
        if(cursor < size)
        {
          t = array[cursor++];
          if(cursor == size)
          {
            fillArray();
          }
        }
      }
  };
The CurrentTickProvider online tick provider class:
  class CurrentTickProvider : public TickProvider
  {
    private:
      bool ready;

    public:
      bool hasNext() override
      {
        ready = !ready;
        return ready;
      }

      void getTick(MqlTick &t) override
      {
        SymbolInfoTick(_Symbol, t);
      }
  };
The main part of tick processing in a short form looks like this:
  const long DAY_LONG = 60 * 60 * 24;
  bool _FirstRun = true;

  Renko renko;
  CurrentTickProvider online;

  void OnTick(void)
  {
    if(_FirstRun)
    {
      // find existing renko tail to supersede StartFrom
      const datetime trap = renko.checkEnding();
      if(trap > TimeCurrent())
      {
        Print("Symbol/Timeframe data not ready...");
        return;
      }
      if((trap == 0) || Reset) renko.doReset();
      else renko.continueFrom(trap);

      HistoryTickProvider htp((trap == 0 || Reset) ? StartFrom : trap, DAY_LONG, StopAt);

      const bool interrupted = htp.read(renko);
      _FirstRun = false;

      if(!interrupted)
      {
        Comment("RenkoChart (" + (string)RenkoBoxSize + "pt): open ", _SymbolName, " / ", renko.getBoxCount(), " bars");
      }
      else
      {
        Print("Interrupted. Custom symbol data is inconsistent - please, reset or delete");
      }
    }
    else if(StopAt == 0) // process online if not stopped explicitly
    {
      online.read(renko);
    }
  }
At the first start, the end of renko history is searched, the HistoryTickProvider object is created with the start time StartFrom or from the history (if found) and then all ticks are read. All further ticks are processed online through the CurrentTickProvider object (it is created in the global context, just like the Renko object).
Let's generate a renko chart based on EURUSD with a bar size of 100 pips starting from 2019. To do this, run the EA on the EURUSD H1 chart with default settings except for StartFrom. Timeframe matters only when the EA is restarted with available renko history - in this case renko recalculation will start with an indent for the time of the bar to which the last but one renko block falls.
For example, for the original EURUSD H1:
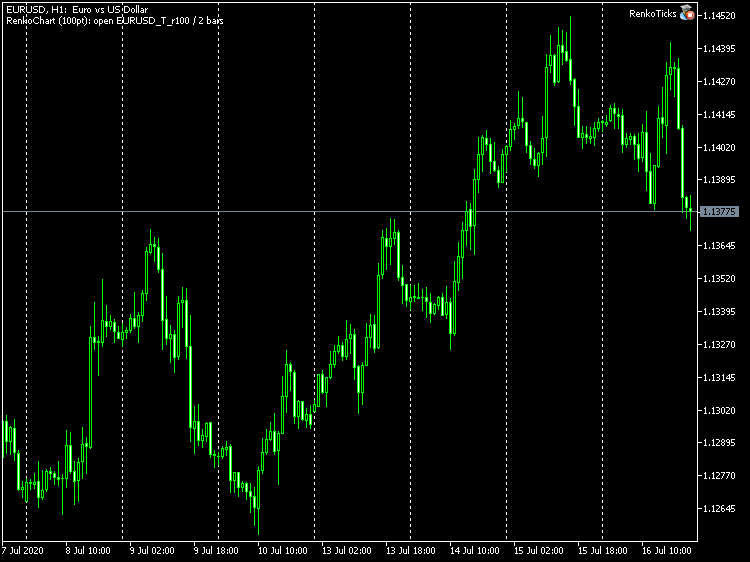
EURUSD H1 chart with the RenkoTicks EA
we will receive the following chart:
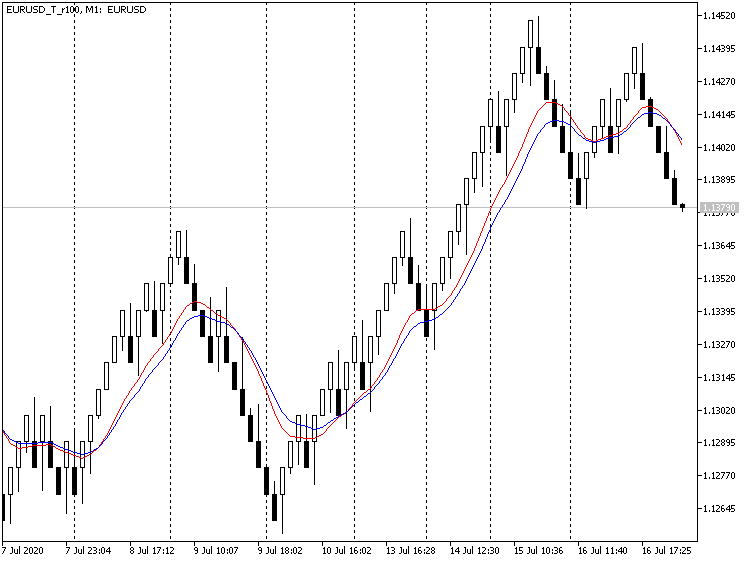
EURUSD renko chart with the block size of 100 points
For visual clarity, I have added two MAs.
Now that we have received quotes for the renko symbol, it is time to develop a test EA for trading.
A trading Expert Advisor based on an intersection of two MAs
Let us use one of the simplest trading strategies which is the intersection of two Moving Averages. The previous screenshot demonstrates the idea. When the fast MA (red) crosses the slow MA (blue) upwards or downwards, open Buy or Sell respectively. This is a reversal system.
It would be hard to create an Expert Advisor from scratch, but MetaTrader 5 provides an MQL Wizard which can generate Expert Advisors based on a library of standard classes (supplied with the terminal). It is very convenient for traders who are not familiar with programming. The resulting code structure is common for a large number of robots, and therefore it is a good idea to use it for the main task - for adapting robots to trading on custom symbols. Expert Advisors created without a standard library can also be adapted according to the same method, but since their creation can differ much, the programmer will have to provide the appropriate amendments, if needed (in general, experienced programmers can adapt any other EAs using our example).
Oddly enough, the standard library has no signal of two MAs intersection, although it is one of the most popular strategies (at least it is the most popular when learning algorithmic trading). And thus, we need to write the appropriate signal module. Let's call it Signal2MACross.mqh. Below is its code that meets the required rules for signal to be used with the MQL Wizard.
It starts with a "header" — a special comments with the signal description in the appropriate format, which makes it accessible from MetaEditor:
  //--- wizard description start
  //+------------------------------------------------------------------+
  //| Description of the class                                         |
  //| Title=Signals of 2 MAs crosses                                   |
  //| Type=SignalAdvanced                                              |
  //| Name=2MA Cross                                                   |
  //| ShortName=2MACross                                               |
  //| Class=Signal2MACross                                             |
  //| Page=signal_2mac                                                 |
  //| Parameter=SlowPeriod,int,11,Slow MA period                       |
  //| Parameter=FastPeriod,int,7,Fast Ma period                        |
  //| Parameter=MAMethod,ENUM_MA_METHOD,MODE_LWMA,Method of averaging  |
  //| Parameter=MAPrice,ENUM_APPLIED_PRICE,PRICE_OPEN,Price type       |
  //| Parameter=Shift,int,0,Shift                                      |
  //+------------------------------------------------------------------+
  //--- wizard description end
The class name (line Class) must match the name of a real class in further MQL code. The signal has 5 parameters typical for two MAs: 2 periods (fast and slow), averaging method, price type and shift.
The class was inherited from CExpertSignal. It contains two instances of CiMA indicator objects, variables with working parameters, parameter setter methods (method names must match the names in the header). Also, the class has redefined virtual methods which are called during indicator initialization, as well as when checking settings and determining Buy and Sell signals.
  class Signal2MACross : public CExpertSignal
  {
    protected:
      CiMA              m_maSlow;         // object-indicator
      CiMA              m_maFast;         // object-indicator

      // adjustable parameters
      int               m_slow;
      int               m_fast;
      ENUM_MA_METHOD    m_method;
      ENUM_APPLIED_PRICE m_type;
      int               m_shift;

      // "weights" of market models (0-100)
      int               m_pattern_0;      // model 0 "fast MA crosses slow MA"

    public:
                        Signal2MACross(void);
                       ~Signal2MACross(void);

      // parameters setters
      void              SlowPeriod(int value) { m_slow = value; }
      void              FastPeriod(int value) { m_fast = value; }
      void              MAMethod(ENUM_MA_METHOD value) { m_method = value; }
      void              MAPrice(ENUM_APPLIED_PRICE value) { m_type = value; }
      void              Shift(int value) { m_shift = value; }

      // adjusting "weights" of market models
      void              Pattern_0(int value) { m_pattern_0 = value; }

      // verification of settings
      virtual bool      ValidationSettings(void);

      // creating the indicator and timeseries
      virtual bool      InitIndicators(CIndicators *indicators);

      // checking if the market models are formed
      virtual int       LongCondition(void);
      virtual int       ShortCondition(void);

    protected:
      // initialization of the indicators
      bool              InitMAs(CIndicators *indicators);

      // getting data
      double            FastMA(int ind) { return(m_maFast.Main(ind)); }
      double            SlowMA(int ind) { return(m_maSlow.Main(ind)); }
  };
The class describes the only strategy (pattern or model): when the fast MA crosses the slow one, a Buy (for upward cross) or a Sell (for downward cross) is initialized. The model weight is equal to 100 by default.
  Signal2MACross::Signal2MACross(void) : m_slow(11), m_fast(7), m_method(MODE_LWMA), m_type(PRICE_OPEN), m_shift(0), m_pattern_0(100)
  {
  }
Position opening conditions are determined in the following two methods (strictly speaking, the code checks not the intersection, but the positioning of one MA relative to the other, while the effect will be the same for the system which is always in the market, however the code is simpler):
  int Signal2MACross::LongCondition(void)
  {
    const int idx = StartIndex();

    if(FastMA(idx) > SlowMA(idx))
    {
      return m_pattern_0;
    }
    return 0;
  }

  int Signal2MACross::ShortCondition(void)
  {
    const int idx = StartIndex();

    if(FastMA(idx) < SlowMA(idx))
    {
      return m_pattern_0;
    }
    return 0;
  }
The StartIndex function is defined in the parent class. As you can see from the code, the index is the number of the bar for which the signal is analyzed. If every tick-based operation is selected in EA settings (Expert_EveryTick = true, see further), then the starting index is equal to 0; if not (i.e. operates by closed bars), the index is 1.
Save the Signal2MACross.mqh file to the MQL5/Include/Expert/Signal/MySignals folder, then restart MetaEditor (if it is running) to pick up the new module in the MQL Wizard.
Now we can generate an Expert Advisor based on our signal. Select 'File' -> 'New' in the menu and open the Wizard dialog. Then follow the below steps:
- select "Expert Adviser (generate)"
- set EA name, for example Experts\Examples\MA2Cross
- add signal "Signals of 2 MAs crosses"
- use "Trailing stop not used"
- use "Trading with fixed volume"
As a result, you will receive the following EA code:
  #include <Expert\Expert.mqh>
  #include <Expert\Signal\MySignals\Signal2MACross.mqh>
  #include <Expert\Trailing\TrailingNone.mqh>
  #include <Expert\Money\MoneyFixedLot.mqh>

  //+------------------------------------------------------------------+
  //| Inputs                                                           |
  //+------------------------------------------------------------------+
  // inputs for expert
  input string             Expert_Title              = "MA2Cross";  // Document name
  ulong                    Expert_MagicNumber        = 7623;
  bool                     Expert_EveryTick          = false;
  // inputs for main signal
  input int                Signal_ThresholdOpen      = 10;          // Signal threshold value to open [0...100]
  input int                Signal_ThresholdClose     = 10;          // Signal threshold value to close [0...100]
  input double             Signal_PriceLevel         = 0.0;         // Price level to execute a deal
  input double             Signal_StopLevel          = 0.0;         // Stop Loss level (in points)
  input double             Signal_TakeLevel          = 0.0;         // Take Profit level (in points)
  input int                Signal_Expiration         = 0;           // Expiration of pending orders (in bars)
  input int                Signal_2MACross_SlowPeriod = 11;         // 2MA Cross(11,7,MODE_LWMA,...) Slow MA period
  input int                Signal_2MACross_FastPeriod = 7;          // 2MA Cross(11,7,MODE_LWMA,...) Fast Ma period
  input ENUM_MA_METHOD     Signal_2MACross_MAMethod  = MODE_LWMA;   // 2MA Cross(11,7,MODE_LWMA,...) Method of averaging
  input ENUM_APPLIED_PRICE Signal_2MACross_MAPrice   = PRICE_OPEN;  // 2MA Cross(11,7,MODE_LWMA,...) Price type
  input int                Signal_2MACross_Shift     = 0;           // 2MA Cross(11,7,MODE_LWMA,...) Shift
  input double             Signal_2MACross_Weight    = 1.0;         // 2MA Cross(11,7,MODE_LWMA,...) Weight [0...1.0]
  // inputs for money
  input double             Money_FixLot_Percent      = 10.0;        // Percent
  input double             Money_FixLot_Lots         = 0.1;         // Fixed volume

  //+------------------------------------------------------------------+
  //| Global expert object                                             |
  //+------------------------------------------------------------------+
  CExpert ExtExpert;

  //+------------------------------------------------------------------+
  //| Initialization function of the expert                            |
  //+------------------------------------------------------------------+
  int OnInit()
  {
    // Initializing expert
    if(!ExtExpert.Init(Symbol(), Period(), Expert_EveryTick, Expert_MagicNumber))
    {
      printf(__FUNCTION__ + ": error initializing expert");
      ExtExpert.Deinit();
      return(INIT_FAILED);
    }
    // Creating signal
    CExpertSignal *signal = new CExpertSignal;
    if(signal == NULL)
    {
      printf(__FUNCTION__ + ": error creating signal");
      ExtExpert.Deinit();
      return(INIT_FAILED);
    }

    ExtExpert.InitSignal(signal);
    signal.ThresholdOpen(Signal_ThresholdOpen);
    signal.ThresholdClose(Signal_ThresholdClose);
    signal.PriceLevel(Signal_PriceLevel);
    signal.StopLevel(Signal_StopLevel);
    signal.TakeLevel(Signal_TakeLevel);
    signal.Expiration(Signal_Expiration);

    // Creating filter Signal2MACross
    Signal2MACross *filter0 = new Signal2MACross;
    if(filter0 == NULL)
    {
      printf(__FUNCTION__ + ": error creating filter0");
      ExtExpert.Deinit();
      return(INIT_FAILED);
    }
    signal.AddFilter(filter0);

    // Set filter parameters
    filter0.SlowPeriod(Signal_2MACross_SlowPeriod);
    filter0.FastPeriod(Signal_2MACross_FastPeriod);
    filter0.MAMethod(Signal_2MACross_MAMethod);
    filter0.MAPrice(Signal_2MACross_MAPrice);
    filter0.Shift(Signal_2MACross_Shift);
    filter0.Weight(Signal_2MACross_Weight);

    ...

    // Check all trading objects parameters
    if(!ExtExpert.ValidationSettings())
    {
      ExtExpert.Deinit();
      return(INIT_FAILED);
    }

    // Tuning of all necessary indicators
    if(!ExtExpert.InitIndicators())
    {
      printf(__FUNCTION__ + ": error initializing indicators");
      ExtExpert.Deinit();
      return(INIT_FAILED);
    }

    return(INIT_SUCCEEDED);
  }
The full code of MA2Cross.mq5 is attached to the article. Everything is ready for compilation, testing in the Strategy Tester and even optimization on any symbol, including our custom renko. Since we are interested exactly in renko, we need to explain a few moments.
Each renko block, in its "rectangular" form, does not exist until it is completely formed by the price movement. When the next block appears, we do not know not only its closing price, but also its open price, because there are two possible opposite directions: up and down. When the block finally closes, it is the closing price that is decisive and most characteristic. That is why the default value of the Signal_2MACross_MAPrice parameter in the EA is changed to PRICE_CLOSE - changing it is not recommended. You can experiment with other price types, but the idea of renko is not only to gent unbound from time, but also to remove small price fluctuations, which is achieved by quantizing according to the brick size.
Note that the 0th renko bar is always incomplete (in most cases it is a candlestick with no body, not a rectangle) that is why we use signal from the 1st bar. For this purpose, we set Expert_EveryTick parameter value equal to false.
Generate EURUSD-based custom renko with the block size of 100 points. As a result, we obtain the symbol EURUSD_T_r100. Select it in the tester. Make sure to set the M1 timeframe.
Let us see how the Expert Advisor behaves on this symbol for the period 2019-2020 (first half), for example, with default periods of 7 and 11 (other combinations can be checked independently using optimization).
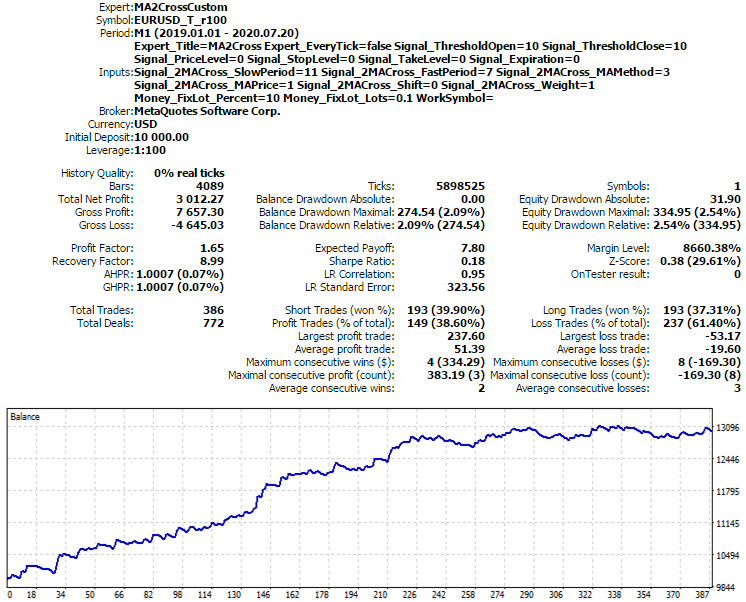
The result of the MA2CrossCustom strategy on 100-point renko chart derived from EURUSD
To compare the custom symbol with a real symbol, I provide here a report of the MA2CrossCustom EA which is similar to MA2Cross with an empty WorkSymbol parameter. In the next section we will consider how to obtain MA2CrossCustom from MA2Cross.
As can be seen from the deals table, the deals are executed at prices that are multiples of the block size: sell prices match fully, and buy prices differ by the spread size (our renko generator saves to each bar the maximum spread value registered during its formation, if you wish you can change this behavior in the source code). Renko is built by the price type used in the source chart. In our case it is bid. Last price will be used for exchange instruments.
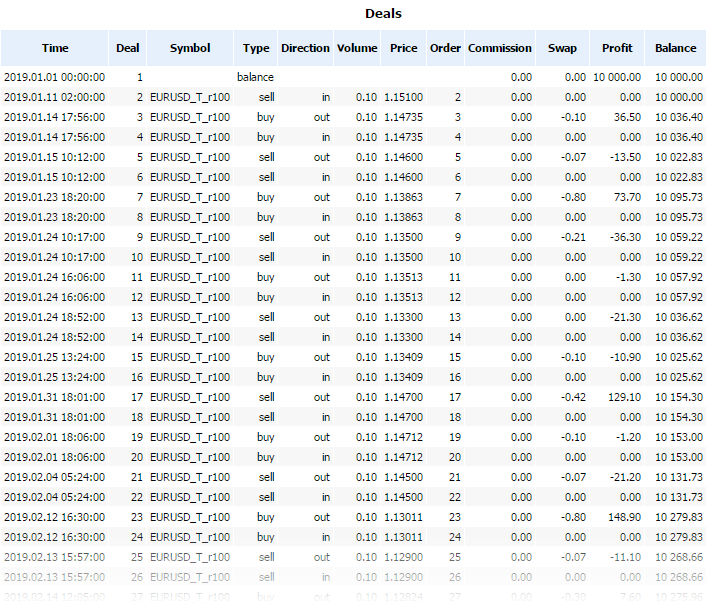
Deals table when trading EURUSD-based custom renko symbol
Now the result seems too good to be true. Really, there are many hidden nuances.
Renko symbol trading in the tester affects the accuracy of results in any mode: by Open price, M1 OHLC and by ticks.
Bar open price of a standard renko is not always reached at the time the bar is marked with, but in many cases it is reached later (because the price "walks" up and down for a while inside the renko size and may eventually change direction, forming a reversal bar). The bar marking time is the completion time of the previous bar.
The close price does not correspond to the close time, because the renko bar is the M1 bar, i.e. it has a fixed duration of 1 minute.
It is possible to generate a non-standard renko, in which bars are marked with the completion time, not the beginning time. Then the close price will correspond to the close time. However, the open time will be 1 minute earlier than the close time, and thus it will not correspond to the real open price (it is the close price plus/minus the renko size).
Renko analysis is supposed to be performed by the formed bars, but their characteristic price is the close price, but during bar-by-bar operation, the tester provides only the open price for the current (last) bar (there is no mode by close prices). Here, bar open prices are predictors by definition. If we use signals from closed bars (usually from the 1st), deals are anyway executed at the current price of the 0th bar. Even if we use tick modes, the tester generates ticks for renko according to common rules, by using reference points based on each bar configuration. The tester does not take into account the specific structure and behavior of renko quotes (which we are trying to visually emulate with M1 bars). If we hypothetically imagine a one-time formation of a whole bar, it will still have a body - and for such bars the tester generates ticks starting from the open price. If we set bar tick volume equal to one, the bar will lose configuration (will turn into a price label with equal OHLC).
Thus, all renko construction methods will have order execution artifacts when testing a custom renko symbol.
In other words, because of the renko structure itself we have tester grails on renko symbols because it peeps into the future at a step equal to the renko bar size.
That is why it is necessary to test the trading system not on a separate renko bar but combined with the execution of trading orders on a real symbol.
Renko provides analytics and timing - when to enter the market.
So far, we have only tested the EA's ability to trade on a custom symbol. This sets a limitation on EA application only in the tester. To make the EA universal, i.e. being able to trade the original symbol online while running on the renko chart, we need to add a few things. This will also help as solve the problem with over-optimistic results.
Adaptation of Expert Advisors for trading on custom symbols charts
A custom symbol is only known to the client terminal and it does not exist on the trade server. Obviously an Expert Advisor tunning in a custom symbol chart must generate all trade orders for the original symbol (on which the custom symbol is based). As the simplest solution to this problem, the EA can be run on the original symbol chart, but receive signals (for example, from indicators) from a custom symbol. However, many traders prefer to see the whole picture. Furthermore, selective code modifications can produce errors. It is desirable to minimize edits to the source code.
Unfortunately, the name of the original symbol and of renko created on its basis cannot be linked by means of the platform itself. A convenient solution would be to have a string field "origin" or "parent" in custom symbol properties, into which we could write the name of the real symbol. It would be empty by default. But when filled, the platform would automatically replace the symbol in all trading orders and history requests. Since this mechanism does not exist in the platform, we will have to implement it ourselves. The names of the source and custom symbol will be set using parameters. Custom symbol properties have a field with suitable meaning - SYMBOL_BASIS. But since we cannot guarantee that arbitrary generators of custom symbols (any MQL programs) will correctly fill the parameter or will use it exactly for this purpose, we need to provide another solution.
For this purpose, I have developed the CustomOrder class (see CustomOrder.mqh attached below). It contains wrapper methods for all MQL API functions related to sending of trade orders and history requests, which contain a string parameter with the symbol name of the instrument. These methods replace a custom symbol with the current working symbol or vice versa. All other API function do not require the "hook". The code is shown below.
  class CustomOrder
  {
    private:
      static string workSymbol;

      static void replaceRequest(MqlTradeRequest &request)
      {
        if(request.symbol == _Symbol && workSymbol != NULL)
        {
          request.symbol = workSymbol;
          if(request.type == ORDER_TYPE_BUY
          || request.type == ORDER_TYPE_SELL)
          {
            if(request.price == SymbolInfoDouble(_Symbol, SYMBOL_ASK)) request.price = SymbolInfoDouble(workSymbol, SYMBOL_ASK);
            if(request.price == SymbolInfoDouble(_Symbol, SYMBOL_BID)) request.price = SymbolInfoDouble(workSymbol, SYMBOL_BID);
          }
        }
      }

    public:
      static void setReplacementSymbol(const string replacementSymbol)
      {
        workSymbol = replacementSymbol;
      }

      static bool OrderSend(MqlTradeRequest &request, MqlTradeResult &result)
      {
        replaceRequest(request);
        return ::OrderSend(request, result);
      }

      static bool OrderCalcProfit(ENUM_ORDER_TYPE action, string symbol, double volume, double price_open, double price_close, double &profit)
      {
        if(symbol == _Symbol && workSymbol != NULL)
        {
          symbol = workSymbol;
        }
        return ::OrderCalcProfit(action, symbol, volume, price_open, price_close, profit);
      }

      static string PositionGetString(ENUM_POSITION_PROPERTY_STRING property_id)
      {
        const string result = ::PositionGetString(property_id);
        if(property_id == POSITION_SYMBOL && result == workSymbol) return _Symbol;
        return result;
      }

      static string OrderGetString(ENUM_ORDER_PROPERTY_STRING property_id)
      {
        const string result = ::OrderGetString(property_id);
        if(property_id == ORDER_SYMBOL && result == workSymbol) return _Symbol;
        return result;
      }

      static string HistoryOrderGetString(ulong ticket_number, ENUM_ORDER_PROPERTY_STRING property_id)
      {
        const string result = ::HistoryOrderGetString(ticket_number, property_id);
        if(property_id == ORDER_SYMBOL && result == workSymbol) return _Symbol;
        return result;
      }

      static string HistoryDealGetString(ulong ticket_number, ENUM_DEAL_PROPERTY_STRING property_id)
      {
        const string result = ::HistoryDealGetString(ticket_number, property_id);
        if(property_id == DEAL_SYMBOL && result == workSymbol) return _Symbol;
        return result;
      }

      static bool PositionSelect(string symbol)
      {
        if(symbol == _Symbol && workSymbol != NULL) return ::PositionSelect(workSymbol);
        return ::PositionSelect(symbol);
      }

      static string PositionGetSymbol(int index)
      {
        const string result = ::PositionGetSymbol(index);
        if(result == workSymbol) return _Symbol;
        return result;
      }
      ...
  };

  static string CustomOrder::workSymbol = NULL;
To minimize edits in the source code, the following macros are used (for all methods):
  bool CustomOrderSend(const MqlTradeRequest &request, MqlTradeResult &result)
  {
    return CustomOrder::OrderSend((MqlTradeRequest)request, result);
  }

  #define OrderSend CustomOrderSend
They enable automatic redirection of all standard API function calls to CustomOrder class methods. For this purpose, include CustomOrder.mqh to the EA and set the working symbol:
  #include <CustomOrder.mqh>
  #include <Expert\Expert.mqh>
  ...
  input string WorkSymbol = "";

  int OnInit()
  {
    if(WorkSymbol != "")
    {
      CustomOrder::setReplacementSymbol(WorkSymbol);

      // force a chart for the work symbol to open (in visual mode only)
      MqlRates rates[1];
      CopyRates(WorkSymbol, PERIOD_H1, 0, 1, rates);
    }
    ...
  }
It is important that the #include <CustomOrder.mqh> directive comes first, before all others. Thus, it will affect all source codes, including connected standard libraries. If the wildcard is not specified, the connected CustomOrder.mqh has no effect on the EA and it transfers control to the standard API functions.
The modified MA2Cross EA has been renamed to MA2CrossCustom.mq5.
Now we can set WorkSymbol to EURUSD, while leaving all other settings the same, and start testing. Now the EA actually trades EURUSD, although it runs on the renko symbol chart.
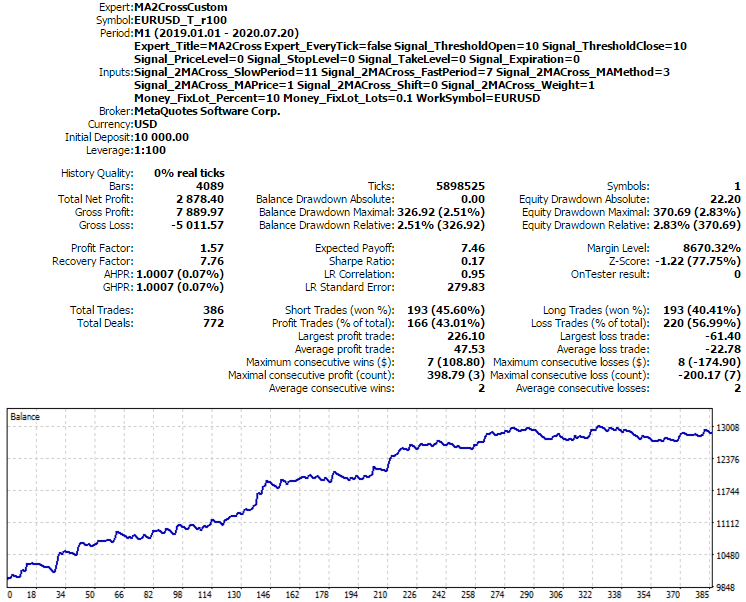
The result of the MA2CrossCustom strategy on 100-point renko chart when trading the real EURUSD symbol
This time the result is closer to reality.
In EURUSD trades, prices differ from renko bar close prices more significantly. This is because renko bars are always marked by a minute beginning (this is a limitation of the M1 timeframe in the platform), but the price crosses the bar border at arbitrary moments inside the minute. Since the Expert Advisor operates on the chart in a bar-by-bar mode (not to be confused with the tester mode), the signal emergence is "moved" to the opening of a EURUSD minute bar, when the price is usually different. On average, the error is the math expectation of the range of minute bars per trade.
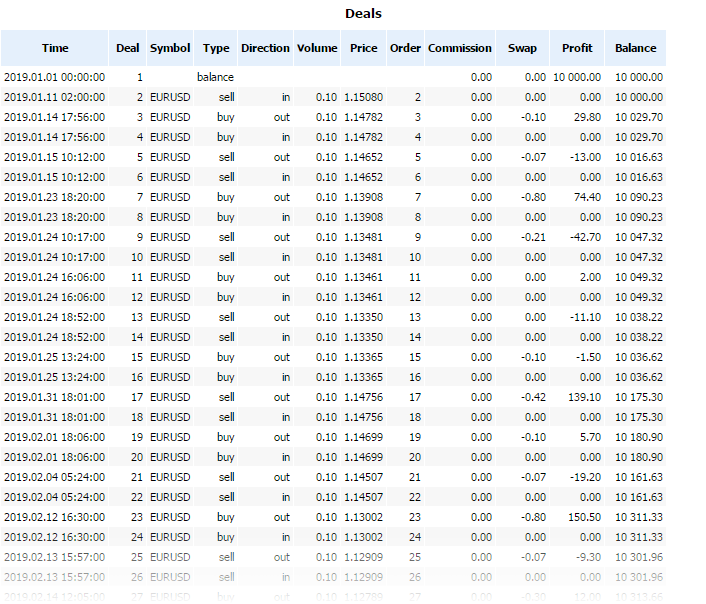
EURUSD trades performed by the Expert Advisor from a Renko chart derived from EURUSD
To eliminate discrepancies, the EA would have to process all ticks, but we have already found out that the logic of tick generation in the tester differs from that of renko formation: in particular, the open price of reversal bars always has a gap equal to a renko block relative to the close of the previous bar.
This problem does not exist in online trading.
Let us check the functionality of CustomOrder using another Expert Advisor, written without using the standard library. We will use for this the ExprBot EA from the article concerning Calculation of math expressions — it also exploits the two MAs intersection strategy and it performs trading operation using the MT4Orders library. The modified Expert Advisor ExprBotCustom.mq5 is attached below, along with the required header files (ExpresSParserS folder).
Below are the results in the range between 2019-2020 (first half of the year), with the same settings (periods 7/11, averaging type LWMA, CLOSE prices on the 1st bar).
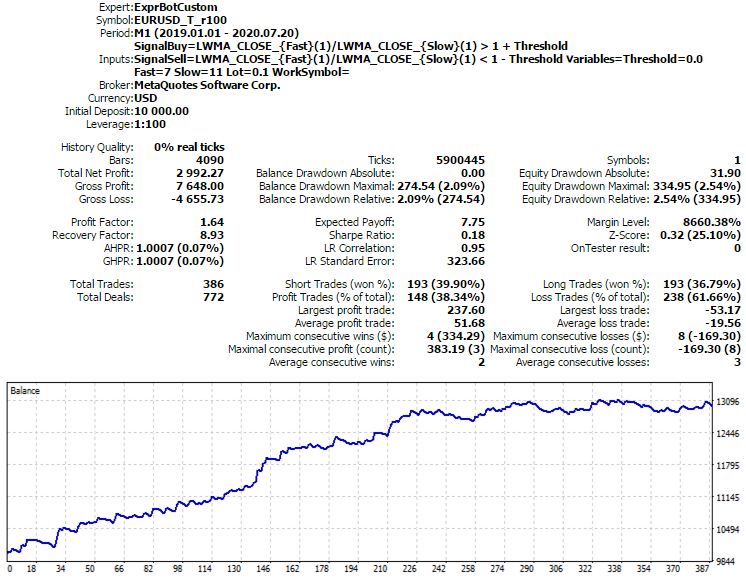
The result of the ExprBotCustom strategy on 100-point renko chart derived from EURUSD
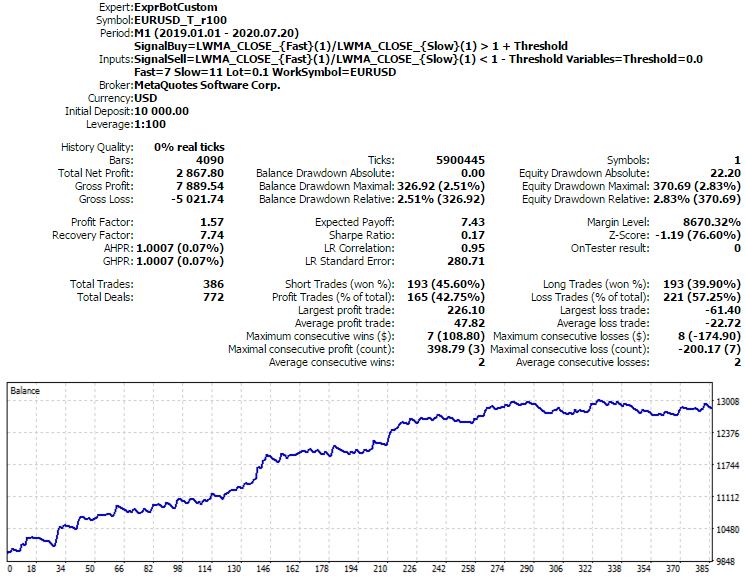
The result of the ExprBotCustom strategy on 100-point renko chart when trading the real EURUSD symbol
These results are very similar to those obtained with the MA2CrossCustom EA.
We can conclude that the proposed approach solves the problem. However, the current CustomOrder implementation is only a basic minimum. Improvements may be required depending on the trading strategy and the specifics of the working symbol.
Conclusion
We have considered several ways to generate custom symbols using working symbol quotes provided by the broker. Special data generalization and accumulating algorithms allow seeing usual quotes from a different angle and building advanced trading systems on their basis.
Of course, custom symbols provide much more possibilities. The potential applications of this technology are much broader. For example, we can use synthetic symbols, volume delta and third-party data sources. The described program transformation enables the use of these possibilities on standard MetaTrader 5 charts, in the Strategy Tester and in the online mode.
Translated from Russian by MetaQuotes Ltd.
Original article: https://www.mql5.com/ru/articles/8226
 Neural networks made easy (Part 2): Network training and testing
 CatBoost machine learning algorithm from Yandex with no Python or R knowledge required
 What is a trend and is the market structure based on trend or flat?
- Free trading apps
- Over 8,000 signals for copying
- Economic news for exploring financial markets
You agree to website policy and terms of use
Can you kindly manage time,removing this error
Just remove 0 inside the curly braces. Please follow MQL5 syntax changes in the news announces. This one is a bit old - I can't remember exact reference now.
This one is a bit old,,,
Once again, it took me 3 years to find this work of art. If this is "old", old has just met... slow. Ha. Thank you.
Regarding RenkoTicks.mq5, I experienced a points to pips conversion issue with 3 digit pricing. I previously experienced the same thing with some utilities in MT4, so I implemented the same fix:
Here is a small but important improvement in the custom signal based on 2 MA crossing. The underlying indicator objects maintain internal buffers with indicator's data (not only MA case, but in general), hence calling m_maFast.Main(ind) or m_maSlow.Main(ind) leads to reading somewhat outdated (cached) data from the objects, not from indicators themselves, if your trading system trades by ticks (!). Now it's replaced with the following calls to GetData which is basically is a wrapper for direct CopyBuffer:
The updated header file is attached. It should be placed in /MQL5/Include/Expert/Signal/MySignals/. Without this the signals have been built by completed bars.
It's turned out to be even worse. Some times timeseries are not re-calculated yet when new tick is fired, hence bar index should be adjusted dynamically for trade signal analysis. For example (rough approach):
This is critical for EAs trading on bar opening, and for symbols with sparse ticks.