
Comparing different types of moving averages in trading
Contents
Introduction
Moving Average (MA) is one of the most popular technical indicators in the Forex market. Our purpose is to consider various MAs as well as to compare them within trading under equal conditions of entering and exiting of the market.
Let us consider seven types of moving averages: Moving Average, Adaptive Moving Average, Double Exponential Moving Average, Fractal Adaptive Moving Average, Triple Exponential Moving Average, Variable Index Dynamic Average and Nick Rypock Moving Average.
Types of moving averages
This section contains a short description and formulae to calculate the moving averages.
Moving Average technical indicator
Moving Average is one of the most widespread technical indicators. It depicts the average value of symbol price for a given period of time. There are different variants of MA indicator:
- Simple Moving Average (SMA);
- Exponential Moving Average (EMA);
- Smoothed Moving Average (SMMA);
- Linear Weighted Moving Average (LWMA).
Below, we give calculating formulae for each variant of the Moving Average indicator:
| Variant of Moving Average indicator | Calculating formula | Comment |
|---|---|---|
| Simple Moving Average (SMA) |  |
|
| Exponential Moving Average (EMA) | |
|
| Smoothed Moving Average (SMMA) |  |
|
| Linear Weighted Moving Average (LWMA) |  |
|
Let us consider displays of different variants of Moving Average indicator at a price chart. Figure 1 demonstrates variants of Moving Average indicator with the period of 12, as calculated by Close prices.

Fig. 1. Variants of Moving Average indicator
As the figure shows, Simple Moving Average in flat slightly fluctuates and this can yield false trade signals. Smoothed Moving Average, as it follows from its name, looks more smoothed. Exponential Moving Average and Linear Weighted Moving Average behave somewhat similarly in flat. Linear Weighted Moving Average during trend movement approaches prices closer than the rest of lines and, as opposed to SMMA and EMA, it does not depend on its previous value.
Exponential moving average (EMA) - based technical indicators
Exponential moving average (EMA) underlies a number of other technical indicators.
| Indicator | Description | Calculating formula | Description of calculating formula |
|---|---|---|---|
Adaptive Moving Average (AMA) | MA with low sensitivity to noises. If compared with the rest of moving averages this indicator has a minimal lag when determining trend reversals and change. At price spikes it does not give strong fluctuations and thus, it does not cause false trade signals. | |
|
Double Exponential Moving Average | It is used to smooth price or values of other indicators. The main advantage is absence of false signals at the moments when the price moves in zigzag fashion. It sustains position maintenance during the period of a strong trend and reduces signal lag as compared to ordinary EMA. | |
|
Triple Exponential Moving Average | Synthesis of single, double and triple exponential MA. The total lag is much less than that for each of those MAs separately. The indicator is applied instead of traditional moving averages as well for smoothing a price chart and values of other indicators. | |
|
Fractal Adaptive Moving Average | Here the smoothing factor is calculated on the basis of the current fractal dimension of price series. Indicator advantage is that it follows a strong trend and drastically slows down during consolidation periods. | |
|
Variable Index Dynamic Average | This is an EMA with its averaging period changing dynamically and depending on market volatility. Market volatility is measured by Chande Momentum Oscillator (CMO). It measures a ratio between totals of positive and negative increments for a given period (CMO period). CMO value is a coefficient for EMA smoothing factor. Thus, two parameters are set with the indicator: CMO oscillator period and EMA smoothing period. | |
|
Nick Rypock Moving Average | The indicator is not a part of a standard MetaTrader 5 distribution. Its main advantage is that there are almost no fluctuations in flat; it strictly follows the trend. | |
|
Differences of indicators from the ordinary EMA
Let us compare the above considered indicators with the ordinary EMA. Figure 2 demonstrates:
- Adaptive Moving Average (period - 12, fast EMA — 2, slow EMA — 30, shift — 0)
- Double Exponential Moving Average (period - 12, shift - 0)
- Fractal Adaptive Moving Average (period - 12, shift - 0)
- Exponential Moving Average (period - 12, shift - 0)
- Triple Exponential Moving Average (period - 12, shift - 0)
- Variable Index Dynamic Average (CMO period — 12, EMA period — 12, shift — 0)
- Nick Rypock Moving Average (method of averaging — SMA, depth of smoothing — 3, smoothing parameter — 15 (not used for SMA), Kf — 1, Fast — 12, Sharp — 2, vertical and horizontal shift — 0).
All the indicators are made on the basis of Close prices.

Fig. 2 Comparison of Exponential moving average (EMA) - based indicators
As figure 2 shows, DEMA and TEMA as compared to ordinary EMA, more accurately follow the price movement; however, their fluctuations in flat may give false trade signals. The rest of indicators (FRAMA, AMA, VIDYA, NRMA) in flat almost do not swing and do not respond to minor price changes. In trend, almost all the indicators behave equally. TEMA and FRAMA responded to a change in trend direction faster than others.
Comparing various types of moving averages
Let us compare the above considered technical indicators on the trading strategy with equal conditions of entering and exiting the market.
Trading strategy specification
To test the indicator, a simple strategy with obvious conditions of entering and exiting the market was chosen.
Market entry conditions.
- Preliminary buy signal: indicator line crosses the body of bullish candlestick. Further, if the difference between the current and previous values of the indicator is more than the specified parameter Growth factor (indicator grows), we should open a buy trade.
- Preliminary sell signal: indicator line crosses the body of bearish candlestick. Further, if the difference between the previous and current values of the indicator is more than the specified parameter Growth factor (indicator falls), we should open a sell trade.
Market exit conditions:
- upon reaching TakeProfit or StopLoss levels;
- if a buy trade is opened and indicator line has crossed the body of bearish candlestick;
- if a buy trade is opened and indicator line has crossed the body of bullish candlestick.
Figures 3, 4 show examples of trading on such strategy.

Fig. 3. Example of a buy trade

Fig. 4. Example of a sell trade
A similar trading strategy is realised in Moving Average Expert Adviser which can be found in MetaTrader 5 terminal navigator.
Creation of Expert Adviser
Let us write Expert Adviser for trading on the above specified strategy. A feature of choosing between one of the following technical indicators will be implemented in Expert Adviser: MA (with methods Simple, Exponential, Smoothed, Linear Weighted), DEMA, TEMA, FRAMA, AMA, VIDYA, NRMA. The selected indicator will be drawn on the chart. As well, we may specify indicator input parameters, set size of TakeProfit and StopLoss, size of a lot for trading, value of indicator growth coefficient (Growth factor).We will check conditions of entering and exiting the market only at a new bar instead of each tick. At first, availability of an open position is checked (for this purpose, SelectPosition function is provided in the EA). If there are no such positions we check the entry condition (CheckForOpen function), if available - we check the exit one (CheckForClose function).
Full Expert Adviser code is attached to the article (file MultiMovingAverageExpert.mq5). Let us consider only realization of entry/exit conditions. Checkup of entry conditions is realized in CheckForOpen function as follows:
   if(rt[0].open>ma[0] && rt[0].close<ma[0])               ////checkup of crossing of the body of bearish candlestick
     {
      if(BuyCross)
         BuyCross=false;                                   //delete the buy precondition (if before that there was crossing of bullish candlestick by the line)
      SellCross=true;                                      //set Sell trade precondition
     }
   else
   if(rt[0].open<ma[0] && rt[0].close>ma[0])               //checkup of crossing of the body of bullish candlestick
     {
      if(SellCross)
         SellCross=false;                                 //delete Sell trade precondition (if prior to that there was crossing of bearish candlestick by indicator line)
      BuyCross=true;                                      //set Buy trade precondition
     }
   if(SellCross && ma[0]>ma[1] && ma[0]-ma[1]>GFactor)
     {
      signal=ORDER_TYPE_SELL;                             //if indicator falls, sell condition occurs
      SellCross=false;                                    //delete Sell trade precondition
     }
   else
   if(BuyCross && ma[1]>ma[0] && ma[1]-ma[0]>GFactor)
     {
      signal=ORDER_TYPE_BUY;                             // if indicator grows, buy condition occurs
      BuyCross=false;                                    //delete Buy trade precondition
     }
- Arrayrt[] keeps historical data on prices
- Array ma[] keeps indicator values
- rt[0].close, rt[0].open is the value of the previous close/open price
- ma[0] is the previous value of indicator
- ma[1] — current value of indicator
- GFactor is coefficient of indicator growth
- Variable signal is further used to form a buy or sell trade request.
Checkup of exit conditions is realized in CheckForClose function as follows:
   bool signal=false;
   long type=PositionGetInteger(POSITION_TYPE);

   if(type==(long)POSITION_TYPE_BUY && rt[0].open>ma[0] && rt[0].close<ma[0])       //if buying position is open and
                                                                                    //indicator line crosses the body of bearish candlestick
      signal=true;                                                                  //signal to deal closing
   if(type==(long)POSITION_TYPE_SELL && rt[0].open<ma[0] && rt[0].close>ma[0])      //if buy position is open and
                                                                                    //indicator line crosses the body of bullish candlestick
      signal=true;                                                                  //signal to deal closing
   if(signal)
     {
      if(TerminalInfoInteger(TERMINAL_TRADE_ALLOWED) && Bars(_Symbol,_Period)>100)
         ExtTrade.PositionClose(_Symbol,3);                                         //close deal
     }
Expert Adviser testing and performance
We will test Expert Adviser on currency pairs EURUSD, GBPUSD, USDJPY, USDCAD, AUDUSD, timeframe H1. TakeProfit — 80 points, StopLoss — 50 points, volume of trade lot is 0.1, deposit - 10,000 USD, testing mode - all ticks, leverage 1:100, 5-digit quotes, server: MetaQuotes-Demo.
Testing performed for a period from 01.01.2016 to 09.09.2017.
For each indicator, there were optimised the period (variation range - 5 - 50, pace 1) and parameter Growth factor (variation range 0.0001 — 0.0001, pace 0.001).
For Variable Index Dynamic Average, there were optimized EMA period (as indicator calculation period) and CMO oscillator period (variation range - 5 — 50, pace 1).
For Nick Rypock Moving Average, the Fact parameter was optimized which determines the period of the indicator calculation.
The indicator values are calculated on the basis of Close price without horizontal and vertical shift. Some indicators have additional parameters:
| Name of moving average | Parameter values |
|---|---|
| Adaptive Moving Average |
|
| Nick Rypock Moving Average |
|
Testing results on currency pair EURUSD
Testing results on currency pair EURUSD (variants with the maximum total net profit) are presented in the below table:
| Name of moving average | Parameters optimized and their values | Q-ty of trades | Total net profit | Profit factor | Recovery factor | Sharpe ratio | Balance drawdown maximal | Equity drawdown maximal |
|---|---|---|---|---|---|---|---|---|
| Moving Average (method of averaging Simple) | Period —15, Growth factor — 0.0002 | 383 | 1309.82 | 1.32 | 3.14 | 0.1 | 397.29 (3.81%) | 417.26 (3.99%) |
| Moving Average (method of averaging Exponential) | Period —11, Growth factor — 0.0003 | 405 | 1109.72 | 1.22 | 3.02 | 0.08 | 346.35 (3.39%) | 367.45 (3.6%) |
| Moving Average (method of averaging Smoothed) | Period —6, Growth factor — 0.0003 | 405 | 1109.72 | 1.22 | 3.02 | 0.08 | 346.35 (3.39%) | 367.45 (3.6%) |
| Moving Average (method of averaging Weighted) | Period —22, Growth factor — 0.0002 | 351 | 1505.35 | 1.34 | 3.65 | 0.11 | 383.71 (3.41%) | 412.88 (3.91%) |
| Adaptive Moving Average | Period —14, Growth factor — 0.0001 | 384 | 1024.19 | 1.19 | 1.63 | 0.07 | 600.06 (5.41%) | 627.36 (5.64%) |
| Double Exponential Moving Average | Period —28, Growth factor — 0.0003 | 366 | 1676.43 | 1.39 | 3.49 | 0.12 | 460.33 (4.39%) | 481.03 (4.58%) |
| Triple Exponential Moving Average | Period —44, Growth factor — 0.0002 | 482 | 1842.81 | 1.35 | 5.31 | 0.11 | 321.07 (3.14%) | 347.27 (3.39%) |
| Fractal Adaptive Moving Average | Period —16, Growth factor — 0.0007 | 174 | 766.52 | 1.37 | 2.69 | 0.12 | 252.4 (2.5%) | 285.08 (2.78%) |
| Variable Index Dynamic Average | Period EMA — 12, period CMO — 2, Growth factor — 0.0003 | 333 | 1237.31 | 1.26 | 2.86 | 0.09 | 385.44 (3.43%) | 432.81 (3.84%) |
| Nick Rypock Moving Average | Period —15, Growth factor — 0.0001 | 295 | 1669.62 | 1.42 | 4.14 | 0.14 | 376.22 (3.5%) | 403.52 (3.75%) |
The following conclusions can be made based on testing results:
- The biggest indicator of Total net profit and Recovery factor - Triple Exponential Moving Average, however its other indices are not the highest ones, as well rather good results are shown by Double Exponential Moving Average and Nick Rypock Moving Average.
- The worst indices of Profit factor, Recovery factor, Sharpe ratio, as well as the biggest Equity and Balance drawdown are shown by Adaptive Moving Average.
For a more vivid comparison of testing results, let us normalize the indices of Total net profit, Profit factor, Sharpe ratio, Recovery factor, Balance and Equity drawdowns maximal by the following formula:
![]()
where:
- nValue — normalized parameter value within the interval from 0 to 1,
- Value — current parameter value,
- MaxValue — maximal parameter value,
- MinValue — minimal parameter value.
Outcomes are represented in the table (the best results are in yellow, the worst one is in red color):
| Name of moving average | Total net profit | Profit factor | Recovery factor | Sharpe ratio | Balance drawdown maximal | Equity drawdown maximal | Sum of indicators exclusive of drawdowns | Sum of indicators inclusive of drawdowns |
|---|---|---|---|---|---|---|---|---|
| Moving Average (method of averaging Simple) | 0.50479 | 0.56522 | 0.41033 | 0.42857 | 0.41676 | 0.38618 | 1.9089 | 1.10597 |
| Moving Average (method of averaging Exponential) | 0.31887 | 0.13043 | 0.37772 | 0.14286 | 0.27024 | 0.24065 | 0.96988 | 0.459 |
| Moving Average (method of averaging Smoothed) | 0.31887 | 0.13043 | 0.37772 | 0.14286 | 0.27024 | 0.24065 | 0.96988 | 0.459 |
| Moving Average (method of averaging Weighted) | 0.68646 | 0.65217 | 0.54891 | 0.57143 | 0.3777 | 0.37338 | 2.45898 | 1.7079 |
| Adaptive Moving Average | 0.23941 | 0 | 0 | 0 | 1 | 1 | 0.23941 | -1.76059 |
| Double Exponential Moving Average | 0.84541 | 0.86957 | 0.50543 | 0.71429 | 0.59808 | 0.57248 | 2.9347 | 1.76413 |
| Triple Exponential Moving Average | 1 | 0.69565 | 1 | 0.57143 | 0.19572 | 0.18169 | 3.26708 | 2.88787 |
| Fractal Adaptive Moving Average | 0 | 0.78261 | 0.28804 | 0.71429 | 0 | 0 | 1.78494 | 1.78494 |
| Variable Index Dynamic Average | 0.43742 | 0.29631 | 0.33361 | 0.27656 | 0.38267 | 0.43161 | 1.34419 | 0.52992 |
| Nick Rypock Moving Average | 0.83909 | 1 | 0.68207 | 1 | 0.35615 | 0.34603 | 3.52115 | 2.81897 |
In the last column of the table, when summing up indicators, the values of Balance and Equity drawdowns maximal are taken with the negative sign (the less the drawdown, the best the strategy). Thus, the best results for the considered strategy are demonstrated by Triple Exponential Moving Average, Nick Rypock Moving Average и Double Exponential Moving Average (in the table shown in yellow). Testing results for TEMA, NRMA and DEMA are shown in fig. 5-10

Fig. 5. Balance (equity) chart for Triple Exponential Moving Average
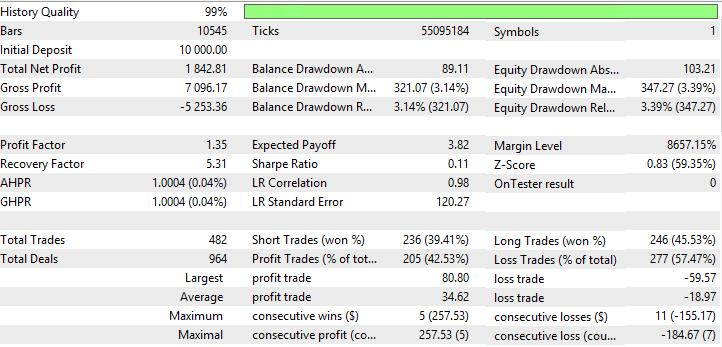
Fig. 6. Report for Triple Exponential Moving Average

Fig. 7. Balance (equity) chart for Nick Rypock Moving Average

Fig. 8. Report for Nick Rypock Moving Average

Fig. 9. Balance (equity) chart for Double Exponential Moving Average
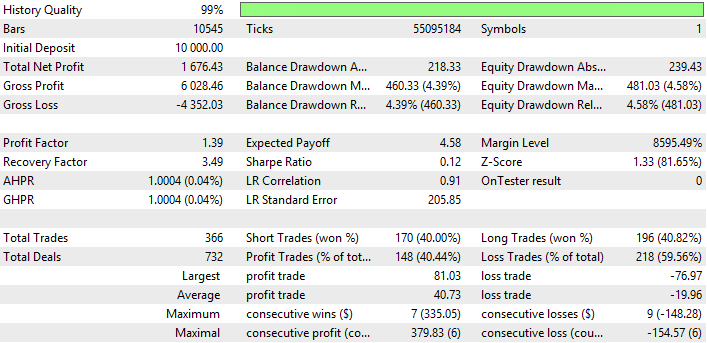
Fig. 10. Report for Double Exponential Moving Average
Fig. 5, 7, 9 demonstrate that balance (equity) chart for TEMA looks more stable than NRMA and DEMA; although it has slight drawdowns. At the balance (equity) chart of NRMA, we observe a spike in profit for the last 3 months of trading, at DEMA chart profit growth (with a slight drawdown) starts from December 2016.
Testing results on currency pair GBPUSD
Testing results on currency pair GBPUSD are provided in the table:
| Name of moving average | Parameters optimised and their values | Q-ty of trades | Total net profit | Profit factor | Recovery factor | Sharpe ratio | Balance drawdown maximal | Equity drawdown maximal |
|---|---|---|---|---|---|---|---|---|
| Moving Average (method of averaging Simple) | Period —38, Growth factor — 0.0005 | 52 | 1013.56 | 1.98 | 3.82 | 0.32 | 207.04 (2.7%) | 265.06 (2.65%) |
| Moving Average (method of averaging Exponential) | Period —41, Growth factor — 0.0002 | 219 | 787.12 | 1.14 | 1.23 | 0.07 | 576.96 (5.21%) | 639.44 (5.75%) |
| Moving Average (method of averaging Smoothed) | Period —42, Growth factor — 0.0003 | 48 | 817.42 | 1.71 | 3.85 | 0.26 | 151.32 (1.51%) | 212.24 (2.04%) |
| Moving Average (method of averaging Weighted) | Period —50, Growth factor — 0.0001 | 328 | 1086.08 | 1.17 | 1.26 | 0.07 | 818.34 (7.45%) | 861.04 (7.82%) |
| Adaptive Moving Average | Period —21, Growth factor — 0.001 | 100 | 1102.16 | 1.61 | 4.61 | 0.21 | 176.46 (1.71%) | 239.12 (2.28%) |
| Double Exponential Moving Average | Period —23, Growth factor — 0.0007 | 263 | 1070.88 | 1.21 | 1.96 | 0.08 | 466.24 (4.42%) | 547.58 (5.16%) |
| Triple Exponential Moving Average | Period —30, Growth factor — 0.0009 | 214 | 1443.90 | 1.39 | 4.11 | 0.14 | 322.76 (3.02%) | 351.14 (3.28%) |
| Fractal Adaptive Moving Average | Period —38, Growth factor — 0.0001 | 819 | 651.54 | 1.05 | 0.85 | 0.02 | 747.98 (7.12%) | 764.88 (7.28%) |
| Variable Index Dynamic Average | Period EMA — 35, period CMO — 7, Growth factor — 0.0004 | 73 | 1606.98 | 1.99 | 5.20 | 0.34 | 251.94 (2.52%) | 309 (3.08%) |
| Nick Rypock Moving Average | Fact — 45, Growth factor — 0.0005 | 53 | 978.30 | 1.80 | 3.86 | 0.29 | 200.64 (1.99%) | 253.58 (2.51%) |
Normalized results are represented in the table (the best results are in yellow, the worst one is in red color):
| Name of moving average | Total net profit | Profit factor | Recovery factor | Sharpe ratio | Balance drawdown maximal | Equity drawdown maximal | Sum of indicators exclusive of drawdowns | Sum of indicators inclusive of drawdowns |
|---|---|---|---|---|---|---|---|---|
| Moving Average (method of averaging Simple) | 0.3789 | 0.98929 | 0.68343 | 0.91799 | 0.08354 | 0.08141 | 2.96961 | 2.80467 |
| Moving Average (method of averaging Exponential) | 0.1419 | 0.09351 | 0.08718 | 0.13465 | 0.63812 | 0.65845 | 0.45724 | -0.8393 |
| Moving Average (method of averaging Smoothed) | 0.17416 | 0.70302 | 0.69032 | 0.74598 | 0 | 0 | 2.31347 | 2.31347 |
| Moving Average (method of averaging Weighted) | 0.45481 | 0.12036 | 0.09417 | 0.14629 | 1 | 1 | 0.81562 | -1.1844 |
| Adaptive Moving Average | 0.47164 | 0.58999 | 0.86402 | 0.57613 | 0.03769 | 0.04143 | 2.50177 | 2.42265 |
| Double Exponential Moving Average | 0.4389 | 0.17142 | 0.25383 | 0.1936 | 0.47213 | 0.51686 | 1.05774 | 0.06875 |
| Triple Exponential Moving Average | 0.82931 | 0.36161 | 0.74969 | 0.36845 | 0.25702 | 0.21409 | 2.30906 | 1.83795 |
| Fractal Adaptive Moving Average | 0 | 0 | 0 | 0 | 0.89452 | 0.85179 | 0 | -1.7463 |
| Variable Index Dynamic Average | 1 | 1 | 1 | 1 | 0.15085 | 0.14914 | 4 | 3.70001 |
| Nick Rypock Moving Average | 0.342 | 0.79826 | 0.69126 | 0.82047 | 0.07394 | 0.06372 | 2.65199 | 2.51433 |
As the tables suggest, Variable Index Dynamic Average has the best indicators, as well Nick Rypock Moving Average and Moving Average with Simple method of averaging turned out to be rather well. Testing results for VIDYA, NRMA and SMA are shown in fig. 11-16.

Fig. 11. Balance (equity) chart of Variable Index Dynamic Average

Fig. 12. Report for Variable Index Dynamic Average

Fig. 13. Balance (equity) chart for Nick Rypock Moving Average
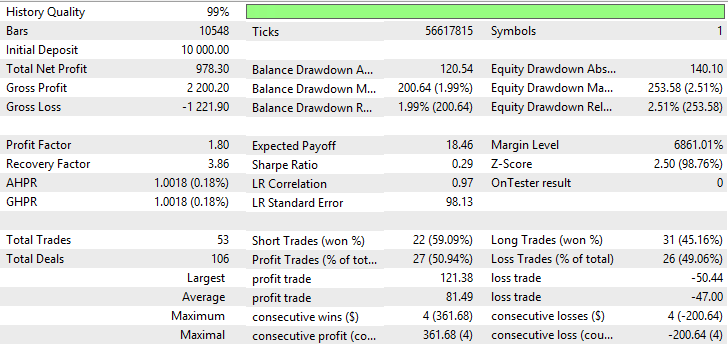
Fig. 14. Report for Variable Index Nick Rypock Moving Average

Fig. 15. Balance (equity) chart of Simple Moving Average
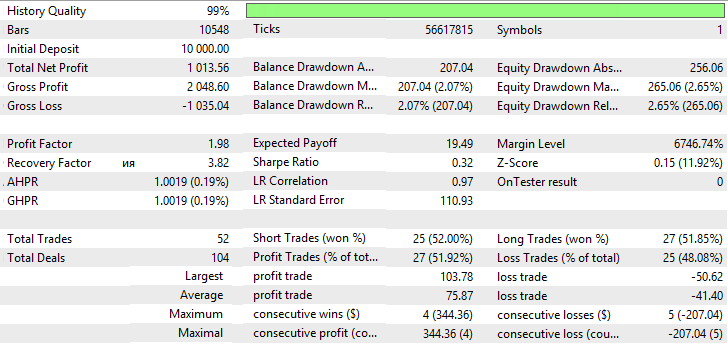
Fig. 16. Report for Simple Moving Average
Fig. 11-16 demonstrate that VIDYA, NRMA and SMA look somewhat the same, at trading commencement a slight drawdown is observed; further, charts grow, number of deals with VIDYA is greater than with NRMA and SMA. Percentage of profitable trades with VIDYA exceeds those with NRMA and SMA.
Testing results on currency pair USDJPY
Testing results on currency pair USDJPY are provided in the following table:
| Name of moving average | Parameters optimized and their values | Q-ty of trades | Total net profit | Profit factor | Recovery factor | Sharpe ratio | Balance drawdown maximal | Equity drawdown maximal |
|---|---|---|---|---|---|---|---|---|
| Moving Average (method of averaging Simple) | Period —34, Growth factor — 0.0004 | 451 | 1784.95 | 1.32 | 3.69 | 0.1 | 465.52 (4.17%) | 483.34 (4.32%) |
| Moving Average (method of averaging Exponential) | Period —42, Growth factor — 0.0007 | 465 | 1135.23 | 1.20 | 2.21 | 0.07 | 461.52 (4.08%) | 514.61 (4.53%) |
| Moving Average (method of averaging Smoothed) | Period —33, Growth factor — 0.0008 | 372 | 1702.94 | 1.36 | 5.15 | 0.12 | 296.57 (2.58%) | 330.6 (2.87%) |
| Moving Average (method of averaging Weighted) | Period —50, Growth factor — 0.0005 | 477 | 1892.24 | 1.33 | 4.66 | 0.10 | 384.06 (3.68%) | 406.1 (3.88%) |
| Adaptive Moving Average | Period —46, Growth factor — 0.0006 | 403 | 1460.51 | 1.26 | 2.56 | 0.09 | 527.75 (4.77%) | 569.67 (5.13%) |
| Double Exponential Moving Average | Period —18, Growth factor — 0.001 | 1062 | 1459.18 | 1.15 | 3.55 | 0.05 | 366.24 (3.30%) | 410.56 (3.69%) |
| Triple Exponential Moving Average | Period —50, Growth factor — 0.0003 | 657 | 1115.86 | 1.15 | 1.87 | 0.05 | 537.18 (4.68%) | 597.71 (5.18%) |
| Fractal Adaptive Moving Average | Period —24, Growth factor — 0.0008 | 1030 | 615.92 | 1.06 | 0.8 | 0.02 | 734.03 (6.58%) | 766.01 (6.85%) |
| Variable Index Dynamic Average | Period EMA — 18, period CMO — 42, Growth factor — 0.001 | 238 | 2338.68 | 1.64 | 5.14 | 0.21 | 417.66 (3.62%) | 454.69 (3.93%) |
| Nick Rypock Moving Average | Fact —28, Growth factor — 0.0002 | 435 | 1465.32 | 1.27 | 3.00 | 0.09 | 456.65 (4.02%) | 488.7 (4.29%) |
Normalized results are represented in the table (the best results are in yellow, the worst one is in red color):
| Name of moving average | Total net profit | Profit factor | Recovery factor | Sharpe ratio | Balance drawdown maximal | Equity drawdown maximal | Sum of indicators exclusive of drawdowns | Sum of indicators inclusive of drawdowns |
|---|---|---|---|---|---|---|---|---|
| Moving Average (method of averaging Simple) | 0.67858 | 0.45316 | 0.66457 | 0.4324 | 0.38621 | 0.3508 | 2.22871 | 1.49171 |
| Moving Average (method of averaging Exponential) | 0.30144 | 0.25001 | 0.32251 | 0.25216 | 0.37706 | 0.42261 | 1.12612 | 0.32645 |
| Moving Average (method of averaging Smoothed) | 0.63098 | 0.51885 | 1 | 0.50010 | 0 | 0 | 2.64993 | 2.64993 |
| Moving Average (method of averaging Weighted) | 0.74086 | 0.46535 | 0.88693 | 0.42881 | 0.2 | 0.1734 | 2.52195 | 2.14855 |
| Adaptive Moving Average | 0.49025 | 0.34559 | 0.40481 | 0.36951 | 0.52846 | 0.54907 | 1.61017 | 0.53264 |
| Double Exponential Moving Average | 0.48948 | 0.15054 | 0.63263 | 0.14711 | 0.15926 | 0.18364 | 1.41976 | 1.07686 |
| Triple Exponential Moving Average | 0.2902 | 0.15141 | 0.2445 | 0.15928 | 0.55002 | 0.61347 | 0.84538 | -0.3181 |
| Fractal Adaptive Moving Average | 0 | 0 | 0 | 0 | 1 | 1 | 0 | -2 |
| Variable Index Dynamic Average | 1 | 1 | 0.99825 | 1 | 0.2768 | 0.285 | 3.99825 | 3.43645 |
| Nick Rypock Moving Average | 0.49305 | 0.36549 | 0.50479 | 0.37182 | 0.36593 | 0.36311 | 1.73515 | 1.00611 |
As the tables suggest, Variable Index Dynamic Average and Moving Average have the best indicators with Smoothed and Linear Weighted methods of averaging. Indicators of Total net profit, Profit factor, Sharpe ratio with VIDYA exceed those with SMMA and LWMA, but SMMA and LWMA have the least balance and equity drawdown. Testing results for VIDYA, SMMA and LWMA are shown in fig. 17-22.

Fig. 17. Balance (equity) chart of Variable Index Dynamic Average
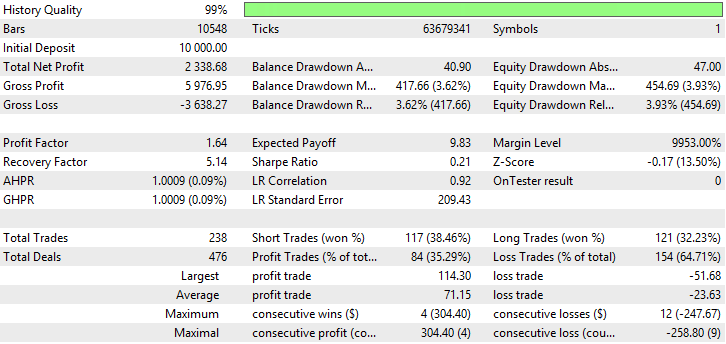
Fig. 18. Report for Variable Index Dynamic Average

Fig. 19. Balance (equity) chart of Linear Weighted Moving Average
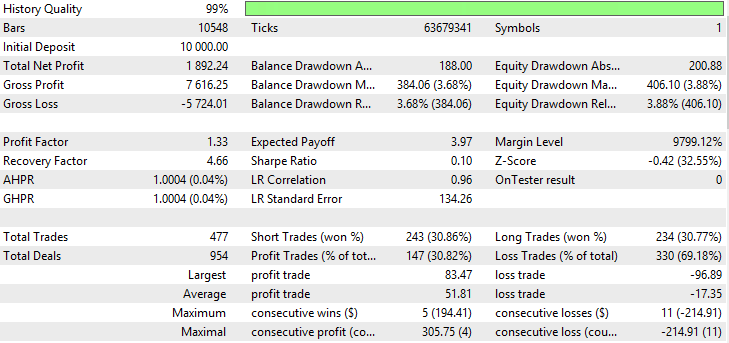
Fig. 20. Report for Linear Weighted Moving Average

Fig. 21. Balance (equity) chart of Smoothed Moving Average
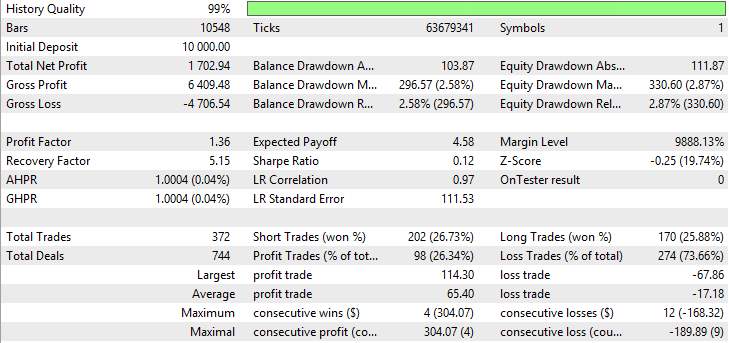
Fig. 22. Report for Smoothed Moving Average
Fig. 17-22 show that notwithstanding low percentage of profitable trades, the indicators demonstrate high total net profit. This is connected with the fact that currency pair USDJPY has high volatility.
Testing results on currency pair USDCAD
Testing results on currency pair USDCAD are provided in the below table:
| Name of moving average | Parameters optimized and their values | Q-ty of trades | Total net profit | Profit factor | Recovery factor | Sharpe ratio | Balance drawdown maximal | Equity drawdown maximal |
|---|---|---|---|---|---|---|---|---|
| Moving Average (method of averaging Simple) | Period —39, Growth factor — 0,0004 | 59 | 1101.44 | 2.30 | 7.11 | 0.40 | 133.44 (1.25%) | 154.92 (1.45%) |
| Moving Average (method of averaging Exponential) | Period —31, Growth factor — 0.0005 | 76 | 951.88 | 1.74 | 3.01 | 0.27 | 278.08 (2.56%) | 316.57 (2.91%) |
| Moving Average (method of averaging Smoothed) | Period —50, Growth factor — 0.0001 | 121 | 1262.26 | 1.57 | 3.07 | 0.22 | 343.76 (3.19%) | 411.32 (3.81%) |
| Moving Average (method of averaging Weighted) | Period —46, Growth factor — 0.0005 | 46 | 903.64 | 2.34 | 5.31 | 0.42 | 128.97 (1.22%) | 170.05 (1.61%) |
| Adaptive Moving Average | Period —38, Growth factor — 0.0009 | 41 | 990.44 | 3.18 | 8.62 | 0.55 | 77.57 (0.73%) | 114.96 (1.09%) |
| Double Exponential Moving Average | Period —44, Growth factor — 0.0007 | 73 | 941.93 | 2.07 | 5.33 | 0.32 | 137.28 (1.28%) | 176.6 (1.64%) |
| Triple Exponential Moving Average | Period —49, Growth factor — 0.0009 | 76 | 559.18 | 1.62 | 3.28 | 0.20 | 122.21 (1.2%) | 170.57 (1.66%) |
| Fractal Adaptive Moving Average | Period —15, Growth factor — 0.0009 | 185 | 504.26 | 1.27 | 2.44 | 0.09 | 197.12 (1.95%) | 206.37 (2.04%) |
| Variable Index Dynamic Average | Period EMA — 34, period CMO — 9, Growth factor — 0.0002 | 111 | 1563.99 | 1.86 | 6.17 | 0.30 | 185.64 (1.70%) | 253.36 (2.32%) |
| Nick Rypock Moving Average | Fact — 41, Growth factor —0.0004 | 81 | 594.91 | 1.39 | 1.74 | 0.16 | 309.02 (2.88%) | 342.16 (3.18%) |
Normalized results are represented in the table (the best results are in yellow, the worst one is in red colour):
| Name of moving average | Total net profit | Profit factor | Recovery factor | Sharpe ratio | Balance drawdown maximal | Equity drawdown maximal | Sum of indicators exclusive of drawdowns | Sum of indicators inclusive of drawdowns |
|---|---|---|---|---|---|---|---|---|
| Moving Average (method of averaging Simple) | 0.56352 | 0.53776 | 0.78104 | 0.67198 | 0.20989 | 0.13484 | 2.5543 | 2.20957 |
| Moving Average (method of averaging Exponential) | 0.42239 | 0.24419 | 0.18441 | 0.37529 | 0.75326 | 0.68029 | 1.22628 | -0.2073 |
| Moving Average (method of averaging Smoothed) | 0.71528 | 0.15751 | 0.19342 | 0.26924 | 1 | 1 | 1.33545 | -0.6646 |
| Moving Average (method of averaging Weighted) | 0.37687 | 0.55859 | 0.5199 | 0.69827 | 0.1931 | 0.18589 | 2.15363 | 1.77465 |
| Adaptive Moving Average | 0.45878 | 1 | 1 | 1 | 0 | 0 | 3.45878 | 3.45878 |
| Double Exponential Moving Average | 0.413 | 0.42112 | 0.52277 | 0.48957 | 0.22431 | 0.20799 | 1.84645 | 1.41415 |
| Triple Exponential Moving Average | 0.05182 | 0.18256 | 0.22388 | 0.23681 | 0.1677 | 0.18764 | 0.69508 | 0.33974 |
| Fractal Adaptive Moving Average | 0 | 0 | 0.10249 | 0 | 0.44912 | 0.30844 | 0.10249 | -0.6551 |
| Variable Index Dynamic Average | 1 | 0.30606 | 0.64482 | 0.43945 | 0.40599 | 0.467 | 2.39033 | 1.51734 |
| Nick Rypock Moving Average | 0.08554 | 0.06124 | 0 | 0.14059 | 0.86949 | 0.76664 | 0.28737 | -1.3488 |
As the tables suggest, Adaptive Moving Average, Moving Average with Simple method of averaging and Variable Index Dynamic Average have the best indicators. Adaptive Moving Average demonstrates the best indicators of Profit factor, Recovery factor and Sharpe ratio, as well it has the least balance and equity drawdowns. Variable Index Dynamic Average has the biggest total net profit, however, other indicators are not the highest. Testing results for AMA, SMA and VIDYA are shown in fig. 23-28.

Fig. 23. Balance (equity) chart of Adaptive Moving Average
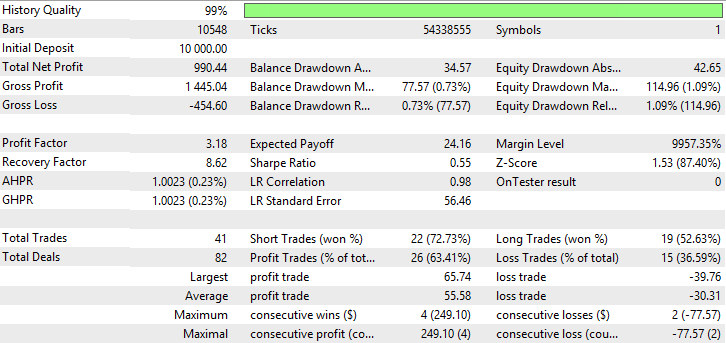
Fig. 24. Report for Adaptive Moving Average

Fig. 25. Balance (equity) chart of Simple Moving Average

Fig. 26. Report for Simple Moving Average

Fig. 27. Balance (equity) chart of Variable Index Dynamic Average
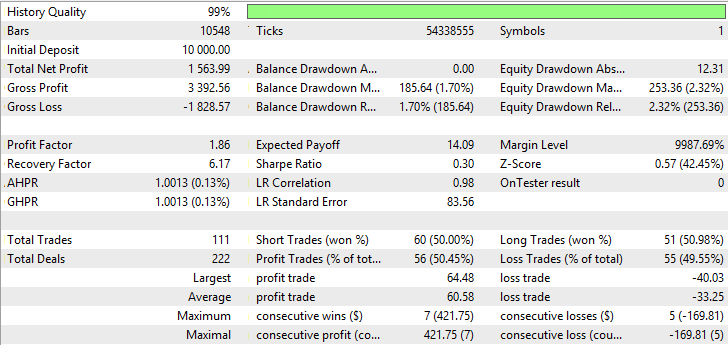
Fig. 28. Report for Variable Index Dynamic Average
Fig. 23-28 demonstrates AMA has the lowest quantity of trades and the biggest percentage of profitable trades. SMA and VIDYA have the highest profit for the account of a bigger quantity of trades, whereas the number of profitable trades exceeds those loss. Big drawdowns in charts AMA, SMA and VIDYA are not observed.
Testing results on currency pair AUDUSD
Testing results on currency pair AUDUSD are provided in the below table:
| Name of moving average | Parameters optimized and their values | Q-ty of trades | Total net profit | Profit factor | Recovery factor | Sharpe ratio | Balance drawdown maximal | Equity drawdown maximal |
|---|---|---|---|---|---|---|---|---|
| Moving Average (method of averaging Simple) | Period —7, Growth factor — 0.0009 | 78 | 262.48 | 1.36 | 1.23 | 0.11 | 175.85 (1.74%) | 214.18 (2.11%) |
| Moving Average (method of averaging Exponential) | Period —40, Growth factor — 0.0004 | 24 | 652.88 | 2.62 | 2.82 | 0.47 | 206.76 (1.93%) | 231.76 (2.16%) |
| Moving Average (method of averaging Smoothed) | Period —21, Growth factor — 0.0004 | 24 | 651.18 | 2.61 | 2.81 | 0.47 | 206.76 (1.93%) | 231.76 (2.16%) |
| Moving Average (method of averaging Weighted) | Period —32, Growth factor — 0.0005 | 24 | 383.64 | 1.97 | 2.25 | 0.30 | 116.38 (1.11%) | 170.24 (1.62%) |
| Adaptive Moving Average | Period —21, Growth factor — 0.0007 | 58 | 252.39 | 1.30 | 0.54 | 0.11 | 392.15 (3.80%) | 464.47 (4.48%) |
| Double Exponential Moving Average | Period —40, Growth factor — 0.0006 | 39 | 296.15 | 1.70 | 1.53 | 0.20 | 156.62 (1.51%) | 193.02 (1.86%) |
| Triple Exponential Moving Average | Period —21, Growth factor — 0.001 | 69 | 273.12 | 1.35 | 1.05 | 0.11 | 228.5 (2.20%) | 259.71 (2.50%) |
| Fractal Adaptive Moving Average | Period —38, Growth factor — 0.0007 | 83 | 109.01 | 1.11 | 0.55 | 0.04 | 142.85 (1.42%) | 196.47 (1.94%) |
| Variable Index Dynamic Average | Period EMA — 26, period CMO — 5, Growth factor — 0.0006 | 23 | 697.59 | 2.99 | 2.96 | 0.53 | 151.35 (1.41%) | 235.38 (2.19%) |
| Nick Rypock Moving Average | Period —22, Growth factor — 0.0006 | 34 | 509.27 | 1.90 | 2.55 | 0.28 | 94.58 (0.9%) | 200 (1.89%) |
Normalized results are represented in the table (the best results are in yellow, the worst one is in red colour):
| Name of moving average | Total net profit | Profit factor | Recovery factor | Sharpe ratio | Balance drawdown maximal | Equity drawdown maximal | Sum of indicators exclusive of drawdowns | Sum of indicators inclusive of drawdowns |
|---|---|---|---|---|---|---|---|---|
| Moving Average (method of averaging Simple) | 0.26075 | 0.12921 | 0.28183 | 0.13463 | 0.27311 | 0.14934 | 0.80642 | 0.38397 |
| Moving Average (method of averaging Exponential) | 0.92404 | 0.80629 | 0.93942 | 0.86552 | 0.37699 | 0.20909 | 3.53527 | 2.94919 |
| Moving Average (method of averaging Smoothed) | 0.92115 | 0.8006 | 0.93639 | 0.86226 | 0.37699 | 0.20909 | 3.5204 | 2.93433 |
| Moving Average (method of averaging Weighted) | 0.4666 | 0.45691 | 0.70658 | 0.52861 | 0.07326 | 0 | 2.1587 | 2.08544 |
| Adaptive Moving Average | 0.2436 | 0.10105 | 0 | 0.13347 | 1 | 1 | 0.47812 | -1.5219 |
| Double Exponential Moving Average | 0.31795 | 0.31405 | 0.40942 | 0.31848 | 0.20849 | 0.07742 | 1.3599 | 1.07399 |
| Triple Exponential Moving Average | 0.27882 | 0.12776 | 0.20999 | 0.14014 | 0.45005 | 0.30408 | 0.75672 | 0.00259 |
| Fractal Adaptive Moving Average | 0 | 0 | 0.00473 | 0 | 0.16221 | 0.08915 | 0.00473 | -0.2466 |
| Variable Index Dynamic Average | 1 | 1 | 1 | 1 | 0.19078 | 0.22139 | 4 | 3.58783 |
| Nick Rypock Moving Average | 0.68004 | 0.42124 | 0.82757 | 0.48773 | 0 | 0.10115 | 2.41659 | 2.31545 |
As the tables suggest, Variable Index Dynamic Average and Moving Average have the best indicators with Exponential and Smoothed methods of averaging. VIDYA demonstrates the best indicators of Total net profit, Profit factor, Recovery factor and Sharpe ratio. EMA and SMMA have almost equal indicators and equal quantity of trades. Testing results for VIDYA, EMA and SMMA are shown in fig. 29-34.

Fig. 29. Balance (equity) chart of Variable Index Dynamic Average
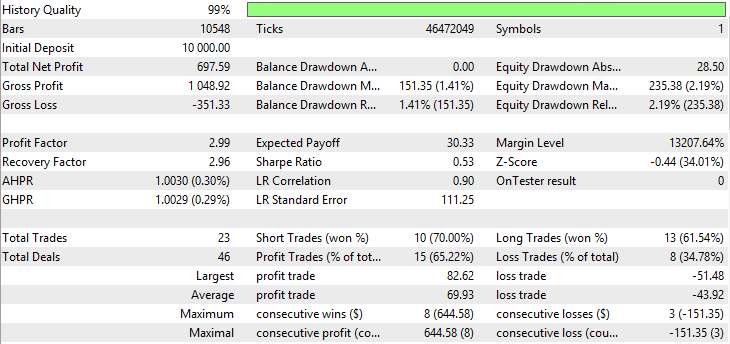
Fig. 30. Report for Variable Index Dynamic Average

Fig. 31. Balance (equity) chart of Exponential Moving Average
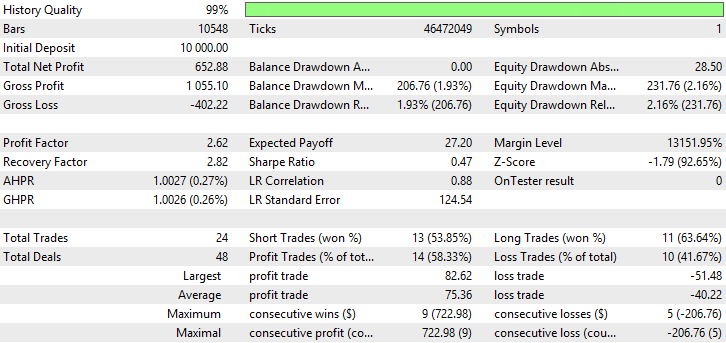
Fig. 32. Report for Exponential Moving Average

Fig. 33. Balance (equity) chart of Smoothed Moving Average
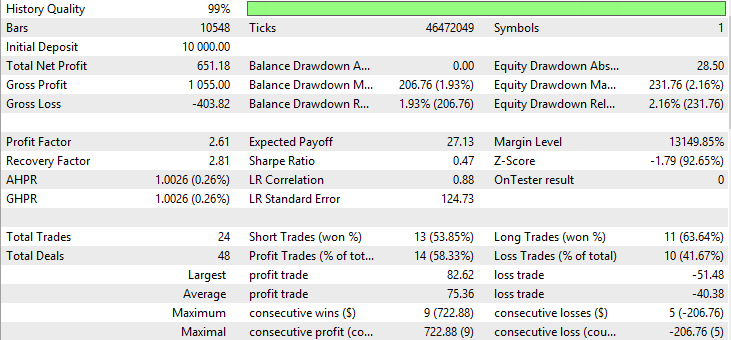
Fig. 34. Report for Smoothed Moving Average
Fig. 29-34 show that balance (equity) charts for VIDYA, EMA and SMMA are approximately equal, VIDYA has a bigger number of profitable trades than EMA and SMMA. Currency pair AUDUSD has low volatility which explains the obtained results.
The following conclusions may be made on the basis of testing results on currency pairs EURUSD, GBPUSD, USDJPY, USDCAD, AUDUSD:
- the best results on currency pairs with high (GBPUSD, USDJPY) and low volatility (AUDUSD) were demonstrated by Variable Index Dynamic Average
- on USDCAD, the best indices were demonstrated by Adaptive Moving Average, however on currency pair EURUSD it demonstrates the worst results
- on EURUSD, the best indices were demonstrated by Triple Exponential Moving Average
- the worst results on currency pairs GBPUSD, USDJPY, USDCAD, AUDUSD were demonstrated by Fractal Adaptive Moving Average
- fair results were demonstrated by standard indicator Moving Average with various averaging periods.
Conclusion
We have considered different moving averages (MA (with methods Simple, Exponential, Smoothed, Linear Weighted), DEMA, TEMA, FRAMA, AMA, VIDYA, NRMA), for each MA a procedure of its calculation is described. Comparison and optimization of moving averages in trading under equal conditions of entering and exiting the market have been performed.
The following conclusions can be made based on obtained results:
- by optimizing parameters of any of the considered moving averages, a profitable strategy may be received;
- the majority of moving averages are variations of EMA indicator;
- the main advantage of EMA-based moving averages is a decrease in false signals in flat and a faster response to trend change;
- the best results were demonstrated by Variable Index Dynamic Average, it can be used both on currency pairs with high and low volatility, as well as on currency pairs with average volatility.
Translated from Russian by MetaQuotes Ltd.
Original article: https://www.mql5.com/ru/articles/3791
 R-squared as an estimation of quality of the strategy balance curve
 Using the Kalman Filter for price direction prediction
 Mini Market Emulator or Manual Strategy Tester
- Free trading apps
- Over 8,000 signals for copying
- Economic news for exploring financial markets
You agree to website policy and terms of use