Construction of Fractal Lines
Introduction
Fractals are used by practically all traders. However, if you ask them what a fractal is, they will at best answer
that it is an indicator in the Bill Williams' system. The more advanced traders will say that it is a sequence
of 5 bars where, if the middle bar's High is higher than those of other bars in the sequence, it is an Up fractal
and, if the middle bar's Low is lower than those of other bars, it is a Down fractal. As the phrase goes, "This
is all I can tell about the war”.
A brief description of fractals, particularly of their nature and use, is given in the Bill Williams' book named New Trading Dimensions: How to Profit from Chaos in Stocks, Bonds, and Commodities. Something can also be found in the Chekulaev's article named Fractals (in Russian). Mathematical formulas are well described in Shiryaev's book named Fundamentals of Stochastic Mathematics (in Russian).
Use of Fractals
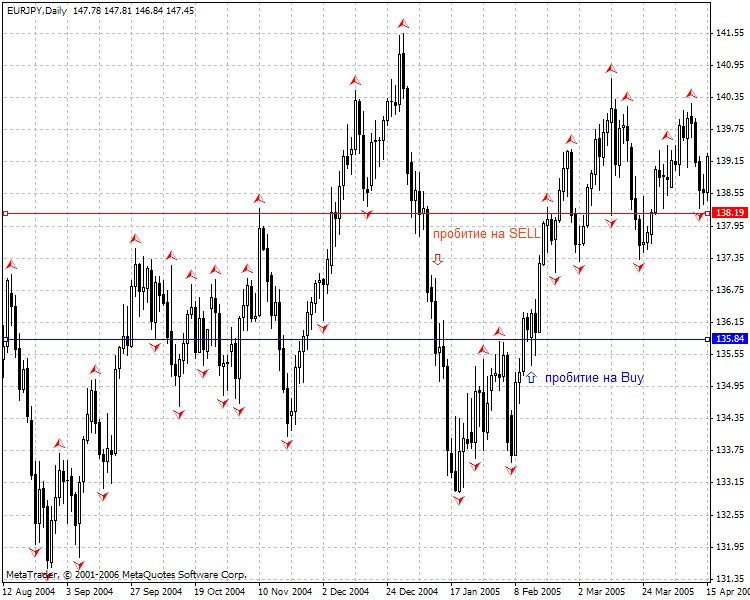
There are two kinds of fractal penetration to be marked – a simple one is where the price exceeds the Up fractal
level (falls under the Down fractal level). In this case, it would be better to wait for the close price and
open a position at opening the next bar.

The respective fractals Buy and Sell are marked with arrows in the figure above where we consider the simple fractal penetration. A complex penetration uses 2 fractals – the last and the last but one. They are joint by a straight line that is expected to be penetrated by the close price.
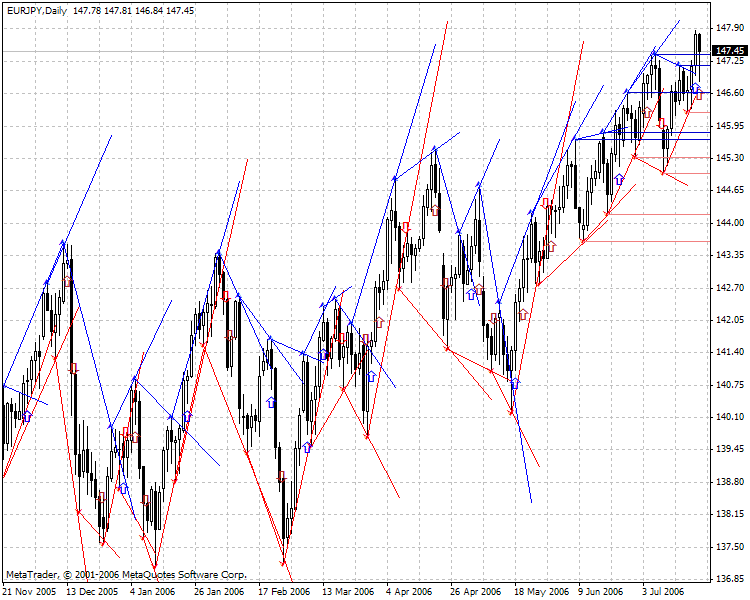
Entering points when the fractal line is penetrated are marked by blue and red arrows. The development environment MQL4 will help us to know the fractal ideology better.
Let us define a problem to test fractals:
- draw fractals buy/sell;
- draw horizontal penetrating levels;
- draw fractal lines;
- mark the expected entering points with arrows.
Fractals Buy/Sell
This is the most elementary part. We should also consider indicator iFractal available in MQL4 (in Omega, I had to write this indicator myself, and it was rather difficult due to Omega's properties). The examples of how to write this indicator can be found in Code Base.
Horizontal Levels of Penetration
Let us use standard horizontal lines. We will specify the the price of a fractal as a price coordinate, the date of forming the fractal and the current time will be given as time coordinates.
ObjectCreate("SimpleUp"+Up,OBJ_TREND,0,bufUpDate[Up],
             bufUpPrice[Up],Time[i-1],bufUpPrice[Up]);
ObjectSet("SimpleUp"+Up,OBJPROP_COLOR,Aqua);
ObjectSet("SimpleUp"+Up,OBJPROP_RAY,True);
Fractal Lines
The simplest way seems to be drawing of trend lines through 2 points. We make a ray of the line and wait for penetration. However, indeed, it does not seem to be possible to compare the close price and value of the price on the fractal line since function ObjectGet can return only values of points that have formed the fractal line. So what are we to do?
We should remember analytic geometry. We have 2 points, so we have a straight-line equation. And, since we know the time coordinate, we can easily obtain the price value from the straight-line equation. The canonical straight-line equation looks like this:
![]()
We will substitute price and time instead of х and у. The realization thereof is given in function LevelCalculate that calculates the penetration level and, along with this, defines new coordinates of the fractal line to be set using function ObjectSet.
ObjectCreate("LineUp"+Up,OBJ_TREND,0,bufUpDate[Up],
             bufUpPrice[Up],bufUpDate[Up-1],bufUpPrice[Up-1]);
ObjectSet("LineUp"+Up,OBJPROP_COLOR,Blue);
ObjectSet("LineUp"+Up,OBJPROP_RAY,False);
Placing Arrows
We build all necessary lines in the loop and then comapre them to the current prices. If it penetrates a simple
line, we put a yellow arrow. If it penetrates a fractal line, arrow for Buy will be blue, for Sell – red.
All this is realized as indicator FractalLines.mq4.
//+------------------------------------------------------------------+
//|                                                 FractalLines.mq4 |
//|                      Copyright © 2006, MetaQuotes Software Corp. |
//|                                        https://www.metaquotes.net/ |
//+------------------------------------------------------------------+
#property copyright "Copyright © 2006, MetaQuotes Software Corp."
#property link      "https://www.metaquotes.net/"

#property indicator_chart_window
#property indicator_buffers 2
#property indicator_color1 Blue
#property indicator_color2 Red
//---- input parameters
extern int       lines=5;  //The amount of visible fractal lines
extern int       MaxFractals=10000; // :)
extern bool       ShowHorisontalLines=true;
extern bool       ShowFractalLines=true;
//---- buffers
double ExtMapBuffer1[];
double ExtMapBuffer2[];
//--- my variables
double bufUpPrice[10000];  //price array of Up fractals
double bufUpDate[10000];   //date array of Up fractals
double bufDownPrice[10000];   //price array of Down fractals
double bufDownDate[10000]; //date array of Down fractals
int Up = 0; //counter of Up fractals
int Down = 0;  //counter of Down fractals

//The function calculates the price value of penetration of the fractal line by the simplest
//equations of analytic geometry
double LevelCalculate(double Price1, double Time1, double Price2,
                     double Time2, double NewTime)
{
   double level;
   if (Time2!=Time1)// Just in case, to avoid zero divide.
   {
      level=(NewTime-Time1)*(Price2-Price1)/(Time2-Time1)+Price1;
   }
   else
   {
      return(Price2);
   }
   return(level);
}

//+------------------------------------------------------------------+
//| Custom indicator initialization function                         |
//+------------------------------------------------------------------+
int init()
  {
//---- indicators
   SetIndexStyle(0,DRAW_ARROW);
   SetIndexArrow(0,217);
   SetIndexBuffer(0,ExtMapBuffer1);
   SetIndexEmptyValue(0,0.0);
   SetIndexStyle(1,DRAW_ARROW);
   SetIndexArrow(1,218);
   SetIndexBuffer(1,ExtMapBuffer2);
   SetIndexEmptyValue(1,0.0);
//----
   return(0);
  }
//+------------------------------------------------------------------+
//| Custom indicator deinitialization function                       |
//+------------------------------------------------------------------+
int deinit()
  {
//----

//----
   return(0);
  }
//+------------------------------------------------------------------+
//| Custom indicator iteration function                              |
//+------------------------------------------------------------------+
int start()
  {
   int    counted_bars=IndicatorCounted();
//---- the last calculated bar will be recalculated
   if(counted_bars > 0)
       counted_bars--;
   int limit = Bars - counted_bars;
// We will rather place arrows at the moment of penetration of fractal lines,
// estimate efficiency
 // The idea was borrowed from Rosh, hopefully he will not be offended by this :)
  string arrowName; // here, we will give the arrow a unique name

  //The number of the penetrated fractal
  //Penetration of the fractal line
  int FractalUp = 0;
  int FractalDown = 0;
  //Simple penetration of a fractal
  int SimpleFractalUp = 0;
  int SimpleFractalDown = 0;

  double BuyFractalLevel = 0;  //penetration level of the Up fractal line
  double SellFractalLevel = 0; //penetration level of the Down fractal line
  double buf = 0; // buffer value of fractal being available; if it is 0, there is no fractal at all

//---- the main loop
   for(int i = limit; i>0; i--)
   {

       //Draw simple fractal levels

       //Define the current fractal levels

         BuyFractalLevel=LevelCalculate(bufUpPrice[Up],bufUpDate[Up],
                   bufUpPrice[Up-1],bufUpDate[Up-1],Time[i]);
         //Move the second coordinate of the Up fractal line
         ObjectSet("LineUp"+Up,OBJPROP_TIME1,Time[i]);
         ObjectSet("LineUp"+Up,OBJPROP_PRICE1,BuyFractalLevel);
         SellFractalLevel=LevelCalculate(bufDownPrice[Down],
                          bufDownDate[Down],bufDownPrice[Down-1],
                          bufDownDate[Down-1],Time[i]);
         //Move the second coordinate of the Down fractal line
         ObjectSet("LineDown"+Down,OBJPROP_TIME1,Time[i]);
         ObjectSet("LineDown"+Down,OBJPROP_PRICE1,SellFractalLevel);

      //Search for a simple penetration
         if (Close[i]>ObjectGet("SimpleUp"+Up,OBJPROP_PRICE1)&&
                          (Up>SimpleFractalUp))
         {
            arrowName="SimleUpArrow"+Up;
            ObjectCreate(arrowName,OBJ_ARROW,0,Time[i-1],
                         Low[i-1]-Point*10);
            ObjectSet(arrowName,OBJPROP_ARROWCODE,241);
            ObjectSet(arrowName,OBJPROP_COLOR,Yellow);
            SimpleFractalUp=Up;
         }

         if (Close[i]<ObjectGet("SimpleDown"+Down,OBJPROP_PRICE1)&&
                          (Down>SimpleFractalDown))
         {
            arrowName="SimleUpArrow"+Down;
            ObjectCreate(arrowName,OBJ_ARROW,0,Time[i-1],
                         High[i-1]+Point*10);
            ObjectSet(arrowName,OBJPROP_ARROWCODE,242);
            ObjectSet(arrowName,OBJPROP_COLOR,Yellow);
            SimpleFractalDown=Down;
         }

      //Search for a complex penetration
        if ((Close[i]>BuyFractalLevel)&&(Up>FractalUp))
         {
            //Put an up-arrow
            arrowName="UpArrow"+Up;
            ObjectCreate(arrowName,OBJ_ARROW,0,Time[i-1],
                         Low[i-1]-Point*10);
            ObjectSet(arrowName,OBJPROP_ARROWCODE,241);
            ObjectSet(arrowName,OBJPROP_COLOR,Blue);
            FractalUp=Up;
         }

        if ((Close[i]<SellFractalLevel)&&(Down>FractalDown))
         {
            //Put a down-arrow
            arrowName="DownArrow"+Down;
            ObjectCreate(arrowName,OBJ_ARROW,0,Time[i-1],
                         High[i-1]+Point*10);
            ObjectSet(arrowName,OBJPROP_ARROWCODE,242);
            ObjectSet(arrowName,OBJPROP_COLOR,Red);
            FractalDown=Down;
         }
        //Draw the Up fractal itself
        ExtMapBuffer1[i] = iFractals(NULL, 0, MODE_UPPER, i);

        //If it is available, place it in the array of fractals
        buf = iFractals(NULL, 0, MODE_UPPER, i);
        if (buf!=0)
        {
            Up++;
            bufUpPrice[Up]=iFractals(NULL, 0, MODE_UPPER, i);
            bufUpDate[Up]=Time[i];
            //The current fractal penetration level - fractal itself
            BuyFractalLevel=bufUpPrice[Up];

            if (Up>1)

            {
               //Simple fractal
               ObjectCreate("SimpleUp"+Up,OBJ_TREND,0,bufUpDate[Up],
                   bufUpPrice[Up],Time[i-1],bufUpPrice[Up]);
      ObjectSet("SimpleUp"+Up,OBJPROP_COLOR,Aqua);
      ObjectSet("SimpleUp"+Up,OBJPROP_RAY,True);
               //Draw fractal lines on 2 coordinates
               ObjectCreate("LineUp"+Up,OBJ_TREND,0,bufUpDate[Up],
                  bufUpPrice[Up],bufUpDate[Up-1],bufUpPrice[Up-1]);
      ObjectSet("LineUp"+Up,OBJPROP_COLOR,Blue);
      ObjectSet("LineUp"+Up,OBJPROP_RAY,False);
               //Remove the outdated lines
               if (Up>lines+1)
               {
                  ObjectDelete("LineUp"+(Up-lines));
                  ObjectDelete("SimpleUp"+(Up-lines));
               }
            }
        }
         //A similar block, but for Down fractals
        ExtMapBuffer2[i] = iFractals(NULL, 0, MODE_LOWER, i);
        buf = iFractals(NULL, 0, MODE_LOWER, i);
        if (buf!=0)
        {
            Down++;
            bufDownPrice[Down]=iFractals(NULL, 0, MODE_LOWER, i);
            bufDownDate[Down]=Time[i];
            SellFractalLevel=bufDownPrice[Down];

            if (Down>1)

            {
               ObjectCreate("SimpleDown"+Down,OBJ_TREND,0,bufDownDate[Down],
                   bufDownPrice[Down],Time[i-1],bufDownPrice[Down]);
               ObjectSet("SimpleDown"+Down,OBJPROP_COLOR,LightCoral);
               ObjectSet("SimpleDown"+Down,OBJPROP_RAY,True);

               ObjectCreate("LineDown"+Down,OBJ_TREND,0,
                            bufDownDate[Down],bufDownPrice[Down],
                            bufDownDate[Down-1],bufDownPrice[Down-1]);
               ObjectSet("LineDown"+Down,OBJPROP_COLOR,Red);
               ObjectSet("LineDown"+Down,OBJPROP_RAY,False);
               if (Down>lines+1)
               {
                  ObjectDelete("LineDown"+(Down-lines));
                  ObjectDelete("SimpleDown"+(Down-lines));
               }
            }

        }
        if (!ShowHorisontalLines)
        {
            ObjectDelete("SimpleDown"+Down);
            ObjectDelete("SimpleUp"+Up);
        }
        if (!ShowFractalLines)
        {
            ObjectDelete("LineDown"+Down);
            ObjectDelete("LineUp"+Up);
        }
     }
//----
   return(0);
  }
//+-----------------------------------------------------------------
Old lines must be removed, otherwise the chart will look like a palette. There is
a couple of additional settings provided in the indicator, such as visibility of
lines or their amount. The result of the indicator's activities is given below.

This touches the spot for those who love fractals!
Translated from Russian by MetaQuotes Ltd.
Original article: https://www.mql5.com/ru/articles/1429
 What is Martingale and Is It Reasonable to Use It?
 MQL4 Language for Newbies. Technical Indicators and Built-In Functions
 Mathematics in Trading: How to Estimate Trade Results
 Creation of an Automated Trading System
- Free trading apps
- Over 8,000 signals for copying
- Economic news for exploring financial markets
You agree to website policy and terms of use
Bravo !
You are the best.
I like the russian people, because they are excellent fighters,excellent thinkers ,excellent writers ,excellent programmers,excellent chess-players,excellent mathematicians .
The russians don't deserve to live in poverty.
Bravo Sashev Sergei
----I'm not russian
How do I run this program thru a debugger? I mean to understand it better. I have understanding of making fractals, but this is a more complex program.
The math behind is easy. The coding of the OBJECTSET without OBJECTCREATE etc in this is really intriguing.
Or can someone please edit the program with comments so as to explain it. It will be very helpful in that way.
Best regards,
Randy.
Great thinker.........just made love
This is an interesting indicator but can alert be added to it? And if yes how?
I agree that this is an excellent EA, granted there are redundant arrows, which I know can be cleaned up. While running this in a back test on EURUSD I found situations where there were red arrows pointing down and red arrows pointing up. Is this because the program is confused? Are these areas of where the strategy fails or was this a programming error? Was this the case that the tool was outputing arrows for both attempts of lines and failed to seperate which ones fired on which? I tried it with setting the two line sets false at different times and it looks like this might be the case. So, would a user benefit from running both and requiring a confirmation signal from both before considering a trigger on a trade? OR would it be best to seperate the two strategies and firing on each according to it's strategy?