
Andere Klassen in der Bibliothek DoEasy (Teil 67): Objektklasse der Charts

Inhalt
Konzept
In diesem Artikel werde ich mit der Entwicklung der Bibliotheksfunktionalität beginnen, die auf die Arbeit mit Symbolcharts ausgerichtet ist. Dies ist das Hauptarbeitswerkzeug und ich werde versuchen, es sehr bequem zu machen. Dies wird ein paar Artikel in Anspruch nehmen. Zuerst werde ich ein Chartobjekt erstellen, das alle Charteigenschaften speichern soll. Wir werden in der Lage sein, einen Chart bequem zu verwalten, indem wir sie ändern. Ein Satz von Eigenschaften des Chartobjekts ist ein Reihe von Integer-, Real- und String-Parametern des Charts sein. Zusammen mit einer schrittweisen und sequenziellen Verfeinerung des Chartobjekts wird sich sein Parametersatz ändern — einige Parameter werden hinzugefügt, einige werden in andere Objekte verschoben usw. Beginnen wir mit etwas Einfachem.
Neben der Erstellung eines Chartobjekts werde ich auch die MQL5-Signal-Objektklasse und die Kollektionsklasse der MQL5.com-Signale leicht verbessern. Derzeit ist die Arbeit mit der Signalkollektion so gestaltet, dass sich die Signaleigenschaften bei der ersten Erstellung der vollständigen Liste aller verfügbaren Signale nicht mehr ändern. Selbst wenn wir versuchen, die Kollektionsliste neu zu aktualisieren, wird sie einfach ein Signal erhalten, das neu in der MQL5.com Signals-Datenbank erschienen ist. Die Signale, die zuvor zur Kollektionsliste hinzugefügt wurden, bleiben unverändert. Dieses Verhalten ist falsch, da sich die Signaleigenschaften durch den Handel auf dem Konto eines Signalanbieters ändern. Daher werde ich es so einrichten, dass neue Signale zur Liste hinzugefügt werden, während die Eigenschaften der vorhandenen Signale bei jeder Aktualisierung der Signalsammelliste aktualisiert werden.
Verbesserung der Bibliothek der Klasse
Zurzeit werden in der Kollektionsklasse der Bibliothek alle MQL5.com-Signale-Parameterwerte sofort in die entsprechenden Eigenschaften des MQL5-Signalobjekts in dessen Konstruktor eingetragen, wenn ein neues Signalobjekt erzeugt wird. Wir müssen die Methode hinzufügen, in der alle Werte der ausgewählten Signalparameter in die Objekteigenschaften eingetragen werden. So werden wir in der Lage sein, ein notwendiges Signal auszuwählen und die neue Methode aufzurufen, um die Eigenschaften des bereits vorhandenen Signalobjekts zu aktualisieren. Wir werden auch die Methode benötigen, die das notwendige Signal in der MQL5.com-Signaldatenbank durch die Signal-ID auswählt (in MQL5 wird das Signal nur durch seinen Index ausgewählt, aber das Speichern eines Signalindexes in den Objekteigenschaften ist unzuverlässig, da sich Signalindizes in der Datenbank ändern können).
Fügen wir in \MQL5\Include\DoEasy\Objects\MQLSignalBase\MQLSignal.mqh drei neue öffentliche Methoden hinzu:
die Methode zum Schreiben von Parameterwerten eines ausgewählten MQL5.com-Signals in die entsprechenden Signalobjekteigenschaften,
die Methode zur Rückgabe eines Signalindexes in der MQL5.com-Signaldatenbank anhand seiner ID und
die Methode zur Auswahl eines Signals mit einer bestimmten ID in der MQL5.com-Signaldatenbank für die weitere Arbeit:
//--- Compare CMQLSignal objects by a specified property (to sort the list by an MQL5 signal object)
   virtual int       Compare(const CObject *node,const int mode=0) const;
//--- Compare CMQLSignal objects by all properties (to search for equal MQL5 signal objects)
   bool              IsEqual(CMQLSignal* compared_obj) const;

//--- Set signal object properties
   void              SetProperties(void);
//--- Look for a signal with a specified ID in the database, return the signal index
   int               IndexBase(const long signal_id);
//--- Select a signal in the signal database by its ID
   bool              SelectBase(const long signal_id);

//--- Constructors
                     CMQLSignal(){;}
                     CMQLSignal(const long signal_id);
Wir übergeben die Eingaben der Signalparameter an die entsprechenden Objekteigenschaften in der neuen Methode SetProperties() aus dem Konstruktor der parametrischen Klasse:
//+------------------------------------------------------------------+
//| Set object properties                                            |
//+------------------------------------------------------------------+
void CMQLSignal::SetProperties(void)
  {
   this.m_long_prop[SIGNAL_MQL5_PROP_SUBSCRIPTION_STATUS]            = (::SignalInfoGetInteger(SIGNAL_INFO_ID)==this.ID());
   this.m_long_prop[SIGNAL_MQL5_PROP_TRADE_MODE]                     = ::SignalBaseGetInteger(SIGNAL_BASE_TRADE_MODE);
   this.m_long_prop[SIGNAL_MQL5_PROP_DATE_PUBLISHED]                 = ::SignalBaseGetInteger(SIGNAL_BASE_DATE_PUBLISHED);
   this.m_long_prop[SIGNAL_MQL5_PROP_DATE_STARTED]                   = ::SignalBaseGetInteger(SIGNAL_BASE_DATE_STARTED);
   this.m_long_prop[SIGNAL_MQL5_PROP_DATE_UPDATED]                   = ::SignalBaseGetInteger(SIGNAL_BASE_DATE_UPDATED);
   this.m_long_prop[SIGNAL_MQL5_PROP_LEVERAGE]                       = ::SignalBaseGetInteger(SIGNAL_BASE_LEVERAGE);
   this.m_long_prop[SIGNAL_MQL5_PROP_PIPS]                           = ::SignalBaseGetInteger(SIGNAL_BASE_PIPS);
   this.m_long_prop[SIGNAL_MQL5_PROP_RATING]                         = ::SignalBaseGetInteger(SIGNAL_BASE_RATING);
   this.m_long_prop[SIGNAL_MQL5_PROP_SUBSCRIBERS]                    = ::SignalBaseGetInteger(SIGNAL_BASE_SUBSCRIBERS);
   this.m_long_prop[SIGNAL_MQL5_PROP_TRADES]                         = ::SignalBaseGetInteger(SIGNAL_BASE_TRADES);

   this.m_double_prop[this.IndexProp(SIGNAL_MQL5_PROP_BALANCE)]      = ::SignalBaseGetDouble(SIGNAL_BASE_BALANCE);
   this.m_double_prop[this.IndexProp(SIGNAL_MQL5_PROP_EQUITY)]       = ::SignalBaseGetDouble(SIGNAL_BASE_EQUITY);
   this.m_double_prop[this.IndexProp(SIGNAL_MQL5_PROP_GAIN)]         = ::SignalBaseGetDouble(SIGNAL_BASE_GAIN);
   this.m_double_prop[this.IndexProp(SIGNAL_MQL5_PROP_MAX_DRAWDOWN)] = ::SignalBaseGetDouble(SIGNAL_BASE_MAX_DRAWDOWN);
   this.m_double_prop[this.IndexProp(SIGNAL_MQL5_PROP_PRICE)]        = ::SignalBaseGetDouble(SIGNAL_BASE_PRICE);
   this.m_double_prop[this.IndexProp(SIGNAL_MQL5_PROP_ROI)]          = ::SignalBaseGetDouble(SIGNAL_BASE_ROI);

   this.m_string_prop[this.IndexProp(SIGNAL_MQL5_PROP_AUTHOR_LOGIN)] = ::SignalBaseGetString(SIGNAL_BASE_AUTHOR_LOGIN);
   this.m_string_prop[this.IndexProp(SIGNAL_MQL5_PROP_BROKER)]       = ::SignalBaseGetString(SIGNAL_BASE_BROKER);
   this.m_string_prop[this.IndexProp(SIGNAL_MQL5_PROP_BROKER_SERVER)]= ::SignalBaseGetString(SIGNAL_BASE_BROKER_SERVER);
   this.m_string_prop[this.IndexProp(SIGNAL_MQL5_PROP_NAME)]         = ::SignalBaseGetString(SIGNAL_BASE_NAME);
   this.m_string_prop[this.IndexProp(SIGNAL_MQL5_PROP_CURRENCY)]     = ::SignalBaseGetString(SIGNAL_BASE_CURRENCY);
  }
//+------------------------------------------------------------------+
Da ein Signal vorab in der MQL5.com-Signaldatenbank ausgewählt werden sollte, impliziert das Abrufen von Signalparameterwerten und das Schreiben in die Objekteigenschaften, dass das Signal zuvor ausgewählt wird.
Führen wir im Klassenkonstruktor den Aufruf der Methode ein, anstelle von einer Zeichenkette, die an eine neue Methode übergeben werden:
//+------------------------------------------------------------------+
//| Parametric constructor                                           |
//+------------------------------------------------------------------+
CMQLSignal::CMQLSignal(const long signal_id)
  {
   this.m_long_prop[SIGNAL_MQL5_PROP_ID] = signal_id;
   this.SetProperties();
  }
//+------------------------------------------------------------------+
Die Methode gibt den Index eines Signals zurück, das durch die ID in der MQL5.com Signals-Datenbank spezifiziert wurde:
//+------------------------------------------------------------------+
//| Look for a signal with a specified ID in the database,           |
//| return the index of a detected signal                            |
//+------------------------------------------------------------------+
int CMQLSignal::IndexBase(const long signal_id)
  {
   int total=::SignalBaseTotal();
   for(int i=0;i<total;i++)
     {
      if(::SignalBaseSelect(i) && ::SignalBaseGetInteger(SIGNAL_BASE_ID)==signal_id)
         return i;
     }
   return WRONG_VALUE;
  }
//+------------------------------------------------------------------+
Hier, in der Schleife über die Gesamtzahl der Signale, wähle das nächste Signal und vergleiche seine ID mit der, die an die Methode übergeben wurde. Wenn die IDs übereinstimmen, wird der Schleifenindex zurückgegeben (der einem Signalindex in der Datenbank entspricht). Wenn kein Signal mit einer solchen ID gefunden wird, wird -1 zurückgegeben.
Nach der Methodenoperation bleibt das gefundene Signal in der Signaldatenbank für die weitere Arbeit ausgewählt.
Die folgende Methode wählt ein über die ID angegebenes Signal aus:
//+------------------------------------------------------------------+
//| Select a signal by its ID in the signal database                 |
//+------------------------------------------------------------------+
bool CMQLSignal::SelectBase(const long signal_id)
  {
   return(this.IndexBase(signal_id)!=WRONG_VALUE);
  }
//+------------------------------------------------------------------+
Die Methode gibt das Flag zurück, das anzeigt, dass die Suche nach einem Signal mit einer bestimmten ID keine -1 zurückgegeben hat, d. h. wenn der Signalindex gefunden wird (er ist ungleich -1), wird das Signal ausgewählt (es wird true zurückgegeben). Wenn die Suche nach einem Signal -1 ergibt, wird false zurückgegeben, was bedeutet, dass es kein Signal mit dieser ID gibt und es dementsprechend nicht ausgewählt wird.
In der Datei der der Kollektionsklasse der MQL5-Signale \MQL5\Include\DoEasy\Collections\MQLSignalsCollection.mqh, sind einige kleinere Änderungen an der Methode zur Aktualisierung der Kollektionsliste vorgenommen worden:
//+------------------------------------------------------------------+
//| Update the collection list of MQL5 signal objects                |
//+------------------------------------------------------------------+
void CMQLSignalsCollection::Refresh(const bool messages=true)
  {
   this.m_signals_base_total=::SignalBaseTotal();
   //--- loop through all signals in the signal database
   for(int i=0;i<this.m_signals_base_total;i++)
     {
      //--- Select a signal from the signal database by the loop index
      if(!::SignalBaseSelect(i))
         continue;
      //--- Get the current signal ID and
      //--- create a new MQL5 signal object based on it
      long id=::SignalBaseGetInteger(SIGNAL_BASE_ID);
      CMQLSignal *signal=new CMQLSignal(id);
      if(signal==NULL)
         continue;
      //--- Set the sorting flag for the list by signal ID
      this.m_list.Sort(SORT_BY_SIGNAL_MQL5_ID);
      //--- Get the index of the MQL5 signal object in the list
      int index=this.m_list.Search(signal);
      //--- If such an object exists (the index exceeds -1)
      if(index!=WRONG_VALUE)
        {
         //--- Remove the newly created object,
         delete signal;
         //--- get the pointer to such an object in the list
         signal=this.m_list.At(index);
         //--- if the pointer is received, update all signal properties
         if(signal!=NULL)
            signal.SetProperties();
         //--- move on to the next loop iteration
         continue;
        }
      //--- No such object in the collection list yet
      //--- If failed to add a new signal object to the collection list,
      //--- remove the created object and go to the next loop iteration
      if(!this.m_list.InsertSort(signal))
        {
         delete signal;
         continue;
        }
      //--- If an MQL5 signal object is successfully added to the collection
      //--- and the new object message flag is set in the parameters passed to the method,
      //--- display a message about a newly found signal
      else if(messages)
        {
         ::Print(DFUN,CMessage::Text(MSG_MQLSIG_COLLECTION_TEXT_SIGNALS_NEW),":");
         signal.PrintShort(true);
        }
     }
  }
//+------------------------------------------------------------------+
Hier, im neuen Code-Block, wird die gesamte Logik in den Kommentaren beschrieben. Kurz gesagt, die in der Kollektion vorhandenen Objekte werden nicht übersprungen. Stattdessen wird für sie die oben beschriebene neue Methode SetProperties() aufgerufen. Diese Methode trägt die Werte der entsprechenden Parameter eines in der Datenbank ausgewählten Signals in alle Objekteigenschaften ein.
Damit ist die Verbesserung der Klassen für die Arbeit mit MQL5.com-Signalen abgeschlossen.
Beginnen wir nun mit der Entwicklung der Objektklasse der Charts.
Ein Chart und dementsprechend auch ein Chartobjekt verfügen über eine ganze Reihe von Parametern. Zunächst müssen wir neue Textmeldungen erstellen, die sich auf das Chart-Objekt beziehen.
In \MQL5\Include\DoEasy\Data.mqh fügen wir die neue Nachrichtenindizes hinzu:
//--- CChartObj
   MSG_CHART_OBJ_ID,                                  // Chart ID
   MSG_CHART_OBJ_SHOW,                                // Draw price chart attributes
   MSG_CHART_OBJ_IS_OBJECT,                           // Chart object
   MSG_CHART_OBJ_BRING_TO_TOP,                        // Chart above all others
   MSG_CHART_OBJ_CONTEXT_MENU,                        // Access the context menu using the right click
   MSG_CHART_OBJ_CROSSHAIR_TOOL,                      // Access the Crosshair tool using the middle click
   MSG_CHART_OBJ_MOUSE_SCROLL,                        // Scroll the chart horizontally using the left mouse button
   MSG_CHART_OBJ_EVENT_MOUSE_WHEEL,                   // Send messages about mouse wheel events to all MQL5 programs on a chart
   MSG_CHART_OBJ_EVENT_MOUSE_MOVE,                    // Send messages about mouse button click and movement events to all MQL5 programs on a chart
   MSG_CHART_OBJ_EVENT_OBJECT_CREATE,                 // Send messages about the graphical object creation event to all MQL5 programs on a chart
   MSG_CHART_OBJ_EVENT_OBJECT_DELETE,                 // Send messages about the graphical object destruction event to all MQL5 programs on a chart
   MSG_CHART_OBJ_MODE,                                // Chart type
   MSG_CHART_OBJ_FOREGROUND,                          // Price chart in the foreground
   MSG_CHART_OBJ_SHIFT,                               // Shift of the price chart from the right border
   MSG_CHART_OBJ_AUTOSCROLL,                          // Auto scroll to the right border of the chart
   MSG_CHART_OBJ_KEYBOARD_CONTROL,                    // Manage the chart using a keyboard
   MSG_CHART_OBJ_QUICK_NAVIGATION,                    // Allow the chart to intercept Space and Enter key strokes to activate the quick navigation bar
   MSG_CHART_OBJ_SCALE,                               // Scale
   MSG_CHART_OBJ_SCALEFIX,                            // Fixed scale
   MSG_CHART_OBJ_SCALEFIX_11,                         // Scale 1:1
   MSG_CHART_OBJ_SCALE_PT_PER_BAR,                    // Scale in points per bar
   MSG_CHART_OBJ_SHOW_TICKER,                         // Display a symbol ticker in the upper left corner
   MSG_CHART_OBJ_SHOW_OHLC,                           // Display OHLC values in the upper left corner
   MSG_CHART_OBJ_SHOW_BID_LINE,                       // Display Bid value as a horizontal line on the chart
   MSG_CHART_OBJ_SHOW_ASK_LINE,                       // Display Ask value as a horizontal line on a chart
   MSG_CHART_OBJ_SHOW_LAST_LINE,                      // Display Last value as a horizontal line on a chart
   MSG_CHART_OBJ_SHOW_PERIOD_SEP,                     // Display vertical separators between adjacent periods
   MSG_CHART_OBJ_SHOW_GRID,                           // Display a grid on the chart
   MSG_CHART_OBJ_SHOW_VOLUMES,                        // Display volumes on a chart
   MSG_CHART_OBJ_SHOW_OBJECT_DESCR,                   // Display text descriptions of objects
   MSG_CHART_OBJ_VISIBLE_BARS,                        // Number of bars on a chart that are available for display
   MSG_CHART_OBJ_WINDOWS_TOTAL,                       // Total number of chart windows including indicator subwindows
   MSG_CHART_OBJ_WINDOW_IS_VISIBLE,                   // Subwindow visibility
   MSG_CHART_OBJ_WINDOW_HANDLE,                       // Chart window handle
   MSG_CHART_OBJ_WINDOW_YDISTANCE,                    // Distance in Y axis pixels between the upper frame of the indicator subwindow and the upper frame of the chart main window
   MSG_CHART_OBJ_FIRST_VISIBLE_BAR,                   // Number of the first visible bar on the chart
   MSG_CHART_OBJ_WIDTH_IN_BARS,                       // Width of the chart in bars
   MSG_CHART_OBJ_WIDTH_IN_PIXELS,                     // Width of the chart in pixels
   MSG_CHART_OBJ_HEIGHT_IN_PIXELS,                    // Height of the chart in pixels
   MSG_CHART_OBJ_COLOR_BACKGROUND,                    // Color of background of the chart
   MSG_CHART_OBJ_COLOR_FOREGROUND,                    // Color of axes, scale and OHLC line
   MSG_CHART_OBJ_COLOR_GRID,                          // Grid color
   MSG_CHART_OBJ_COLOR_VOLUME,                        // Color of volumes and position opening levels
   MSG_CHART_OBJ_COLOR_CHART_UP,                      // Color for the up bar, shadows and body borders of bull candlesticks
   MSG_CHART_OBJ_COLOR_CHART_DOWN,                    // Color of down bar, its shadow and border of body of the bullish candlestick
   MSG_CHART_OBJ_COLOR_CHART_LINE,                    // Color of the chart line and the Doji candlesticks
   MSG_CHART_OBJ_COLOR_CANDLE_BULL,                   // Color of body of a bullish candlestick
   MSG_CHART_OBJ_COLOR_CANDLE_BEAR,                   // Color of body of a bearish candlestick
   MSG_CHART_OBJ_COLOR_BID,                           // Color of the Bid price line
   MSG_CHART_OBJ_COLOR_ASK,                           // Color of the Ask price line
   MSG_CHART_OBJ_COLOR_LAST,                          // Color of the last performed deal's price line (Last)
   MSG_CHART_OBJ_COLOR_STOP_LEVEL,                    // Color of stop order levels (Stop Loss and Take Profit)
   MSG_CHART_OBJ_SHOW_TRADE_LEVELS,                   // Display trade levels on the chart (levels of open positions, Stop Loss, Take Profit and pending orders)
   MSG_CHART_OBJ_DRAG_TRADE_LEVELS,                   // Drag trading levels on a chart using a mouse
   MSG_CHART_OBJ_SHOW_DATE_SCALE,                     // Display the time scale on a chart
   MSG_CHART_OBJ_SHOW_PRICE_SCALE,                    // Display a price scale on a chart
   MSG_CHART_OBJ_SHOW_ONE_CLICK,                      // Display the quick trading panel on the chart
   MSG_CHART_OBJ_IS_MAXIMIZED,                        // Chart window maximized
   MSG_CHART_OBJ_IS_MINIMIZED,                        // Chart window minimized
   MSG_CHART_OBJ_IS_DOCKED,                           // Chart window docked
   MSG_CHART_OBJ_FLOAT_LEFT,                          // Left coordinate of the undocked chart window relative to the virtual screen
   MSG_CHART_OBJ_FLOAT_TOP,                           // Upper coordinate of the undocked chart window relative to the virtual screen
   MSG_CHART_OBJ_FLOAT_RIGHT,                         // Right coordinate of the undocked chart window relative to the virtual screen
   MSG_CHART_OBJ_FLOAT_BOTTOM,                        // Bottom coordinate of the undocked chart window relative to the virtual screen

   MSG_CHART_OBJ_SHIFT_SIZE,                          // Shift size of the zero bar from the right border in %
   MSG_CHART_OBJ_FIXED_POSITION,                      // Chart fixed position from the left border in %
   MSG_CHART_OBJ_FIXED_MAX,                           // Chart fixed maximum
   MSG_CHART_OBJ_FIXED_MIN,                           // Chart fixed minimum
   MSG_CHART_OBJ_POINTS_PER_BAR,                      // Scale in points per bar
   MSG_CHART_OBJ_PRICE_MIN,                           // Chart minimum
   MSG_CHART_OBJ_PRICE_MAX,                           // Chart maximum

   MSG_CHART_OBJ_COMMENT,                             // Chart comment text
   MSG_CHART_OBJ_EXPERT_NAME,                         // Name of an EA launched on the chart
   MSG_CHART_OBJ_SCRIPT_NAME,                         // Name of a script launched on the chart

   MSG_CHART_OBJ_CHART_BARS,                          // Display as bars
   MSG_CHART_OBJ_CHART_CANDLES,                       // Display as Japaneses candlesticks
   MSG_CHART_OBJ_CHART_LINE,                          // Display as a line drawn at Close prices
   MSG_CHART_OBJ_CHART_VOLUME_HIDE,                   // Volumes not displayed
   MSG_CHART_OBJ_CHART_VOLUME_TICK,                   // Tick volumes
   MSG_CHART_OBJ_CHART_VOLUME_REAL,                   // Trading volumes

   MSG_CHART_OBJ_CHART_WINDOW,                        // Chart window

  };
//+------------------------------------------------------------------+
und die Textnachrichten, die den neu hinzugefügten Indizes entsprechen:
//--- CChartObj
   {"Идентификатор графика","Chart ID"},
   {"Отрисовка атрибутов ценового графика","Drawing attributes of a price chart"},
   {"Объект \"График\"","Object \"Chart\""},
   {"График поверх всех других","Chart on top of other charts"},
   {"Доступ к контекстному меню по нажатию правой клавиши мыши","Accessing the context menu by pressing the right mouse button"},
   {"Доступ к инструменту \"Перекрестие\" по нажатию средней клавиши мыши","Accessing the \"Crosshair tool\" by pressing the middle mouse button"},
   {"Прокрутка графика левой кнопкой мышки по горизонтали","Scrolling the chart horizontally using the left mouse button"},
   {"Отправка всем mql5-программам на графике сообщений о событиях колёсика мыши","Sending messages about mouse wheel events to all mql5 programs on a chart"},
   {"Отправка всем mql5-программам на графике сообщений о событиях перемещения и нажатия кнопок мыши","Send notifications of mouse move and mouse click events to all mql5 programs on a chart"},
   {"Отправка всем mql5-программам на графике сообщений о событии создания графического объекта","Send a notification of an event of new object creation to all mql5-programs on a chart"},
   {"Отправка всем mql5-программам на графике сообщений о событии уничтожения графического объекта","Send a notification of an event of object deletion to all mql5-programs on a chart"},
   {"Тип графика","Chart type"},
   {"Ценовой график на переднем плане","Price chart in the foreground"},
   {"Отступ ценового графика от правого края","Price chart indent from the right border"},
   {"Автоматический переход к правому краю графика","Automatic moving to the right border of the chart"},
   {"Управление графиком с помощью клавиатуры","Managing the chart using a keyboard"},
   {"Перехват графиком нажатий клавиш Space и Enter для активации строки быстрой навигации","Allowed to intercept Space and Enter key presses on the chart to activate the quick navigation bar"},
   {"Масштаб","Scale"},
   {"Фиксированный масштаб","Fixed scale mode"},
   {"Масштаб 1:1","Scale 1:1 mode"},
   {"Масштаб в пунктах на бар","Scale to be specified in points per bar"},
   {"Отображение в левом верхнем углу тикера символа","Display a symbol ticker in the upper left corner"},
   {"Отображение в левом верхнем углу значений OHLC","Display OHLC values in the upper left corner"},
   {"Отображение значения Bid горизонтальной линией на графике","Display Bid values as a horizontal line in a chart"},
   {"Отображение значения Ask горизонтальной линией на графике","Display Ask values as a horizontal line in a chart"},
   {"Отображение значения Last горизонтальной линией на графике","Display Last values as a horizontal line in a chart"},
   {"Отображение вертикальных разделителей между соседними периодами","Display vertical separators between adjacent periods"},
   {"Отображение сетки на графике","Display grid in the chart"},
   {"Отображение объемов на графике","Display volume in the chart"},
   {"Отображение текстовых описаний объектов","Display textual descriptions of objects"},
   {"Количество баров на графике, доступных для отображения","The number of bars on the chart that can be displayed"},
   {"Общее количество окон графика с подокнами индикаторов","The total number of chart windows, including indicator subwindows"},
   {"Видимость подокон","Visibility of subwindows"},
   {"Хэндл окна графика","Chart window handle"},
   {"Дистанция в пикселях по оси Y между верхней рамкой подокна индикатора и верхней рамкой главного окна графика","The distance between the upper frame of the indicator subwindow and the upper frame of the main chart window"},
   {"Номер первого видимого бара на графике","Number of the first visible bar in the chart"},
   {"Ширина графика в барах","Chart width in bars"},
   {"Ширина графика в пикселях","Chart width in pixels"},
   {"Высота графика в пикселях","Chart height in pixels"},
   {"Цвет фона графика","Chart background color"},
   {"Цвет осей, шкалы и строки OHLC","Color of axes, scales and OHLC line"},
   {"Цвет сетки","Grid color"},
   {"Цвет объемов и уровней открытия позиций","Color of volumes and position opening levels"},
   {"Цвет бара вверх, тени и окантовки тела бычьей свечи","Color for the up bar, shadows and body borders of bull candlesticks"},
   {"Цвет бара вниз, тени и окантовки тела медвежьей свечи","Color for the down bar, shadows and body borders of bear candlesticks"},
   {"Цвет линии графика и японских свечей \"Доджи\"","Line chart color and color of \"Doji\" Japanese candlesticks"},
   {"Цвет тела бычьей свечи","Body color of a bull candlestick"},
   {"Цвет тела медвежьей свечи","Body color of a bear candlestick"},
   {"Цвет линии Bid-цены","Bid price level color"},
   {"Цвет линии Ask-цены","Ask price level color"},
   {"Цвет линии цены последней совершенной сделки (Last)","Line color of the last executed deal price (Last)"},
   {"Цвет уровней стоп-ордеров (Stop Loss и Take Profit)","Color of stop order levels (Stop Loss and Take Profit)"},
   {"Отображение на графике торговых уровней (уровни открытых позиций, Stop Loss, Take Profit и отложенных ордеров)","Displaying trade levels in the chart (levels of open positions, Stop Loss, Take Profit and pending orders)"},
   {"Перетаскивание торговых уровней на графике с помощью мышки","Permission to drag trading levels on a chart with a mouse"},
   {"Отображение на графике шкалы времени","Showing the time scale on a chart"},
   {"Отображение на графике ценовой шкалы","Showing the price scale on a chart"},
   {"Отображение на графике панели быстрой торговли","Showing the \"One click trading\" panel on a chart"},
   {"Окно графика развернуто","Chart window is maximized"},
   {"Окно графика свернуто","Chart window is minimized"},
   {"Окно графика закреплено","The chart window is docked"},
   {"Левая координата открепленного графика относительно виртуального экрана","The left coordinate of the undocked chart window relative to the virtual screen"},
   {"Верхняя координата открепленного графика относительно виртуального экрана","The top coordinate of the undocked chart window relative to the virtual screen"},
   {"Правая координата открепленного графика  относительно виртуального экрана","The right coordinate of the undocked chart window relative to the virtual screen"},
   {"Нижняя координата открепленного графика  относительно виртуального экрана","The bottom coordinate of the undocked chart window relative to the virtual screen"},

   {"Размер отступа нулевого бара от правого края в процентах","The size of the zero bar indent from the right border in percents"},
   {"Положение фиксированной позиции графика от левого края в процентах","Chart fixed position from the left border in percent value"},
   {"Фиксированный максимум графика","Fixed  chart maximum"},
   {"Фиксированный минимум графика","Fixed  chart minimum "},
   {"Масштаб в пунктах на бар","Scale in points per bar"},
   {"Минимум графика","Chart minimum"},
   {"Максимум графика","Chart maximum"},

   {"Текст комментария на графике","Text of a comment in a chart"},
   {"Имя эксперта, запущенного на графике","The name of the Expert Advisor running on the chart"},
   {"Имя скрипта, запущенного на графике","The name of the script running on the chart"},

   {"Отображение в виде баров","Display as a sequence of bars"},
   {"Отображение в виде японских свечей","Display as Japanese candlesticks"},
   {"Отображение в виде линии, проведенной по ценам Close","Display as a line drawn by Close prices"},
   {"Объемы не показаны","Volumes are not shown"},
   {"Тиковые объемы","Tick volumes"},
   {"Торговые объемы","Trade volumes"},

   {"Окно графика","Chart window"},

  };
//+---------------------------------------------------------------------+
Siehe den Artikel 19 zum allgemeinen Verständnis von Nachrichten, Nachrichtenindexkonstanten und Listen. Der Artikel beschreibt die Entwicklung der Nachrichtenklasse der Bibliothek im Detail.
Um eine Beschreibung einiger Eigenschaften eines erstellten Chart-Objekts anzuzeigen, benötige ich zwei Funktionen — für die Rückgabe der Beschreibung des Chart-Anzeigemodus (Balken, Kerzen, Linie) und für die Rückgabe des Modus der Anzeige von Volumina im Chart (nicht angezeigt, Tick, Real). Fügen wir die Funktionen in die Service-Funktionen-Datei \MQL5\Include\DoEasy\Services\DELib.mqh ein, so dass sie immer zur Hand sind:
//+------------------------------------------------------------------+
//| Return the description of the method of displaying a price chart |
//+------------------------------------------------------------------+
string ChartModeDescription(ENUM_CHART_MODE mode)
  {
   return
     (
      mode==CHART_BARS     ? CMessage::Text(MSG_CHART_OBJ_CHART_BARS)      :
      mode==CHART_CANDLES  ? CMessage::Text(MSG_CHART_OBJ_CHART_CANDLES)   :
      CMessage::Text(MSG_CHART_OBJ_CHART_LINE)
     );
  }
//+--------------------------------------------------------------------------+
//|Return the description of the mode of displaying volumes on a price chart |
//+--------------------------------------------------------------------------+
string ChartModeVolumeDescription(ENUM_CHART_VOLUME_MODE mode)
  {
   return
     (
      mode==CHART_VOLUME_TICK ? CMessage::Text(MSG_CHART_OBJ_CHART_VOLUME_TICK)  :
      mode==CHART_VOLUME_REAL ? CMessage::Text(MSG_CHART_OBJ_CHART_VOLUME_REAL)  :
      CMessage::Text(MSG_CHART_OBJ_CHART_VOLUME_HIDE)
     );
  }
//+------------------------------------------------------------------+
Beide Funktionen erhalten die entsprechende Chart-Eigenschaft. Deren Übereinstimmung mit einer der Enumerationskonstanten wird geprüft und die Text-Beschreibung des Chart-/Volumenmodus wird zurückgegeben.
Jedes der Bibliotheksobjekte verfügt über die Liste der in \MQL5\Include\DoEasy\Defines.mqh festgelegten Eigenschaften. Das Chart-Objekt ist da keine Ausnahme. Stellen wir alle notwendigen Eigenschaften dafür in drei Aufzählungen von integer, real und string Eigenschaften ein:
//+------------------------------------------------------------------+
//| Data for working with charts                                     |
//+------------------------------------------------------------------+
//+------------------------------------------------------------------+
//| List of possible chart events                                    |
//+------------------------------------------------------------------+
#define CHART_EVENTS_NEXT_CODE  (SIGNAL_MQL5_EVENTS_NEXT_CODE+1)   // The code of the next event after the last chart event code
//+------------------------------------------------------------------+
//| Chart integer property                                           |
//+------------------------------------------------------------------+
enum ENUM_CHART_PROP_INTEGER
  {
   CHART_PROP_ID = 0,                                 // Chart ID
   CHART_PROP_TIMEFRAME,                              // Chart timeframe
   CHART_PROP_SHOW,                                   // Price chart drawing
   CHART_PROP_IS_OBJECT,                              // Chart object (OBJ_CHART) identification attribute
   CHART_PROP_BRING_TO_TOP,                           // Show chart above all others
   CHART_PROP_CONTEXT_MENU,                           // Enable/disable access to the context menu using the right click
   CHART_PROP_CROSSHAIR_TOOL,                         // Enable/disable access to the Crosshair tool using the middle click
   CHART_PROP_MOUSE_SCROLL,                           // Scroll the chart horizontally using the left mouse button
   CHART_PROP_EVENT_MOUSE_WHEEL,                      // Send messages about mouse wheel events (CHARTEVENT_MOUSE_WHEEL) to all MQL5 programs on a chart
   CHART_PROP_EVENT_MOUSE_MOVE,                       // Send messages about mouse button click and movement events (CHARTEVENT_MOUSE_MOVE) to all MQL5 programs on a chart
   CHART_PROP_EVENT_OBJECT_CREATE,                    // Send messages about the graphical object creation event (CHARTEVENT_OBJECT_CREATE) to all MQL5 programs on a chart
   CHART_PROP_EVENT_OBJECT_DELETE,                    // Send messages about the graphical object destruction event (CHARTEVENT_OBJECT_DELETE) to all MQL5 programs on a chart
   CHART_PROP_MODE,                                   // Type of the chart (candlesticks, bars or line (ENUM_CHART_MODE))
   CHART_PROP_FOREGROUND,                             // Price chart in the foreground
   CHART_PROP_SHIFT,                                  // Mode of shift of the price chart from the right border
   CHART_PROP_AUTOSCROLL,                             // The mode of automatic shift to the right border of the chart
   CHART_PROP_KEYBOARD_CONTROL,                       // Allow managing the chart using a keyboard
   CHART_PROP_QUICK_NAVIGATION,                       // Allow the chart to intercept Space and Enter key strokes to activate the quick navigation bar
   CHART_PROP_SCALE,                                  // Scale
   CHART_PROP_SCALEFIX,                               // Fixed scale mode
   CHART_PROP_SCALEFIX_11,                            // 1:1 scale mode
   CHART_PROP_SCALE_PT_PER_BAR,                       // The mode of specifying the scale in points per bar
   CHART_PROP_SHOW_TICKER,                            // Display a symbol ticker in the upper left corner
   CHART_PROP_SHOW_OHLC,                              // Display OHLC values in the upper left corner
   CHART_PROP_SHOW_BID_LINE,                          // Display Bid value as a horizontal line on the chart
   CHART_PROP_SHOW_ASK_LINE,                          // Display Ask value as a horizontal line on a chart
   CHART_PROP_SHOW_LAST_LINE,                         // Display Last value as a horizontal line on a chart
   CHART_PROP_SHOW_PERIOD_SEP,                        // Display vertical separators between adjacent periods
   CHART_PROP_SHOW_GRID,                              // Display a grid on the chart
   CHART_PROP_SHOW_VOLUMES,                           // Display volumes on a chart
   CHART_PROP_SHOW_OBJECT_DESCR,                      // Display text descriptions of objects
   CHART_PROP_VISIBLE_BARS,                           // Number of bars on a chart that are available for display
   CHART_PROP_WINDOWS_TOTAL,                          // The total number of chart windows including indicator subwindows
   //CHART_PROP_WINDOW_IS_VISIBLE,                      // Subwindow visibility
   CHART_PROP_WINDOW_HANDLE,                          // Chart window handle
   //CHART_PROP_WINDOW_YDISTANCE,                       // Distance in Y axis pixels between the upper frame of the indicator subwindow and the upper frame of the chart main window
   CHART_PROP_FIRST_VISIBLE_BAR,                      // Number of the first visible bar on the chart
   CHART_PROP_WIDTH_IN_BARS,                          // Width of the chart in bars
   CHART_PROP_WIDTH_IN_PIXELS,                        // Width of the chart in pixels
   //CHART_PROP_HEIGHT_IN_PIXELS,                       // Height of the chart in pixels
   CHART_PROP_COLOR_BACKGROUND,                       // Color of background of the chart
   CHART_PROP_COLOR_FOREGROUND,                       // Color of axes, scale and OHLC line
   CHART_PROP_COLOR_GRID,                             // Grid color
   CHART_PROP_COLOR_VOLUME,                           // Color of volumes and position opening levels
   CHART_PROP_COLOR_CHART_UP,                         // Color for the up bar, shadows and body borders of bull candlesticks
   CHART_PROP_COLOR_CHART_DOWN,                       // Color of down bar, its shadow and border of body of the bullish candlestick
   CHART_PROP_COLOR_CHART_LINE,                       // Color of the chart line and the Doji candlesticks
   CHART_PROP_COLOR_CANDLE_BULL,                      // Color of body of a bullish candlestick
   CHART_PROP_COLOR_CANDLE_BEAR,                      // Color of body of a bearish candlestick
   CHART_PROP_COLOR_BID,                              // Color of the Bid price line
   CHART_PROP_COLOR_ASK,                              // Color of the Ask price line
   CHART_PROP_COLOR_LAST,                             // Color of the last performed deal's price line (Last)
   CHART_PROP_COLOR_STOP_LEVEL,                       // Color of stop order levels (Stop Loss and Take Profit)
   CHART_PROP_SHOW_TRADE_LEVELS,                      // Display trade levels on the chart (levels of open positions, Stop Loss, Take Profit and pending orders)
   CHART_PROP_DRAG_TRADE_LEVELS,                      // Enable the ability to drag trading levels on a chart using mouse
   CHART_PROP_SHOW_DATE_SCALE,                        // Display the time scale on a chart
   CHART_PROP_SHOW_PRICE_SCALE,                       // Display a price scale on a chart
   CHART_PROP_SHOW_ONE_CLICK,                         // Display the quick trading panel on the chart
   CHART_PROP_IS_MAXIMIZED,                           // Chart window maximized
   CHART_PROP_IS_MINIMIZED,                           // Chart window minimized
   CHART_PROP_IS_DOCKED,                              // Chart window docked
   CHART_PROP_FLOAT_LEFT,                             // Left coordinate of the undocked chart window relative to the virtual screen
   CHART_PROP_FLOAT_TOP,                              // Upper coordinate of the undocked chart window relative to the virtual screen
   CHART_PROP_FLOAT_RIGHT,                            // Right coordinate of the undocked chart window relative to the virtual screen
   CHART_PROP_FLOAT_BOTTOM,                           // Bottom coordinate of the undocked chart window relative to the virtual screen
  };
#define CHART_PROP_INTEGER_TOTAL (62)                 // Total number of integer properties
#define CHART_PROP_INTEGER_SKIP  (0)                  // Number of integer DOM properties not used in sorting
//+------------------------------------------------------------------+
//| Chart real properties                                            |
//+------------------------------------------------------------------+
enum ENUM_CHART_PROP_DOUBLE
  {
   CHART_PROP_SHIFT_SIZE = CHART_PROP_INTEGER_TOTAL,  // Shift size of the zero bar from the right border in %
   CHART_PROP_FIXED_POSITION,                         // Chart fixed position from the left border in %
   CHART_PROP_FIXED_MAX,                              // Chart fixed maximum
   CHART_PROP_FIXED_MIN,                              // Chart fixed minimum
   CHART_PROP_POINTS_PER_BAR,                         // Scale in points per bar
   CHART_PROP_PRICE_MIN,                              // Chart minimum
   CHART_PROP_PRICE_MAX,                              // Chart maximum
  };
#define CHART_PROP_DOUBLE_TOTAL  (7)                  // Total number of real properties
#define CHART_PROP_DOUBLE_SKIP   (0)                  // Number of real properties not used in sorting
//+------------------------------------------------------------------+
//| Chart string properties                                          |
//+------------------------------------------------------------------+
enum ENUM_CHART_PROP_STRING
  {
   CHART_PROP_COMMENT = (CHART_PROP_INTEGER_TOTAL+CHART_PROP_DOUBLE_TOTAL), // Chart comment text
   CHART_PROP_EXPERT_NAME,                            // Name of an EA launched on the chart
   CHART_PROP_SCRIPT_NAME,                            // Name of a script launched on the chart
   CHART_PROP_SYMBOL,                                 // Chart symbol
  };
#define CHART_PROP_STRING_TOTAL  (4)                  // Total number of string properties
//+------------------------------------------------------------------+
Drei Eigenschaften in der Enumeration der Integer-Objekteigenschaften werden noch nicht benötigt, daher sind sie auskommentiert. Sie wurden hier hinzugefügt, weil sie im Chart vorhanden sind, sich aber nicht nur auf das Chartobjekt (Chart-Hauptfenster), sondern auch auf die Unterfenster des Hauptfensters beziehen, also nicht ausschließlich zu einem einzelnen Chartobjekt gehören können. Diese Eigenschaften werden später aktiviert.
Wie üblich müssen wir nach dem Hinzufügen neuer Objekteigenschaftsaufzählungen die Aufzählung der möglichen Objektsortierkriterien hinzufügen:
//+------------------------------------------------------------------+
//| Possible chart sorting criteria                                  |
//+------------------------------------------------------------------+
#define FIRST_CHART_DBL_PROP  (CHART_PROP_INTEGER_TOTAL-CHART_PROP_INTEGER_SKIP)
#define FIRST_CHART_STR_PROP  (CHART_PROP_INTEGER_TOTAL-CHART_PROP_INTEGER_SKIP+CHART_PROP_DOUBLE_TOTAL-CHART_PROP_DOUBLE_SKIP)
enum ENUM_SORT_CHART_MODE
  {
//--- Sort by integer properties
   SORT_BY_CHART_SHOW = 0,                            // Sort by the price chart drawing attribute
   SORT_BY_CHART_IS_OBJECT,                           // Sort by chart object (OBJ_CHART) identification attribute
   SORT_BY_CHART_BRING_TO_TOP,                        // Sort by the flag of displaying a chart above all others
   SORT_BY_CHART_CONTEXT_MENU,                        // Sort by the flag of enabling/disabling access to the context menu using the right click
   SORT_BY_CHART_CROSSHAIR_TOO,                       // Sort by the flag of enabling/disabling access to the Crosshair tool using the middle click
   SORT_BY_CHART_MOUSE_SCROLL,                        // Sort by the flag of scrolling the chart horizontally using the left mouse button
   SORT_BY_CHART_EVENT_MOUSE_WHEEL,                   // Sort by the flag of sending messages about mouse wheel events to all MQL5 programs on a chart
   SORT_BY_CHART_EVENT_MOUSE_MOVE,                    // Sort by the flag of sending messages about mouse button click and movement events to all MQL5 programs on a chart
   SORT_BY_CHART_EVENT_OBJECT_CREATE,                 // Sort by the flag of sending messages about the graphical object creation event to all MQL5 programs on a chart
   SORT_BY_CHART_EVENT_OBJECT_DELETE,                 // Sort by the flag of sending messages about the graphical object destruction event to all MQL5 programs on a chart
   SORT_BY_CHART_MODE,                                // Sort by chart type
   SORT_BY_CHART_FOREGROUND,                          // Sort by the "Price chart in the foreground" flag
   SORT_BY_CHART_SHIFT,                               // Sort by the "Mode of shift of the price chart from the right border" flag
   SORT_BY_CHART_AUTOSCROLL,                          // Sort by the "The mode of automatic shift to the right border of the chart" flag
   SORT_BY_CHART_KEYBOARD_CONTROL,                    // Sort by the flag allowing the chart management using a keyboard
   SORT_BY_CHART_QUICK_NAVIGATION,                    // Sort by the flag allowing the chart to intercept Space and Enter key strokes to activate the quick navigation bar
   SORT_BY_CHART_SCALE,                               // Sort by scale
   SORT_BY_CHART_SCALEFIX,                            // Sort by the fixed scale flag
   SORT_BY_CHART_SCALEFIX_11,                         // Sort by the 1:1 scale flag
   SORT_BY_CHART_SCALE_PT_PER_BAR,                    // Sort by the flag of specifying the scale in points per bar
   SORT_BY_CHART_SHOW_TICKER,                         // Sort by the flag displaying a symbol ticker in the upper left corner
   SORT_BY_CHART_SHOW_OHLC,                           // Sort by the flag displaying OHLC values in the upper left corner
   SORT_BY_CHART_SHOW_BID_LINE,                       // Sort by the flag displaying Bid value as a horizontal line on the chart
   SORT_BY_CHART_SHOW_ASK_LINE,                       // Sort by the flag displaying Ask value as a horizontal line on the chart
   SORT_BY_CHART_SHOW_LAST_LINE,                      // Sort by the flag displaying Last value as a horizontal line on the chart
   SORT_BY_CHART_SHOW_PERIOD_SEP,                     // Sort by the flag displaying vertical separators between adjacent periods
   SORT_BY_CHART_SHOW_GRID,                           // Sort by the flag of displaying a grid on the chart
   SORT_BY_CHART_SHOW_VOLUMES,                        // Sort by the mode of displaying volumes on a chart
   SORT_BY_CHART_SHOW_OBJECT_DESCR,                   // Sort by the flag of displaying object text descriptions
   SORT_BY_CHART_VISIBLE_BARS,                        // Sort by the number of bars on a chart that are available for display
   SORT_BY_CHART_WINDOWS_TOTAL,                       // Sort by the total number of chart windows including indicator subwindows
   SORT_BY_CHART_WINDOW_IS_VISIBLE,                   // Sort by the subwindow visibility flag
   SORT_BY_CHART_WINDOW_HANDLE,                       // Sort by the chart handle
   SORT_BY_CHART_WINDOW_YDISTANCE,                    // Sort by the distance in Y axis pixels between the upper frame of the indicator subwindow and the upper frame of the chart main window
   SORT_BY_CHART_FIRST_VISIBLE_BAR,                   // Sort by the number of the first visible bar on the chart
   SORT_BY_CHART_WIDTH_IN_BARS,                       // Sort by the width of the chart in bars
   SORT_BY_CHART_WIDTH_IN_PIXELS,                     // Sort by the width of the chart in pixels
   SORT_BY_CHART_HEIGHT_IN_PIXELS,                    // Sort by the height of the chart in pixels
   SORT_BY_CHART_COLOR_BACKGROUND,                    // Sort by the color of the chart background
   SORT_BY_CHART_COLOR_FOREGROUND,                    // Sort by color of axes, scale and OHLC line
   SORT_BY_CHART_COLOR_GRID,                          // Sort by grid color
   SORT_BY_CHART_COLOR_VOLUME,                        // Sort by the color of volumes and position opening levels
   SORT_BY_CHART_COLOR_CHART_UP,                      // Sort by the color for the up bar, shadows and body borders of bull candlesticks
   SORT_BY_CHART_COLOR_CHART_DOWN,                    // Sort by the color of down bar, its shadow and border of body of the bullish candlestick
   SORT_BY_CHART_COLOR_CHART_LINE,                    // Sort by the color of the chart line and the Doji candlesticks
   SORT_BY_CHART_COLOR_CANDLE_BULL,                   // Sort by the color of a bullish candlestick body
   SORT_BY_CHART_COLOR_CANDLE_BEAR,                   // Sort by the color of a bearish candlestick body
   SORT_BY_CHART_COLOR_BID,                           // Sort by the color of the Bid price line
   SORT_BY_CHART_COLOR_ASK,                           // Sort by the color of the Ask price line
   SORT_BY_CHART_COLOR_LAST,                          // Sort by the color of the last performed deal's price line (Last)
   SORT_BY_CHART_COLOR_STOP_LEVEL,                    // Sort by the color of stop order levels (Stop Loss and Take Profit)
   SORT_BY_CHART_SHOW_TRADE_LEVELS,                   // Sort by the flag of displaying trading levels on the chart
   SORT_BY_CHART_DRAG_TRADE_LEVELS,                   // Sort by the flag enabling the ability to drag trading levels on a chart using mouse
   SORT_BY_CHART_SHOW_DATE_SCALE,                     // Sort by the flag of displaying the time scale on the chart
   SORT_BY_CHART_SHOW_PRICE_SCALE,                    // Sort by the flag of displaying the price scale on the chart
   SORT_BY_CHART_SHOW_ONE_CLICK,                      // Sort by the flag of displaying the quick trading panel on the chart
   SORT_BY_CHART_IS_MAXIMIZED,                        // Sort by the "Chart window maximized" flag
   SORT_BY_CHART_IS_MINIMIZED,                        // Sort by the "Chart window minimized" flag
   SORT_BY_CHART_IS_DOCKED,                           // Sort by the "Chart window docked" flag
   SORT_BY_CHART_FLOAT_LEFT,                          // Sort by the left coordinate of the undocked chart window relative to the virtual screen
   SORT_BY_CHART_FLOAT_TOP,                           // Sort by the upper coordinate of the undocked chart window relative to the virtual screen
   SORT_BY_CHART_FLOAT_RIGHT,                         // Sort by the right coordinate of the undocked chart window relative to the virtual screen
   SORT_BY_CHART_FLOAT_BOTTOM,                        // Sort by the bottom coordinate of the undocked chart window relative to the virtual screen
//--- Sort by real properties
   SORT_BY_CHART_SHIFT_SIZE = FIRST_CHART_DBL_PROP,   // Sort by the shift size of the zero bar from the right border in %
   SORT_BY_CHART_FIXED_POSITION,                      // Sort by the chart fixed position from the left border in %
   SORT_BY_CHART_FIXED_MAX,                           // Sort by the fixed chart maximum
   SORT_BY_CHART_FIXED_MIN,                           // Sort by the fixed chart minimum
   SORT_BY_CHART_POINTS_PER_BAR,                      // Sort by the scale value in points per bar
   SORT_BY_CHART_PRICE_MIN,                           // Sort by the chart minimum
   SORT_BY_CHART_PRICE_MAX,                           // Sort by the chart maximum
//--- Sort by string properties
   SORT_BY_CHART_COMMENT = FIRST_CHART_STR_PROP,      // Sort by a comment text on the chart
   SORT_BY_CHART_EXPERT_NAME,                         // Sort by a name of an EA launched on the chart
   SORT_BY_CHART_SCRIPT_NAME,                         // Sort by a name of a script launched on the chart
  };
//+------------------------------------------------------------------+
Erfahren Sie mehr über die Bibliotheksobjekte im ersten und mehreren nachfolgenden Artikeln.
Jetzt ist alles bereit für die Erstellung der Objektklasse der Charts.
Objektklasse der Charts
Wir legen im neuen Ordner des Bibliotheksverzeichnisses \MQL5\Include\DoEasy\Objects\Chart\ die neue Datei ChartObj.mqh der Klasse CChartObj an.
Das Basisobjekt aller Bibliotheksobjekte sollte ein Basisobjekt sein. Seine Datei sollte mit der Klassendatei verbunden sein:
//+------------------------------------------------------------------+
//|                                                     ChartObj.mqh |
//|                                  Copyright 2021, MetaQuotes Ltd. |
//|                             https://mql5.com/en/users/artmedia70 |
//+------------------------------------------------------------------+
#property copyright "Copyright 2021, MetaQuotes Ltd."
#property link      "https://mql5.com/en/users/artmedia70"
#property version   "1.00"
#property strict    // Necessary for mql4
//+------------------------------------------------------------------+
//| Include files                                                    |
//+------------------------------------------------------------------+
#include "..\..\Objects\BaseObj.mqh"
//+------------------------------------------------------------------+
//| Chart object class                                               |
//+------------------------------------------------------------------+
class CChartObj : public CBaseObj
  {
  }
Wir fügen im privaten Klassenabschnitt die Standard-Arrays zum Speichern der Bibliothekseigenschaften, die Methoden, die den aktuellen Eigenschaftsindex im Array zurückgeben und die Klassenvariable zum Speichern des Wertes Digits() eines Symbols hinzu.
//+------------------------------------------------------------------+
//| Chart object class                                               |
//+------------------------------------------------------------------+
class CChartObj : public CBaseObj
  {
private:
   long              m_long_prop[CHART_PROP_INTEGER_TOTAL];       // Integer properties
   double            m_double_prop[CHART_PROP_DOUBLE_TOTAL];      // Real properties
   string            m_string_prop[CHART_PROP_STRING_TOTAL];      // String properties
   int               m_digits;                                    // Symbol's Digits()

//--- Return the index of the array the (1) double and (2) string properties are actually located at
   int               IndexProp(ENUM_CHART_PROP_DOUBLE property)   const { return(int)property-CHART_PROP_INTEGER_TOTAL;                         }
   int               IndexProp(ENUM_CHART_PROP_STRING property)   const { return(int)property-CHART_PROP_INTEGER_TOTAL-CHART_PROP_DOUBLE_TOTAL; }
Wir schreiben in den öffentlichen Abschnitt der Klasse alle Methoden, die Standard für die Bibliotheksobjekte sind: die Methoden zum Installieren und zurückgeben der Objekteigenschaften, die virtuellen Methoden, die die Flags der Unterstützung einer Eigenschaft durch das Objekt zurückgeben (obwohl ich keine Nachkommenschaft implementieren werde, die Methoden sollten virtuell sein, damit sie bei Bedarf in den Nachfolgeklassen geändert werden können), die Methoden, die die Eigenschaftsbeschreibungen zurückgeben, die Methoden zur Anzeige im Journal und zur Beschreibung der Objekteigenschaften und -namen, die Vergleichsmethoden und Konstruktoren.<Segment 0105>
public:
//--- Set object's (1) integer, (2) real and (3) string properties
   void              SetProperty(ENUM_CHART_PROP_INTEGER property,long value)    { this.m_long_prop[property]=value;                      }
   void              SetProperty(ENUM_CHART_PROP_DOUBLE property,double value)   { this.m_double_prop[this.IndexProp(property)]=value;    }
   void              SetProperty(ENUM_CHART_PROP_STRING property,string value)   { this.m_string_prop[this.IndexProp(property)]=value;    }
//--- Return object’s (1) integer, (2) real and (3) string property from the properties array
   long              GetProperty(ENUM_CHART_PROP_INTEGER property)         const { return this.m_long_prop[property];                     }
   double            GetProperty(ENUM_CHART_PROP_DOUBLE property)          const { return this.m_double_prop[this.IndexProp(property)];   }
   string            GetProperty(ENUM_CHART_PROP_STRING property)          const { return this.m_string_prop[this.IndexProp(property)];   }
//--- Return itself
   CChartObj        *GetObject(void)                                             { return &this;}

//--- Return the flag of the object supporting this property
   virtual bool      SupportProperty(ENUM_CHART_PROP_INTEGER property)           { return true; }
   virtual bool      SupportProperty(ENUM_CHART_PROP_DOUBLE property)            { return true; }
   virtual bool      SupportProperty(ENUM_CHART_PROP_STRING property)            { return true; }

//--- Get description of (1) integer, (2) real and (3) string properties
   string            GetPropertyDescription(ENUM_CHART_PROP_INTEGER property);
   string            GetPropertyDescription(ENUM_CHART_PROP_DOUBLE property);
   string            GetPropertyDescription(ENUM_CHART_PROP_STRING property);

//--- Display the description of object properties in the journal (full_prop=true - all properties, false - supported ones only)
   void              Print(const bool full_prop=false);
//--- Display a short description of the object in the journal
   virtual void      PrintShort(const bool dash=false);
//--- Return the object short name
   virtual string    Header(void);

//--- Compare CChartObj objects by a specified property (to sort the list by a specified chart object property)
   virtual int       Compare(const CObject *node,const int mode=0) const;
//--- Compare CChartObj objects by all properties (to search for equal chart objects)
   bool              IsEqual(CChartObj* compared_obj) const;

//--- Constructors
                     CChartObj(){;}
                     CChartObj(const long chart_id);
Dies ist ein Standardsatz von Objektmethoden der Bibliothek. Sie wurden bereits mehrfach besprochen und beschrieben, daher werde ich nicht weiter darauf eingehen.
Beim Anlegen eines Chart-Objekts wird davon ausgegangen, dass das entsprechende Chart ausgewählt ist und seine Eigenschaften über die Funktionen ChartGetInteger(), ChartGetDouble() und ChartGetString() abgerufen werden können. Daher werden im Klassenkonstruktor alle Eigenschaften des Chart-Objekts einfach mit den Werten gefüllt, die von den entsprechenden Funktionseigenschaften zurückgegeben werden, und der Wert des Symbols Digits() wird in der entsprechenden Variablen gesetzt:
//+------------------------------------------------------------------+
//| Parametric constructor                                           |
//+------------------------------------------------------------------+
CChartObj::CChartObj(const long chart_id)
  {
//--- Set integer properties
   this.SetProperty(CHART_PROP_ID,chart_id);                                                             // Chart ID
   this.SetProperty(CHART_PROP_TIMEFRAME,::ChartPeriod(this.ID()));                                      // Chart timeframe
   this.SetProperty(CHART_PROP_SHOW,::ChartGetInteger(this.ID(),CHART_SHOW));                            // Price chart drawing attribute
   this.SetProperty(CHART_PROP_IS_OBJECT,::ChartGetInteger(this.ID(),CHART_IS_OBJECT));                  // Chart object identification attribute
   this.SetProperty(CHART_PROP_BRING_TO_TOP,false);                                                      // Show chart above all others
   this.SetProperty(CHART_PROP_CONTEXT_MENU,::ChartGetInteger(this.ID(),CHART_CONTEXT_MENU));            // Access to the context menu using the right click
   this.SetProperty(CHART_PROP_CROSSHAIR_TOOL,::ChartGetInteger(this.ID(),CHART_CROSSHAIR_TOOL));        // Access the Crosshair tool by pressing the middle mouse button
   this.SetProperty(CHART_PROP_MOUSE_SCROLL,::ChartGetInteger(this.ID(),CHART_MOUSE_SCROLL));            // Scroll the chart horizontally using the left mouse button
   this.SetProperty(CHART_PROP_EVENT_MOUSE_WHEEL,::ChartGetInteger(this.ID(),CHART_EVENT_MOUSE_WHEEL));  // Send messages about mouse wheel events to all MQL5 programs on a chart
   this.SetProperty(CHART_PROP_EVENT_MOUSE_MOVE,::ChartGetInteger(this.ID(),CHART_EVENT_MOUSE_MOVE));    // Send messages about mouse button click and movement events to all MQL5 programs on a chart
   this.SetProperty(CHART_PROP_EVENT_OBJECT_CREATE,::ChartGetInteger(this.ID(),CHART_EVENT_OBJECT_CREATE)); // Send messages about the graphical object creation event to all MQL5 programs on a chart
   this.SetProperty(CHART_PROP_EVENT_OBJECT_DELETE,::ChartGetInteger(this.ID(),CHART_EVENT_OBJECT_DELETE)); // Send messages about the graphical object destruction event to all MQL5 programs on a chart
   this.SetProperty(CHART_PROP_MODE,::ChartGetInteger(this.ID(),CHART_MODE));                            // Type of the chart (candlesticks, bars or line)
   this.SetProperty(CHART_PROP_FOREGROUND,::ChartGetInteger(this.ID(),CHART_FOREGROUND));                // Price chart in the foreground
   this.SetProperty(CHART_PROP_SHIFT,::ChartGetInteger(this.ID(),CHART_SHIFT));                          // Mode of shift of the price chart from the right border
   this.SetProperty(CHART_PROP_AUTOSCROLL,::ChartGetInteger(this.ID(),CHART_AUTOSCROLL));                // The mode of automatic shift to the right border of the chart
   this.SetProperty(CHART_PROP_KEYBOARD_CONTROL,::ChartGetInteger(this.ID(),CHART_KEYBOARD_CONTROL));    // Allow managing the chart using a keyboard
   this.SetProperty(CHART_PROP_QUICK_NAVIGATION,::ChartGetInteger(this.ID(),CHART_QUICK_NAVIGATION));    // Allow the chart to intercept Space and Enter key strokes to activate the quick navigation bar
   this.SetProperty(CHART_PROP_SCALE,::ChartGetInteger(this.ID(),CHART_SCALE));                          // Scale
   this.SetProperty(CHART_PROP_SCALEFIX,::ChartGetInteger(this.ID(),CHART_SCALEFIX));                    // Fixed scale mode
   this.SetProperty(CHART_PROP_SCALEFIX_11,::ChartGetInteger(this.ID(),CHART_SCALEFIX_11));              // 1:1 scale mode
   this.SetProperty(CHART_PROP_SCALE_PT_PER_BAR,::ChartGetInteger(this.ID(),CHART_SCALE_PT_PER_BAR));    // Mode for specifying the scale in points per bar
   this.SetProperty(CHART_PROP_SHOW_TICKER,::ChartGetInteger(this.ID(),CHART_SHOW_TICKER));              // Display a symbol ticker in the upper left corner
   this.SetProperty(CHART_PROP_SHOW_OHLC,::ChartGetInteger(this.ID(),CHART_SHOW_OHLC));                  // Display OHLC values in the upper left corner
   this.SetProperty(CHART_PROP_SHOW_BID_LINE,::ChartGetInteger(this.ID(),CHART_SHOW_BID_LINE));          // Display Bid value as a horizontal line on the chart
   this.SetProperty(CHART_PROP_SHOW_ASK_LINE,::ChartGetInteger(this.ID(),CHART_SHOW_ASK_LINE));          // Display Ask value as a horizontal line on the chart
   this.SetProperty(CHART_PROP_SHOW_LAST_LINE,::ChartGetInteger(this.ID(),CHART_SHOW_LAST_LINE));        // Display Last value as a horizontal line on the chart
   this.SetProperty(CHART_PROP_SHOW_PERIOD_SEP,::ChartGetInteger(this.ID(),CHART_SHOW_PERIOD_SEP));      // Display vertical separators between adjacent periods
   this.SetProperty(CHART_PROP_SHOW_GRID,::ChartGetInteger(this.ID(),CHART_SHOW_GRID));                  // Display the chart grid
   this.SetProperty(CHART_PROP_SHOW_VOLUMES,::ChartGetInteger(this.ID(),CHART_SHOW_VOLUMES));            // Display volumes on the chart
   this.SetProperty(CHART_PROP_SHOW_OBJECT_DESCR,::ChartGetInteger(this.ID(),CHART_SHOW_OBJECT_DESCR));  // Display text descriptions of the objects
   this.SetProperty(CHART_PROP_VISIBLE_BARS,::ChartGetInteger(this.ID(),CHART_VISIBLE_BARS));            // Number of bars on a chart that are available for display
   this.SetProperty(CHART_PROP_WINDOWS_TOTAL,::ChartGetInteger(this.ID(),CHART_WINDOWS_TOTAL));          // The total number of chart windows including indicator subwindows
   this.SetProperty(CHART_PROP_WINDOW_HANDLE,::ChartGetInteger(this.ID(),CHART_WINDOW_HANDLE));          // Chart window handle
   this.SetProperty(CHART_PROP_FIRST_VISIBLE_BAR,::ChartGetInteger(this.ID(),CHART_FIRST_VISIBLE_BAR));  // Number of the first visible bar on the chart
   this.SetProperty(CHART_PROP_WIDTH_IN_BARS,::ChartGetInteger(this.ID(),CHART_WIDTH_IN_BARS));          // Chart width in bars
   this.SetProperty(CHART_PROP_WIDTH_IN_PIXELS,::ChartGetInteger(this.ID(),CHART_WIDTH_IN_PIXELS));      // Chart width in pixels
   this.SetProperty(CHART_PROP_COLOR_BACKGROUND,::ChartGetInteger(this.ID(),CHART_COLOR_BACKGROUND));    // Chart background color
   this.SetProperty(CHART_PROP_COLOR_FOREGROUND,::ChartGetInteger(this.ID(),CHART_COLOR_FOREGROUND));    // Color of axes, scale and OHLC line
   this.SetProperty(CHART_PROP_COLOR_GRID,::ChartGetInteger(this.ID(),CHART_COLOR_GRID));                // Grid color
   this.SetProperty(CHART_PROP_COLOR_VOLUME,::ChartGetInteger(this.ID(),CHART_COLOR_VOLUME));            // Color of volumes and position opening levels
   this.SetProperty(CHART_PROP_COLOR_CHART_UP,::ChartGetInteger(this.ID(),CHART_COLOR_CHART_UP));        // Color for the up bar, shadows and body borders of bullish candlesticks
   this.SetProperty(CHART_PROP_COLOR_CHART_DOWN,::ChartGetInteger(this.ID(),CHART_COLOR_CHART_DOWN));    // Color for the down bar, shadows and body borders of bearish candlesticks
   this.SetProperty(CHART_PROP_COLOR_CHART_LINE,::ChartGetInteger(this.ID(),CHART_COLOR_CHART_LINE));    // Color of the chart line and the Doji candlesticks
   this.SetProperty(CHART_PROP_COLOR_CANDLE_BULL,::ChartGetInteger(this.ID(),CHART_COLOR_CANDLE_BULL));  // Color of the bullish candle body
   this.SetProperty(CHART_PROP_COLOR_CANDLE_BEAR,::ChartGetInteger(this.ID(),CHART_COLOR_CANDLE_BEAR));  // Color of the bearish candle body
   this.SetProperty(CHART_PROP_COLOR_BID,::ChartGetInteger(this.ID(),CHART_COLOR_BID));                  // Bid price line color
   this.SetProperty(CHART_PROP_COLOR_ASK,::ChartGetInteger(this.ID(),CHART_COLOR_ASK));                  // Ask price line color
   this.SetProperty(CHART_PROP_COLOR_LAST,::ChartGetInteger(this.ID(),CHART_COLOR_LAST));                // Color of the last performed deal's price line (Last)
   this.SetProperty(CHART_PROP_COLOR_STOP_LEVEL,::ChartGetInteger(this.ID(),CHART_COLOR_STOP_LEVEL));    // Color of stop order levels (Stop Loss and Take Profit)
   this.SetProperty(CHART_PROP_SHOW_TRADE_LEVELS,::ChartGetInteger(this.ID(),CHART_SHOW_TRADE_LEVELS));  // Display trade levels on the chart (levels of open positions, Stop Loss, Take Profit and pending orders)
   this.SetProperty(CHART_PROP_DRAG_TRADE_LEVELS,::ChartGetInteger(this.ID(),CHART_DRAG_TRADE_LEVELS));  // Enable the ability to drag trading levels on a chart using mouse
   this.SetProperty(CHART_PROP_SHOW_DATE_SCALE,::ChartGetInteger(this.ID(),CHART_SHOW_DATE_SCALE));      // Display the time scale on the chart
   this.SetProperty(CHART_PROP_SHOW_PRICE_SCALE,::ChartGetInteger(this.ID(),CHART_SHOW_PRICE_SCALE));    // Display the price scale on the chart
   this.SetProperty(CHART_PROP_SHOW_ONE_CLICK,::ChartGetInteger(this.ID(),CHART_SHOW_ONE_CLICK));        // Display the quick trading panel on the chart
   this.SetProperty(CHART_PROP_IS_MAXIMIZED,::ChartGetInteger(this.ID(),CHART_IS_MAXIMIZED));            // Chart window maximized
   this.SetProperty(CHART_PROP_IS_MINIMIZED,::ChartGetInteger(this.ID(),CHART_IS_MINIMIZED));            // Chart window minimized
   this.SetProperty(CHART_PROP_IS_DOCKED,::ChartGetInteger(this.ID(),CHART_IS_DOCKED));                  // Chart window docked
   this.SetProperty(CHART_PROP_FLOAT_LEFT,::ChartGetInteger(this.ID(),CHART_FLOAT_LEFT));                // Left coordinate of the undocked chart window relative to the virtual screen
   this.SetProperty(CHART_PROP_FLOAT_TOP,::ChartGetInteger(this.ID(),CHART_FLOAT_TOP));                  // Upper coordinate of the undocked chart window relative to the virtual screen
   this.SetProperty(CHART_PROP_FLOAT_RIGHT,::ChartGetInteger(this.ID(),CHART_FLOAT_RIGHT));              // Right coordinate of the undocked chart window relative to the virtual screen
   this.SetProperty(CHART_PROP_FLOAT_BOTTOM,::ChartGetInteger(this.ID(),CHART_FLOAT_BOTTOM));            // Bottom coordinate of the undocked chart window relative to the virtual screen
//--- Set real properties
   this.SetProperty(CHART_PROP_SHIFT_SIZE,::ChartGetDouble(this.ID(),CHART_SHIFT_SIZE));                 // Shift size of the zero bar from the right border in %
   this.SetProperty(CHART_PROP_FIXED_POSITION,::ChartGetDouble(this.ID(),CHART_FIXED_POSITION));         // Chart fixed position from the left border in %
   this.SetProperty(CHART_PROP_FIXED_MAX,::ChartGetDouble(this.ID(),CHART_FIXED_MAX));                   // Fixed chart maximum
   this.SetProperty(CHART_PROP_FIXED_MIN,::ChartGetDouble(this.ID(),CHART_FIXED_MIN));                   // Fixed chart minimum
   this.SetProperty(CHART_PROP_POINTS_PER_BAR,::ChartGetDouble(this.ID(),CHART_POINTS_PER_BAR));         // Scale in points per bar
   this.SetProperty(CHART_PROP_PRICE_MIN,::ChartGetDouble(this.ID(),CHART_PRICE_MIN));                   // Chart minimum
   this.SetProperty(CHART_PROP_PRICE_MAX,::ChartGetDouble(this.ID(),CHART_PRICE_MAX));                   // Chart maximum
//--- Set string properties
   this.SetProperty(CHART_PROP_COMMENT,::ChartGetString(this.ID(),CHART_COMMENT));                       // Comment text on the chart
   this.SetProperty(CHART_PROP_EXPERT_NAME,::ChartGetString(this.ID(),CHART_EXPERT_NAME));               // name of an EA launched on the chart
   this.SetProperty(CHART_PROP_SCRIPT_NAME,::ChartGetString(this.ID(),CHART_SCRIPT_NAME));               // name of a script launched on the chart
   this.SetProperty(CHART_PROP_SYMBOL,::ChartSymbol(this.ID()));                                         // Chart symbol

   this.m_digits=(int)::SymbolInfoInteger(this.Symbol(),SYMBOL_DIGITS);
  }
//+------------------------------------------------------------------+
Die Methode Digits() des Symbols wird für die korrekte Anzeige einiger Werte von Chart-Eigenschaften benötigt.
Die Methode vergleicht die Objekte CChartObj anhand einer angegebenen Eigenschaft:
//+------------------------------------------------------------------+
//| Compare the CChartObj objects by a specified property            |
//+------------------------------------------------------------------+
int CChartObj::Compare(const CObject *node,const int mode=0) const
  {
   const CChartObj *obj_compared=node;
//--- compare integer properties of two objects
   if(mode<CHART_PROP_INTEGER_TOTAL)
     {
      long value_compared=obj_compared.GetProperty((ENUM_CHART_PROP_INTEGER)mode);
      long value_current=this.GetProperty((ENUM_CHART_PROP_INTEGER)mode);
      return(value_current>value_compared ? 1 : value_current<value_compared ? -1 : 0);
     }
//--- compare real properties of two objects
   else if(mode<CHART_PROP_DOUBLE_TOTAL+CHART_PROP_INTEGER_TOTAL)
     {
      double value_compared=obj_compared.GetProperty((ENUM_CHART_PROP_DOUBLE)mode);
      double value_current=this.GetProperty((ENUM_CHART_PROP_DOUBLE)mode);
      return(value_current>value_compared ? 1 : value_current<value_compared ? -1 : 0);
     }
//--- compare string properties of two objects
   else if(mode<CHART_PROP_DOUBLE_TOTAL+CHART_PROP_INTEGER_TOTAL+CHART_PROP_STRING_TOTAL)
     {
      string value_compared=obj_compared.GetProperty((ENUM_CHART_PROP_STRING)mode);
      string value_current=this.GetProperty((ENUM_CHART_PROP_STRING)mode);
      return(value_current>value_compared ? 1 : value_current<value_compared ? -1 : 0);
     }
   return 0;
  }
//+------------------------------------------------------------------+
Die übergebene Eigenschaft wird auf ihre Zugehörigkeit zu Integer-, Real- oder String-Eigenschaften geprüft. Die Eigenschaft des aktuellen Objekts wird mit der Eigenschaft desjenigen verglichen, das in dem entsprechenden Codeblock an die Methode zum Vergleich übergeben wurde. Das Ergebnis des Vergleichs, das größer (1), kleiner (-1) oder gleich (0) ist, wird zurückgegeben.
Die Methode vergleicht die Objekte CChartObj anhand aller Eigenschaften:
//+------------------------------------------------------------------+
//| Compare the CChartObj objects by all properties                  |
//+------------------------------------------------------------------+
bool CChartObj::IsEqual(CChartObj *compared_obj) const
  {
   int beg=0, end=CHART_PROP_INTEGER_TOTAL;
   for(int i=beg; i<end; i++)
     {
      ENUM_CHART_PROP_INTEGER prop=(ENUM_CHART_PROP_INTEGER)i;
      if(this.GetProperty(prop)!=compared_obj.GetProperty(prop)) return false;
     }
   beg=end; end+=CHART_PROP_DOUBLE_TOTAL;
   for(int i=beg; i<end; i++)
     {
      ENUM_CHART_PROP_DOUBLE prop=(ENUM_CHART_PROP_DOUBLE)i;
      if(this.GetProperty(prop)!=compared_obj.GetProperty(prop)) return false;
     }
   beg=end; end+=CHART_PROP_STRING_TOTAL;
   for(int i=beg; i<end; i++)
     {
      ENUM_CHART_PROP_STRING prop=(ENUM_CHART_PROP_STRING)i;
      if(this.GetProperty(prop)!=compared_obj.GetProperty(prop)) return false;
     }
   return true;
  }
//+------------------------------------------------------------------+
Alle nachfolgenden Eigenschaften von zwei Objekten (das aktuelle und das an die Methode übergebene) werden in drei Schleifen über alle Objekteigenschaften verglichen. Wenn mindestens ein Paar der gleichen Eigenschaften zweier verglichener Objekte nicht identisch ist, wird false zurückgegeben — die Objekte sind nicht identisch. Nach Beendigung aller Schleifen über alle Eigenschaften wird true zurückgegeben — keine unterschiedlichen Eigenschaften, d. h. die Objekte sind identisch.
Die Methoden geben die Beschreibungen der Objekteigenschaften integer, real und string zurück:
//+------------------------------------------------------------------+
//| Return description of object's integer property                  |
//+------------------------------------------------------------------+
string CChartObj::GetPropertyDescription(ENUM_CHART_PROP_INTEGER property)
  {
   return
     (
      property==CHART_PROP_ID     ?  CMessage::Text(MSG_CHART_OBJ_ID)+
         (!this.SupportProperty(property) ?  ": "+CMessage::Text(MSG_LIB_PROP_NOT_SUPPORTED) :
          ": "+(string)this.GetProperty(property)
         )  :
      property==CHART_PROP_TIMEFRAME      ?  CMessage::Text(MSG_LIB_TEXT_BAR_PERIOD)+
         (!this.SupportProperty(property) ?  ": "+CMessage::Text(MSG_LIB_PROP_NOT_SUPPORTED) :
          ": "+TimeframeDescription((ENUM_TIMEFRAMES)this.GetProperty(property))
         )  :
      property==CHART_PROP_SHOW   ?  CMessage::Text(MSG_CHART_OBJ_SHOW)+
         (!this.SupportProperty(property) ?  ": "+CMessage::Text(MSG_LIB_PROP_NOT_SUPPORTED) :
          ": "+(this.GetProperty(property) ? CMessage::Text(MSG_LIB_TEXT_YES) : CMessage::Text(MSG_LIB_TEXT_NO))
         )  :
      property==CHART_PROP_IS_OBJECT      ?  CMessage::Text(MSG_CHART_OBJ_IS_OBJECT)+
         (!this.SupportProperty(property) ?  ": "+CMessage::Text(MSG_LIB_PROP_NOT_SUPPORTED) :
          ": "+(this.GetProperty(property) ? CMessage::Text(MSG_LIB_TEXT_YES) : CMessage::Text(MSG_LIB_TEXT_NO))
         )  :
      property==CHART_PROP_BRING_TO_TOP   ?  CMessage::Text(MSG_CHART_OBJ_BRING_TO_TOP)+
         (!this.SupportProperty(property) ?  ": "+CMessage::Text(MSG_LIB_PROP_NOT_SUPPORTED) :
          ": "+(this.GetProperty(property) ? CMessage::Text(MSG_LIB_TEXT_YES) : CMessage::Text(MSG_LIB_TEXT_NO))
         )  :
      property==CHART_PROP_CONTEXT_MENU   ?  CMessage::Text(MSG_CHART_OBJ_CONTEXT_MENU)+
         (!this.SupportProperty(property) ?  ": "+CMessage::Text(MSG_LIB_PROP_NOT_SUPPORTED) :
          ": "+(this.GetProperty(property) ? CMessage::Text(MSG_LIB_TEXT_YES) : CMessage::Text(MSG_LIB_TEXT_NO))
         )  :
      property==CHART_PROP_CROSSHAIR_TOOL ?  CMessage::Text(MSG_CHART_OBJ_CROSSHAIR_TOOL)+
         (!this.SupportProperty(property) ?  ": "+CMessage::Text(MSG_LIB_PROP_NOT_SUPPORTED) :
          ": "+(this.GetProperty(property) ? CMessage::Text(MSG_LIB_TEXT_YES) : CMessage::Text(MSG_LIB_TEXT_NO))
         )  :
      property==CHART_PROP_MOUSE_SCROLL   ?  CMessage::Text(MSG_CHART_OBJ_MOUSE_SCROLL)+
         (!this.SupportProperty(property) ?  ": "+CMessage::Text(MSG_LIB_PROP_NOT_SUPPORTED) :
          ": "+(this.GetProperty(property) ? CMessage::Text(MSG_LIB_TEXT_YES) : CMessage::Text(MSG_LIB_TEXT_NO))
         )  :
      property==CHART_PROP_EVENT_MOUSE_WHEEL ?  CMessage::Text(MSG_CHART_OBJ_EVENT_MOUSE_WHEEL)+
         (!this.SupportProperty(property) ?  ": "+CMessage::Text(MSG_LIB_PROP_NOT_SUPPORTED) :
          ": "+(this.GetProperty(property) ? CMessage::Text(MSG_LIB_TEXT_YES) : CMessage::Text(MSG_LIB_TEXT_NO))
         )  :
      property==CHART_PROP_EVENT_MOUSE_MOVE  ?  CMessage::Text(MSG_CHART_OBJ_EVENT_MOUSE_MOVE)+
         (!this.SupportProperty(property) ?  ": "+CMessage::Text(MSG_LIB_PROP_NOT_SUPPORTED) :
          ": "+(this.GetProperty(property) ? CMessage::Text(MSG_LIB_TEXT_YES) : CMessage::Text(MSG_LIB_TEXT_NO))
         )  :
      property==CHART_PROP_EVENT_OBJECT_CREATE  ?  CMessage::Text(MSG_CHART_OBJ_EVENT_OBJECT_CREATE)+
         (!this.SupportProperty(property) ?  ": "+CMessage::Text(MSG_LIB_PROP_NOT_SUPPORTED) :
          ": "+(this.GetProperty(property) ? CMessage::Text(MSG_LIB_TEXT_YES) : CMessage::Text(MSG_LIB_TEXT_NO))
         )  :
      property==CHART_PROP_EVENT_OBJECT_DELETE  ?  CMessage::Text(MSG_CHART_OBJ_EVENT_OBJECT_DELETE)+
         (!this.SupportProperty(property) ?  ": "+CMessage::Text(MSG_LIB_PROP_NOT_SUPPORTED) :
          ": "+(this.GetProperty(property) ? CMessage::Text(MSG_LIB_TEXT_YES) : CMessage::Text(MSG_LIB_TEXT_NO))
         )  :
      property==CHART_PROP_MODE           ?  CMessage::Text(MSG_CHART_OBJ_MODE)+
         (!this.SupportProperty(property) ?  ": "+CMessage::Text(MSG_LIB_PROP_NOT_SUPPORTED) :
          ": "+ChartModeDescription((ENUM_CHART_MODE)this.GetProperty(property))
         )  :
      property==CHART_PROP_FOREGROUND     ?  CMessage::Text(MSG_CHART_OBJ_FOREGROUND)+
         (!this.SupportProperty(property) ?  ": "+CMessage::Text(MSG_LIB_PROP_NOT_SUPPORTED) :
          ": "+(this.GetProperty(property) ? CMessage::Text(MSG_LIB_TEXT_YES) : CMessage::Text(MSG_LIB_TEXT_NO))
         )  :
      property==CHART_PROP_SHIFT        ?  CMessage::Text(MSG_CHART_OBJ_SHIFT)+
         (!this.SupportProperty(property) ?  ": "+CMessage::Text(MSG_LIB_PROP_NOT_SUPPORTED) :
          ": "+(this.GetProperty(property) ? CMessage::Text(MSG_LIB_TEXT_YES) : CMessage::Text(MSG_LIB_TEXT_NO))
         )  :
      property==CHART_PROP_AUTOSCROLL        ?  CMessage::Text(MSG_CHART_OBJ_AUTOSCROLL)+
         (!this.SupportProperty(property) ?  ": "+CMessage::Text(MSG_LIB_PROP_NOT_SUPPORTED) :
          ": "+(this.GetProperty(property) ? CMessage::Text(MSG_LIB_TEXT_YES) : CMessage::Text(MSG_LIB_TEXT_NO))
         )  :
      property==CHART_PROP_KEYBOARD_CONTROL        ?  CMessage::Text(MSG_CHART_OBJ_KEYBOARD_CONTROL)+
         (!this.SupportProperty(property) ?  ": "+CMessage::Text(MSG_LIB_PROP_NOT_SUPPORTED) :
          ": "+(this.GetProperty(property) ? CMessage::Text(MSG_LIB_TEXT_YES) : CMessage::Text(MSG_LIB_TEXT_NO))
         )  :
      property==CHART_PROP_QUICK_NAVIGATION        ?  CMessage::Text(MSG_CHART_OBJ_QUICK_NAVIGATION)+
         (!this.SupportProperty(property) ?  ": "+CMessage::Text(MSG_LIB_PROP_NOT_SUPPORTED) :
          ": "+(this.GetProperty(property) ? CMessage::Text(MSG_LIB_TEXT_YES) : CMessage::Text(MSG_LIB_TEXT_NO))
         )  :
      property==CHART_PROP_SCALE        ?  CMessage::Text(MSG_CHART_OBJ_SCALE)+
         (!this.SupportProperty(property) ?  ": "+CMessage::Text(MSG_LIB_PROP_NOT_SUPPORTED) :
          ": "+(string)this.GetProperty(property)
         )  :
      property==CHART_PROP_SCALEFIX        ?  CMessage::Text(MSG_CHART_OBJ_SCALEFIX)+
         (!this.SupportProperty(property) ?  ": "+CMessage::Text(MSG_LIB_PROP_NOT_SUPPORTED) :
          ": "+(this.GetProperty(property) ? CMessage::Text(MSG_LIB_TEXT_YES) : CMessage::Text(MSG_LIB_TEXT_NO))
         )  :
      property==CHART_PROP_SCALEFIX_11        ?  CMessage::Text(MSG_CHART_OBJ_SCALEFIX_11)+
         (!this.SupportProperty(property) ?  ": "+CMessage::Text(MSG_LIB_PROP_NOT_SUPPORTED) :
          ": "+(this.GetProperty(property) ? CMessage::Text(MSG_LIB_TEXT_YES) : CMessage::Text(MSG_LIB_TEXT_NO))
         )  :
      property==CHART_PROP_SCALE_PT_PER_BAR  ?  CMessage::Text(MSG_CHART_OBJ_SCALE_PT_PER_BAR)+
         (!this.SupportProperty(property) ?  ": "+CMessage::Text(MSG_LIB_PROP_NOT_SUPPORTED) :
          ": "+(this.GetProperty(property) ? CMessage::Text(MSG_LIB_TEXT_YES) : CMessage::Text(MSG_LIB_TEXT_NO))
         )  :
      property==CHART_PROP_SHOW_TICKER        ?  CMessage::Text(MSG_CHART_OBJ_SHOW_TICKER)+
         (!this.SupportProperty(property) ?  ": "+CMessage::Text(MSG_LIB_PROP_NOT_SUPPORTED) :
          ": "+(this.GetProperty(property) ? CMessage::Text(MSG_LIB_TEXT_YES) : CMessage::Text(MSG_LIB_TEXT_NO))
         )  :
      property==CHART_PROP_SHOW_OHLC        ?  CMessage::Text(MSG_CHART_OBJ_SHOW_OHLC)+
         (!this.SupportProperty(property) ?  ": "+CMessage::Text(MSG_LIB_PROP_NOT_SUPPORTED) :
          ": "+(this.GetProperty(property) ? CMessage::Text(MSG_LIB_TEXT_YES) : CMessage::Text(MSG_LIB_TEXT_NO))
         )  :
      property==CHART_PROP_SHOW_BID_LINE  ?  CMessage::Text(MSG_CHART_OBJ_SHOW_BID_LINE)+
         (!this.SupportProperty(property) ?  ": "+CMessage::Text(MSG_LIB_PROP_NOT_SUPPORTED) :
          ": "+(this.GetProperty(property) ? CMessage::Text(MSG_LIB_TEXT_YES) : CMessage::Text(MSG_LIB_TEXT_NO))
         )  :
      property==CHART_PROP_SHOW_ASK_LINE  ?  CMessage::Text(MSG_CHART_OBJ_SHOW_ASK_LINE)+
         (!this.SupportProperty(property) ?  ": "+CMessage::Text(MSG_LIB_PROP_NOT_SUPPORTED) :
          ": "+(this.GetProperty(property) ? CMessage::Text(MSG_LIB_TEXT_YES) : CMessage::Text(MSG_LIB_TEXT_NO))
         )  :
      property==CHART_PROP_SHOW_LAST_LINE ?  CMessage::Text(MSG_CHART_OBJ_SHOW_LAST_LINE)+
         (!this.SupportProperty(property) ?  ": "+CMessage::Text(MSG_LIB_PROP_NOT_SUPPORTED) :
          ": "+(this.GetProperty(property) ? CMessage::Text(MSG_LIB_TEXT_YES) : CMessage::Text(MSG_LIB_TEXT_NO))
         )  :
      property==CHART_PROP_SHOW_PERIOD_SEP   ?  CMessage::Text(MSG_CHART_OBJ_SHOW_PERIOD_SEP)+
         (!this.SupportProperty(property) ?  ": "+CMessage::Text(MSG_LIB_PROP_NOT_SUPPORTED) :
          ": "+(this.GetProperty(property) ? CMessage::Text(MSG_LIB_TEXT_YES) : CMessage::Text(MSG_LIB_TEXT_NO))
         )  :
      property==CHART_PROP_SHOW_GRID        ?  CMessage::Text(MSG_CHART_OBJ_SHOW_GRID)+
         (!this.SupportProperty(property) ?  ": "+CMessage::Text(MSG_LIB_PROP_NOT_SUPPORTED) :
          ": "+(this.GetProperty(property) ? CMessage::Text(MSG_LIB_TEXT_YES) : CMessage::Text(MSG_LIB_TEXT_NO))
         )  :
      property==CHART_PROP_SHOW_VOLUMES   ?  CMessage::Text(MSG_CHART_OBJ_SHOW_VOLUMES)+
         (!this.SupportProperty(property) ?  ": "+CMessage::Text(MSG_LIB_PROP_NOT_SUPPORTED) :
          ": "+ChartModeVolumeDescription((ENUM_CHART_VOLUME_MODE)this.GetProperty(property))
         )  :
      property==CHART_PROP_SHOW_OBJECT_DESCR ?  CMessage::Text(MSG_CHART_OBJ_SHOW_OBJECT_DESCR)+
         (!this.SupportProperty(property) ?  ": "+CMessage::Text(MSG_LIB_PROP_NOT_SUPPORTED) :
          ": "+(this.GetProperty(property) ? CMessage::Text(MSG_LIB_TEXT_YES) : CMessage::Text(MSG_LIB_TEXT_NO))
         )  :
      property==CHART_PROP_VISIBLE_BARS   ?  CMessage::Text(MSG_CHART_OBJ_VISIBLE_BARS)+
         (!this.SupportProperty(property) ?  ": "+CMessage::Text(MSG_LIB_PROP_NOT_SUPPORTED) :
          ": "+(string)this.GetProperty(property)
         )  :
      property==CHART_PROP_WINDOWS_TOTAL  ?  CMessage::Text(MSG_CHART_OBJ_WINDOWS_TOTAL)+
         (!this.SupportProperty(property) ?  ": "+CMessage::Text(MSG_LIB_PROP_NOT_SUPPORTED) :
          ": "+(string)this.GetProperty(property)
         )  :
      property==CHART_PROP_WINDOW_HANDLE  ?  CMessage::Text(MSG_CHART_OBJ_WINDOW_HANDLE)+
         (!this.SupportProperty(property) ?  ": "+CMessage::Text(MSG_LIB_PROP_NOT_SUPPORTED) :
          ": "+(string)this.GetProperty(property)
         )  :
      property==CHART_PROP_FIRST_VISIBLE_BAR ?  CMessage::Text(MSG_CHART_OBJ_FIRST_VISIBLE_BAR)+
         (!this.SupportProperty(property) ?  ": "+CMessage::Text(MSG_LIB_PROP_NOT_SUPPORTED) :
          ": "+(string)this.GetProperty(property)
         )  :
      property==CHART_PROP_WIDTH_IN_BARS  ?  CMessage::Text(MSG_CHART_OBJ_WIDTH_IN_BARS)+
         (!this.SupportProperty(property) ?  ": "+CMessage::Text(MSG_LIB_PROP_NOT_SUPPORTED) :
          ": "+(string)this.GetProperty(property)
         )  :
      property==CHART_PROP_WIDTH_IN_PIXELS   ?  CMessage::Text(MSG_CHART_OBJ_WIDTH_IN_PIXELS)+
         (!this.SupportProperty(property) ?  ": "+CMessage::Text(MSG_LIB_PROP_NOT_SUPPORTED) :
          ": "+(string)this.GetProperty(property)
         )  :
      property==CHART_PROP_COLOR_BACKGROUND        ?  CMessage::Text(MSG_CHART_OBJ_COLOR_BACKGROUND)+
         (!this.SupportProperty(property) ?  ": "+CMessage::Text(MSG_LIB_PROP_NOT_SUPPORTED) :
          ": "+::ColorToString((color)this.GetProperty(property),true)
         )  :
      property==CHART_PROP_COLOR_FOREGROUND  ?  CMessage::Text(MSG_CHART_OBJ_COLOR_FOREGROUND)+
         (!this.SupportProperty(property) ?  ": "+CMessage::Text(MSG_LIB_PROP_NOT_SUPPORTED) :
          ": "+::ColorToString((color)this.GetProperty(property),true)
         )  :
      property==CHART_PROP_COLOR_GRID     ?  CMessage::Text(MSG_CHART_OBJ_COLOR_GRID)+
         (!this.SupportProperty(property) ?  ": "+CMessage::Text(MSG_LIB_PROP_NOT_SUPPORTED) :
          ": "+::ColorToString((color)this.GetProperty(property),true)
         )  :
      property==CHART_PROP_COLOR_VOLUME   ?  CMessage::Text(MSG_CHART_OBJ_COLOR_VOLUME)+
         (!this.SupportProperty(property) ?  ": "+CMessage::Text(MSG_LIB_PROP_NOT_SUPPORTED) :
          ": "+::ColorToString((color)this.GetProperty(property),true)
         )  :
      property==CHART_PROP_COLOR_CHART_UP ?  CMessage::Text(MSG_CHART_OBJ_COLOR_CHART_UP)+
         (!this.SupportProperty(property) ?  ": "+CMessage::Text(MSG_LIB_PROP_NOT_SUPPORTED) :
          ": "+::ColorToString((color)this.GetProperty(property),true)
         )  :
      property==CHART_PROP_COLOR_CHART_DOWN  ?  CMessage::Text(MSG_CHART_OBJ_COLOR_CHART_DOWN)+
         (!this.SupportProperty(property) ?  ": "+CMessage::Text(MSG_LIB_PROP_NOT_SUPPORTED) :
          ": "+::ColorToString((color)this.GetProperty(property),true)
         )  :
      property==CHART_PROP_COLOR_CHART_LINE  ?  CMessage::Text(MSG_CHART_OBJ_COLOR_CHART_LINE)+
         (!this.SupportProperty(property) ?  ": "+CMessage::Text(MSG_LIB_PROP_NOT_SUPPORTED) :
          ": "+::ColorToString((color)this.GetProperty(property),true)
         )  :
      property==CHART_PROP_COLOR_CANDLE_BULL ?  CMessage::Text(MSG_CHART_OBJ_COLOR_CANDLE_BULL)+
         (!this.SupportProperty(property) ?  ": "+CMessage::Text(MSG_LIB_PROP_NOT_SUPPORTED) :
          ": "+::ColorToString((color)this.GetProperty(property),true)
         )  :
      property==CHART_PROP_COLOR_CANDLE_BEAR ?  CMessage::Text(MSG_CHART_OBJ_COLOR_CANDLE_BEAR)+
         (!this.SupportProperty(property) ?  ": "+CMessage::Text(MSG_LIB_PROP_NOT_SUPPORTED) :
          ": "+::ColorToString((color)this.GetProperty(property),true)
         )  :
      property==CHART_PROP_COLOR_BID        ?  CMessage::Text(MSG_CHART_OBJ_COLOR_BID)+
         (!this.SupportProperty(property) ?  ": "+CMessage::Text(MSG_LIB_PROP_NOT_SUPPORTED) :
          ": "+::ColorToString((color)this.GetProperty(property),true)
         )  :
      property==CHART_PROP_COLOR_ASK        ?  CMessage::Text(MSG_CHART_OBJ_COLOR_ASK)+
         (!this.SupportProperty(property) ?  ": "+CMessage::Text(MSG_LIB_PROP_NOT_SUPPORTED) :
          ": "+::ColorToString((color)this.GetProperty(property),true)
         )  :
      property==CHART_PROP_COLOR_LAST        ?  CMessage::Text(MSG_CHART_OBJ_COLOR_LAST)+
         (!this.SupportProperty(property) ?  ": "+CMessage::Text(MSG_LIB_PROP_NOT_SUPPORTED) :
          ": "+::ColorToString((color)this.GetProperty(property),true)
         )  :
      property==CHART_PROP_COLOR_STOP_LEVEL  ?  CMessage::Text(MSG_CHART_OBJ_COLOR_STOP_LEVEL)+
         (!this.SupportProperty(property) ?  ": "+CMessage::Text(MSG_LIB_PROP_NOT_SUPPORTED) :
          ": "+::ColorToString((color)this.GetProperty(property),true)
         )  :
      property==CHART_PROP_SHOW_TRADE_LEVELS ?  CMessage::Text(MSG_CHART_OBJ_SHOW_TRADE_LEVELS)+
         (!this.SupportProperty(property) ?  ": "+CMessage::Text(MSG_LIB_PROP_NOT_SUPPORTED) :
          ": "+(this.GetProperty(property) ? CMessage::Text(MSG_LIB_TEXT_YES) : CMessage::Text(MSG_LIB_TEXT_NO))
         )  :
      property==CHART_PROP_DRAG_TRADE_LEVELS ?  CMessage::Text(MSG_CHART_OBJ_DRAG_TRADE_LEVELS)+
         (!this.SupportProperty(property) ?  ": "+CMessage::Text(MSG_LIB_PROP_NOT_SUPPORTED) :
          ": "+(this.GetProperty(property) ? CMessage::Text(MSG_LIB_TEXT_YES) : CMessage::Text(MSG_LIB_TEXT_NO))
         )  :
      property==CHART_PROP_SHOW_DATE_SCALE   ?  CMessage::Text(MSG_CHART_OBJ_SHOW_DATE_SCALE)+
         (!this.SupportProperty(property) ?  ": "+CMessage::Text(MSG_LIB_PROP_NOT_SUPPORTED) :
          ": "+(this.GetProperty(property) ? CMessage::Text(MSG_LIB_TEXT_YES) : CMessage::Text(MSG_LIB_TEXT_NO))
         )  :
      property==CHART_PROP_SHOW_PRICE_SCALE  ?  CMessage::Text(MSG_CHART_OBJ_SHOW_PRICE_SCALE)+
         (!this.SupportProperty(property) ?  ": "+CMessage::Text(MSG_LIB_PROP_NOT_SUPPORTED) :
          ": "+(this.GetProperty(property) ? CMessage::Text(MSG_LIB_TEXT_YES) : CMessage::Text(MSG_LIB_TEXT_NO))
         )  :
      property==CHART_PROP_SHOW_ONE_CLICK ?  CMessage::Text(MSG_CHART_OBJ_SHOW_ONE_CLICK)+
         (!this.SupportProperty(property) ?  ": "+CMessage::Text(MSG_LIB_PROP_NOT_SUPPORTED) :
          ": "+(this.GetProperty(property) ? CMessage::Text(MSG_LIB_TEXT_YES) : CMessage::Text(MSG_LIB_TEXT_NO))
         )  :
      property==CHART_PROP_IS_MAXIMIZED   ?  CMessage::Text(MSG_CHART_OBJ_IS_MAXIMIZED)+
         (!this.SupportProperty(property) ?  ": "+CMessage::Text(MSG_LIB_PROP_NOT_SUPPORTED) :
          ": "+(this.GetProperty(property) ? CMessage::Text(MSG_LIB_TEXT_YES) : CMessage::Text(MSG_LIB_TEXT_NO))
         )  :
      property==CHART_PROP_IS_MINIMIZED   ?  CMessage::Text(MSG_CHART_OBJ_IS_MINIMIZED)+
         (!this.SupportProperty(property) ?  ": "+CMessage::Text(MSG_LIB_PROP_NOT_SUPPORTED) :
          ": "+(this.GetProperty(property) ? CMessage::Text(MSG_LIB_TEXT_YES) : CMessage::Text(MSG_LIB_TEXT_NO))
         )  :
      property==CHART_PROP_IS_DOCKED      ?  CMessage::Text(MSG_CHART_OBJ_IS_DOCKED)+
         (!this.SupportProperty(property) ?  ": "+CMessage::Text(MSG_LIB_PROP_NOT_SUPPORTED) :
          ": "+(this.GetProperty(property) ? CMessage::Text(MSG_LIB_TEXT_YES) : CMessage::Text(MSG_LIB_TEXT_NO))
         )  :
      property==CHART_PROP_FLOAT_LEFT     ?  CMessage::Text(MSG_CHART_OBJ_FLOAT_LEFT)+
         (!this.SupportProperty(property) ?  ": "+CMessage::Text(MSG_LIB_PROP_NOT_SUPPORTED) :
          ": "+(string)this.GetProperty(property)
         )  :
      property==CHART_PROP_FLOAT_TOP      ?  CMessage::Text(MSG_CHART_OBJ_FLOAT_TOP)+
         (!this.SupportProperty(property) ?  ": "+CMessage::Text(MSG_LIB_PROP_NOT_SUPPORTED) :
          ": "+(string)this.GetProperty(property)
         )  :
      property==CHART_PROP_FLOAT_RIGHT    ?  CMessage::Text(MSG_CHART_OBJ_FLOAT_RIGHT)+
         (!this.SupportProperty(property) ?  ": "+CMessage::Text(MSG_LIB_PROP_NOT_SUPPORTED) :
          ": "+(string)this.GetProperty(property)
         )  :
      property==CHART_PROP_FLOAT_BOTTOM   ?  CMessage::Text(MSG_CHART_OBJ_FLOAT_BOTTOM)+
         (!this.SupportProperty(property) ?  ": "+CMessage::Text(MSG_LIB_PROP_NOT_SUPPORTED) :
          ": "+(string)this.GetProperty(property)
         )  :
      ""
     );
  }
//+------------------------------------------------------------------+
//| Return description of object's real property                     |
//+------------------------------------------------------------------+
string CChartObj::GetPropertyDescription(ENUM_CHART_PROP_DOUBLE property)
  {
   return
     (
      property==CHART_PROP_SHIFT_SIZE        ?  CMessage::Text(MSG_CHART_OBJ_SHIFT_SIZE)+
         (!this.SupportProperty(property)    ?  ": "+CMessage::Text(MSG_LIB_PROP_NOT_SUPPORTED) :
          ": "+::DoubleToString(this.GetProperty(property),2)
         )  :
      property==CHART_PROP_FIXED_POSITION    ?  CMessage::Text(MSG_CHART_OBJ_FIXED_POSITION)+
         (!this.SupportProperty(property)    ?  ": "+CMessage::Text(MSG_LIB_PROP_NOT_SUPPORTED) :
          ": "+::DoubleToString(this.GetProperty(property),2)
         )  :
      property==CHART_PROP_FIXED_MAX         ?  CMessage::Text(MSG_CHART_OBJ_FIXED_MAX)+
         (!this.SupportProperty(property)    ?  ": "+CMessage::Text(MSG_LIB_PROP_NOT_SUPPORTED) :
          ": "+::DoubleToString(this.GetProperty(property),this.m_digits)
         )  :
      property==CHART_PROP_FIXED_MIN         ?  CMessage::Text(MSG_CHART_OBJ_FIXED_MIN)+
         (!this.SupportProperty(property)    ?  ": "+CMessage::Text(MSG_LIB_PROP_NOT_SUPPORTED) :
          ": "+::DoubleToString(this.GetProperty(property),this.m_digits)
         )  :
      property==CHART_PROP_POINTS_PER_BAR    ?  CMessage::Text(MSG_CHART_OBJ_POINTS_PER_BAR)+
         (!this.SupportProperty(property)    ?  ": "+CMessage::Text(MSG_LIB_PROP_NOT_SUPPORTED) :
          ": "+::DoubleToString(this.GetProperty(property),2)
         )  :
      property==CHART_PROP_PRICE_MIN         ?  CMessage::Text(MSG_CHART_OBJ_PRICE_MIN)+
         (!this.SupportProperty(property)    ?  ": "+CMessage::Text(MSG_LIB_PROP_NOT_SUPPORTED) :
          ": "+::DoubleToString(this.GetProperty(property),this.m_digits)
         )  :
      property==CHART_PROP_PRICE_MAX         ?  CMessage::Text(MSG_CHART_OBJ_PRICE_MAX)+
         (!this.SupportProperty(property)    ?  ": "+CMessage::Text(MSG_LIB_PROP_NOT_SUPPORTED) :
          ": "+::DoubleToString(this.GetProperty(property),this.m_digits)
         )  :
      ""
     );
  }
//+------------------------------------------------------------------+
//| Return description of object's string property                   |
//+------------------------------------------------------------------+
string CChartObj::GetPropertyDescription(ENUM_CHART_PROP_STRING property)
  {
   return
     (
      property==CHART_PROP_COMMENT     ?  CMessage::Text(MSG_CHART_OBJ_COMMENT)+": \""+this.GetProperty(property)+"\""     :
      property==CHART_PROP_EXPERT_NAME ?  CMessage::Text(MSG_CHART_OBJ_EXPERT_NAME)+": \""+this.GetProperty(property)+"\"" :
      property==CHART_PROP_SCRIPT_NAME ?  CMessage::Text(MSG_CHART_OBJ_SCRIPT_NAME)+": \""+this.GetProperty(property)+"\"" :
      property==CHART_PROP_SYMBOL      ?  CMessage::Text(MSG_LIB_PROP_SYMBOL)+": \""+this.GetProperty(property)+"\""       :
      ""
     );
  }
//+------------------------------------------------------------------+
Eine an die Methode übergebene Eigenschaft wird geprüft und die Zeichenkette mit der entsprechenden Eigenschaftsbeschreibung wird zurückgegeben.
Die Methode, die die vollständige Beschreibung der Objekteigenschaften anzeigt:
//+------------------------------------------------------------------+
//| Display object properties in the journal                         |
//+------------------------------------------------------------------+
void CChartObj::Print(const bool full_prop=false)
  {
   ::Print("============= ",CMessage::Text(MSG_LIB_PARAMS_LIST_BEG)," (",this.Header(),") =============");
   int beg=0, end=CHART_PROP_INTEGER_TOTAL;
   for(int i=beg; i<end; i++)
     {
      ENUM_CHART_PROP_INTEGER prop=(ENUM_CHART_PROP_INTEGER)i;
      if(!full_prop && !this.SupportProperty(prop)) continue;
      ::Print(this.GetPropertyDescription(prop));
     }
   ::Print("------");
   beg=end; end+=CHART_PROP_DOUBLE_TOTAL;
   for(int i=beg; i<end; i++)
     {
      ENUM_CHART_PROP_DOUBLE prop=(ENUM_CHART_PROP_DOUBLE)i;
      if(!full_prop && !this.SupportProperty(prop)) continue;
      ::Print(this.GetPropertyDescription(prop));
     }
   ::Print("------");
   beg=end; end+=CHART_PROP_STRING_TOTAL;
   for(int i=beg; i<end; i++)
     {
      ENUM_CHART_PROP_STRING prop=(ENUM_CHART_PROP_STRING)i;
      if(!full_prop && !this.SupportProperty(prop)) continue;
      ::Print(this.GetPropertyDescription(prop));
     }
   ::Print("============= ",CMessage::Text(MSG_LIB_PARAMS_LIST_END)," (",this.Header(),") =============\n");
  }
//+------------------------------------------------------------------+
Wir erhalten in den drei Schleifen über alle Objekteigenschaften die Beschreibung jeder nachfolgenden Eigenschaft und drucken diese in das Journal aus.
Die Methode zeigt die kurze Objektbeschreibung im Journal an:
//+------------------------------------------------------------------+
//| Display a short description of the object in the journal         |
//+------------------------------------------------------------------+
void CChartObj::PrintShort(const bool dash=false)
  {
   ::Print((dash ? "- " : ""),this.Header()," ID: ",(string)this.ID(),", HWND: ",(string)this.Handle());
  }
//+------------------------------------------------------------------+
Die Methode empfängt das Flag, das die Notwendigkeit anzeigt, einen Bindestrich vor einer Objektbeschreibung anzuzeigen. Der Bindestrich wird in der Objektklasse der Charts-Kollektion benötigt, um eine Kurzbeschreibung der gesamten Kollektion anzuzeigen. Standardmäßig ist kein Bindestrich vorhanden. Die Methode erstellt die Zeichenkette mit der Objektbeschreibung und einigen ihrer zusätzlichen Eigenschaften — Chart-ID und dem Handle des Fensters.
Die Methode gibt einen kurzen Objektnamen zurück:
//+------------------------------------------------------------------+
//| Return the object short name                                     |
//+------------------------------------------------------------------+
string CChartObj::Header(void)
  {
   return(CMessage::Text(MSG_CHART_OBJ_CHART_WINDOW)+" "+this.Symbol()+" "+TimeframeDescription(this.Timeframe()));
  }
//+------------------------------------------------------------------+
In der Methode wird ein String erzeugt, der aus einem Header und den Namen eines Chart-Symbols und eines Zeitrahmens besteht.
Alle diese Methoden sind Standard für Bibliotheksobjekte und bilden die Grundlage jedes Objekts. Für die komfortable Nutzung dieser Methoden füge ich in der Regel Methoden für den schnellen Zugriff auf die Objekteigenschaften hinzu. Da das Chartobjekt über viele verschiedene Eigenschaften verfügt, werde ich mehrere Methoden haben.
Im Grunde sind alle seine Eigenschaften Flags, die den Status eines Chart-Parameters anzeigen. Sie können aktiviert oder deaktiviert werden, d. h. es gibt nur zwei Zustände. Das heißt, wir brauchen die Methoden zum Setzen der Flags solcher Objekteigenschaften. Dies werden private Methoden sein. Die Methoden zum Aktivieren und Deaktivieren einer Eigenschaft werden öffentlich gemacht. Das macht sie bequemer in der Anwendung.
Wir deklarieren im privaten Teil der Klasse die Methoden zum Setzen der Flags einiger Objekteigenschaften, die Methoden zum Setzen der Eigenschaften mit einer begrenzten Anzahl von Werten (3 und 6), sowie die Methoden zum Setzen nur der Chart-Objekteigenschaften — für schreibgeschützte Chart-Parameter — um einen Wert eines entsprechenden Chart-Parameters auf die Chart-Objekteigenschaft setzen zu können:
//+------------------------------------------------------------------+
//|                                                     ChartObj.mqh |
//|                                  Copyright 2021, MetaQuotes Ltd. |
//|                             https://mql5.com/en/users/artmedia70 |
//+------------------------------------------------------------------+
#property copyright "Copyright 2021, MetaQuotes Ltd."
#property link      "https://mql5.com/en/users/artmedia70"
#property version   "1.00"
#property strict    // Necessary for mql4
//+------------------------------------------------------------------+
//| Include files                                                    |
//+------------------------------------------------------------------+
#include "..\..\Objects\BaseObj.mqh"
//+------------------------------------------------------------------+
//| Chart object class                                               |
//+------------------------------------------------------------------+
class CChartObj : public CBaseObj
  {
private:
   long              m_long_prop[CHART_PROP_INTEGER_TOTAL];       // Integer properties
   double            m_double_prop[CHART_PROP_DOUBLE_TOTAL];      // Real properties
   string            m_string_prop[CHART_PROP_STRING_TOTAL];      // String properties
   int               m_digits;                                    // Symbol's Digits()

//--- Return the index of the array the (1) double and (2) string properties are actually located at
   int               IndexProp(ENUM_CHART_PROP_DOUBLE property)   const { return(int)property-CHART_PROP_INTEGER_TOTAL;                         }
   int               IndexProp(ENUM_CHART_PROP_STRING property)   const { return(int)property-CHART_PROP_INTEGER_TOTAL-CHART_PROP_DOUBLE_TOTAL; }

//--- The methods of setting parameter flags
   bool              SetShowFlag(const string source,const bool flag,const bool redraw=false);
   bool              SetBringToTopFlag(const string source,const bool flag,const bool redraw=false);
   bool              SetContextMenuFlag(const string source,const bool flag,const bool redraw=false);
   bool              SetCrosshairToolFlag(const string source,const bool flag,const bool redraw=false);
   bool              SetMouseScrollFlag(const string source,const bool flag,const bool redraw=false);
   bool              SetEventMouseWhellFlag(const string source,const bool flag,const bool redraw=false);
   bool              SetEventMouseMoveFlag(const string source,const bool flag,const bool redraw=false);
   bool              SetEventObjectCreateFlag(const string source,const bool flag,const bool redraw=false);
   bool              SetEventObjectDeleteFlag(const string source,const bool flag,const bool redraw=false);
   bool              SetForegroundFlag(const string source,const bool flag,const bool redraw=false);
   bool              SetShiftFlag(const string source,const bool flag,const bool redraw=false);
   bool              SetAutoscrollFlag(const string source,const bool flag,const bool redraw=false);
   bool              SetKeyboardControlFlag(const string source,const bool flag,const bool redraw=false);
   bool              SetQuickNavigationFlag(const string source,const bool flag,const bool redraw=false);
   bool              SetScaleFixFlag(const string source,const bool flag,const bool redraw=false);
   bool              SetScaleFix11Flag(const string source,const bool flag,const bool redraw=false);
   bool              SetScalePTPerBarFlag(const string source,const bool flag,const bool redraw=false);
   bool              SetShowTickerFlag(const string source,const bool flag,const bool redraw=false);
   bool              SetShowOHLCFlag(const string source,const bool flag,const bool redraw=false);
   bool              SetShowBidLineFlag(const string source,const bool flag,const bool redraw=false);
   bool              SetShowAskLineFlag(const string source,const bool flag,const bool redraw=false);
   bool              SetShowLastLineFlag(const string source,const bool flag,const bool redraw=false);
   bool              SetShowPeriodSeparatorsFlag(const string source,const bool flag,const bool redraw=false);
   bool              SetShowGridFlag(const string source,const bool flag,const bool redraw=false);
   bool              SetShowObjectDescriptionsFlag(const string source,const bool flag,const bool redraw=false);
   bool              SetShowTradeLevelsFlag(const string source,const bool flag,const bool redraw=false);
   bool              SetDragTradeLevelsFlag(const string source,const bool flag,const bool redraw=false);
   bool              SetShowDateScaleFlag(const string source,const bool flag,const bool redraw=false);
   bool              SetShowPriceScaleFlag(const string source,const bool flag,const bool redraw=false);
   bool              SetShowOneClickPanelFlag(const string source,const bool flag,const bool redraw=false);
   bool              SetDockedFlag(const string source,const bool flag,const bool redraw=false);

//--- The methods of setting property values
   bool              SetMode(const string source,const ENUM_CHART_MODE mode,const bool redraw=false);
   bool              SetScale(const string source,const int scale,const bool redraw=false);
   bool              SetModeVolume(const string source,const ENUM_CHART_VOLUME_MODE mode,const bool redraw=false);
   void              SetVisibleBars(void);
   void              SetWindowsTotal(void);
   void              SetFirstVisibleBars(void);
   void              SetWidthInBars(void);
   void              SetWidthInPixels(void);
   void              SetMaximizedFlag(void);
   void              SetMinimizedFlag(void);
   void              SetExpertName(void);
   void              SetScriptName(void);

public:
Implementieren wir die deklarierten privaten Methoden außerhalb des Hauptteils der Klasse.
Die Methoden zum Setzen von Flags sind identisch zueinander.
Betrachten wir daher die Logik mit der Methode zum Setzen des Flags zum Zeichnen eines Kurs-Charts:
//+------------------------------------------------------------------+
//| Set the flag of drawing the price chart                          |
//+------------------------------------------------------------------+
bool CChartObj::SetShowFlag(const string source,const bool flag,const bool redraw=false)
  {
   ::ResetLastError();
   if(!::ChartSetInteger(this.ID(),CHART_SHOW,flag))
     {
      CMessage::ToLog(source,::GetLastError(),true);
      return false;
     }
   this.SetProperty(CHART_PROP_SHOW,flag);
   if(redraw)
      ::ChartRedraw(this.ID());
   return true;
  }
//+------------------------------------------------------------------+
Die Methode empfängt die Quelle (Quelle) — Name der Methode, aus der die private Methode aufgerufen wurde, den Flag-Wert (Flag), der in den Chart-Parametern und der Chart-Objekt-Eigenschaft gesetzt werden soll, sowie das Flag, das die Notwendigkeit anzeigt, das Chart neu zu zeichnen (Redraw).
Die Funktionen zur Arbeit mit ChartSet*-Charts sind asynchron. Das bedeutet, dass sie nur das Ergebnis der Platzierung des Befehls in der Chart-Ereignis-Warteschlange zurückgeben und nicht das Ergebnis der Änderung des Parameters selbst. Normalerweise erscheint das Ergebnis der Funktionsoperation nach einem bestimmten Chart-Ereignis — Änderung der Größe, Ankunft eines neuen Ticks, Aktualisierung des Charts, usw. Um die Parameteränderung sofort anzuzeigen, müssen wir den Chart zwangsweise aktualisieren. Dies geschieht mit der Funktion ChartRedraw().
In der Regel betrifft die Änderung jedoch mehrere Chart-Parameter auf einmal, d. h. meist handelt es sich um eine Batch-Änderung. In diesem Fall sollten wir zuerst alle Ereignisse von Änderungen in allen notwendigen Chart-Parametern senden und danach den erzwungenen Chart-Redraw aufrufen, um zu vermeiden, dass der Chart nach jedem Befehl zur Parameteränderung neu gezeichnet wird. Dazu wird das Flag Redraw verwendet. Standardmäßig ist es auf false gesetzt.
Das erste, was wir hier tun, ist einen Befehl zur Änderung der Chart-Parameter zu senden. Wenn das Ereignis nicht in die Warteschlange gesetzt wird, wird ein Fehler gemeldet und false zurückgegeben.
Wenn das Ereignis erfolgreich in die Warteschlange gesetzt wurde, ändern wir die Eigenschaft des Chartobjekts. Wenn das Flag für das Neuzeichnen aktiviert ist, wird das Chart zwangsweise neu gezeichnet. Zurückgegeben wird true — die Methodenoperation war erfolgreich.
Die Implementierung der übrigen privaten Methoden zum Setzen der Flags ist identisch mit der betrachteten. Lassen Sie uns ihre vollständige Auflistung bereitstellen:
//+------------------------------------------------------------------+
//| Set the chart flag above all others                              |
//+------------------------------------------------------------------+
bool CChartObj::SetBringToTopFlag(const string source,const bool flag,const bool redraw=false)
  {
   ::ResetLastError();
   if(!::ChartSetInteger(this.ID(),CHART_BRING_TO_TOP,flag))
     {
      CMessage::ToLog(source,::GetLastError(),true);
      return false;
     }
   this.SetProperty(CHART_PROP_BRING_TO_TOP,flag);
   if(redraw)
      ::ChartRedraw(this.ID());
   return true;
  }
//+------------------------------------------------------------------+
//| Set the flag of accessing the context menu                       |
//| upon pressing the right mouse button                             |
//+------------------------------------------------------------------+
bool CChartObj::SetContextMenuFlag(const string source,const bool flag,const bool redraw=false)
  {
   ::ResetLastError();
   if(!::ChartSetInteger(this.ID(),CHART_CONTEXT_MENU,flag))
     {
      CMessage::ToLog(source,::GetLastError(),true);
      return false;
     }
   this.SetProperty(CHART_PROP_CONTEXT_MENU,flag);
   if(redraw)
      ::ChartRedraw(this.ID());
   return true;
  }
//+------------------------------------------------------------------+
//| Set the flag of accessing the Crosshair                          |
//| upon pressing the middle mouse button                            |
//+------------------------------------------------------------------+
bool CChartObj::SetCrosshairToolFlag(const string source,const bool flag,const bool redraw=false)
  {
   ::ResetLastError();
   if(!::ChartSetInteger(this.ID(),CHART_CROSSHAIR_TOOL,flag))
     {
      CMessage::ToLog(source,::GetLastError(),true);
      return false;
     }
   this.SetProperty(CHART_PROP_CROSSHAIR_TOOL,flag);
   if(redraw)
      ::ChartRedraw(this.ID());
   return true;
  }
//+------------------------------------------------------------------+
//| Set the chart scroll flag                                        |
//| horizontally using the left mouse button                         |
//+------------------------------------------------------------------+
bool CChartObj::SetMouseScrollFlag(const string source,const bool flag,const bool redraw=false)
  {
   ::ResetLastError();
   if(!::ChartSetInteger(this.ID(),CHART_MOUSE_SCROLL,flag))
     {
      CMessage::ToLog(source,::GetLastError(),true);
      return false;
     }
   this.SetProperty(CHART_PROP_MOUSE_SCROLL,flag);
   if(redraw)
      ::ChartRedraw(this.ID());
   return true;
  }
//+------------------------------------------------------------------+
//| Set the flag of sending mouse wheel event messages               |
//| to all MQL5 programs on the chart                                |
//+------------------------------------------------------------------+
bool CChartObj::SetEventMouseWhellFlag(const string source,const bool flag,const bool redraw=false)
  {
   ::ResetLastError();
   if(!::ChartSetInteger(this.ID(),CHART_EVENT_MOUSE_WHEEL,flag))
     {
      CMessage::ToLog(source,::GetLastError(),true);
      return false;
     }
   this.SetProperty(CHART_PROP_EVENT_MOUSE_WHEEL,flag);
   if(redraw)
      ::ChartRedraw(this.ID());
   return true;
  }
//+----------------------------------------------------------------------+
//| Set the flag of sending mouse button movement and pressing messages  |
//| to all MQL5 programs on the chart                                    |
//+----------------------------------------------------------------------+
bool CChartObj::SetEventMouseMoveFlag(const string source,const bool flag,const bool redraw=false)
  {
   ::ResetLastError();
   if(!::ChartSetInteger(this.ID(),CHART_EVENT_MOUSE_MOVE,flag))
     {
      CMessage::ToLog(source,::GetLastError(),true);
      return false;
     }
   this.SetProperty(CHART_PROP_EVENT_MOUSE_MOVE,flag);
   if(redraw)
      ::ChartRedraw(this.ID());
   return true;
  }
//+------------------------------------------------------------------+
//| Set the flag of sending graphical object creation event messages |
//| to all MQL5 programs on the chart                                |
//+------------------------------------------------------------------+
bool CChartObj::SetEventObjectCreateFlag(const string source,const bool flag,const bool redraw=false)
  {
   ::ResetLastError();
   if(!::ChartSetInteger(this.ID(),CHART_EVENT_OBJECT_CREATE,flag))
     {
      CMessage::ToLog(source,::GetLastError(),true);
      return false;
     }
   this.SetProperty(CHART_PROP_EVENT_OBJECT_CREATE,flag);
   if(redraw)
      ::ChartRedraw(this.ID());
   return true;
  }
//+----------------------------------------------------------------------+
//| Set the flag of sending graphical object destruction event messages  |
//| to all MQL5 programs on the chart                                    |
//+----------------------------------------------------------------------+
bool CChartObj::SetEventObjectDeleteFlag(const string source,const bool flag,const bool redraw=false)
  {
   ::ResetLastError();
   if(!::ChartSetInteger(this.ID(),CHART_EVENT_OBJECT_DELETE,flag))
     {
      CMessage::ToLog(source,::GetLastError(),true);
      return false;
     }
   this.SetProperty(CHART_PROP_EVENT_OBJECT_DELETE,flag);
   if(redraw)
      ::ChartRedraw(this.ID());
   return true;
  }
//+------------------------------------------------------------------+
//| Set the price chart flag in the foreground                       |
//+------------------------------------------------------------------+
bool CChartObj::SetForegroundFlag(const string source,const bool flag,const bool redraw=false)
  {
   ::ResetLastError();
   if(!::ChartSetInteger(this.ID(),CHART_FOREGROUND,flag))
     {
      CMessage::ToLog(source,::GetLastError(),true);
      return false;
     }
   this.SetProperty(CHART_PROP_FOREGROUND,flag);
   if(redraw)
      ::ChartRedraw(this.ID());
   return true;
  }
//+------------------------------------------------------------------+
//| Set the flag of the price chart shift from the right border      |
//+------------------------------------------------------------------+
bool CChartObj::SetShiftFlag(const string source,const bool flag,const bool redraw=false)
  {
   ::ResetLastError();
   if(!::ChartSetInteger(this.ID(),CHART_SHIFT,flag))
     {
      CMessage::ToLog(source,::GetLastError(),true);
      return false;
     }
   this.SetProperty(CHART_PROP_SHIFT,flag);
   if(redraw)
      ::ChartRedraw(this.ID());
   return true;
  }
//+------------------------------------------------------------------+
//|Set the flag for automatically moving to the right chart border   |
//+------------------------------------------------------------------+
bool CChartObj::SetAutoscrollFlag(const string source,const bool flag,const bool redraw=false)
  {
   ::ResetLastError();
   if(!::ChartSetInteger(this.ID(),CHART_AUTOSCROLL,flag))
     {
      CMessage::ToLog(source,::GetLastError(),true);
      return false;
     }
   this.SetProperty(CHART_PROP_AUTOSCROLL,flag);
   if(redraw)
      ::ChartRedraw(this.ID());
   return true;
  }
//+------------------------------------------------------------------+
//| Set the flag of managing the chart using a keyboard              |
//+------------------------------------------------------------------+
bool CChartObj::SetKeyboardControlFlag(const string source,const bool flag,const bool redraw=false)
  {
   ::ResetLastError();
   if(!::ChartSetInteger(this.ID(),CHART_KEYBOARD_CONTROL,flag))
     {
      CMessage::ToLog(source,::GetLastError(),true);
      return false;
     }
   this.SetProperty(CHART_PROP_KEYBOARD_CONTROL,flag);
   if(redraw)
      ::ChartRedraw(this.ID());
   return true;
  }
//+---------------------------------------------------------------------+
//| Set the flag of intercepting Space and Enter keystrokes by the chart|
//| to activate the fast navigation bar                                 |
//+---------------------------------------------------------------------+
bool CChartObj::SetQuickNavigationFlag(const string source,const bool flag,const bool redraw=false)
  {
   ::ResetLastError();
   if(!::ChartSetInteger(this.ID(),CHART_QUICK_NAVIGATION,flag))
     {
      CMessage::ToLog(source,::GetLastError(),true);
      return false;
     }
   this.SetProperty(CHART_PROP_QUICK_NAVIGATION,flag);
   if(redraw)
      ::ChartRedraw(this.ID());
   return true;
  }
//+------------------------------------------------------------------+
//| Set the fixed scale flag                                         |
//+------------------------------------------------------------------+
bool CChartObj::SetScaleFixFlag(const string source,const bool flag,const bool redraw=false)
  {
   ::ResetLastError();
   if(!::ChartSetInteger(this.ID(),CHART_SCALEFIX,flag))
     {
      CMessage::ToLog(source,::GetLastError(),true);
      return false;
     }
   this.SetProperty(CHART_PROP_SCALEFIX,flag);
   if(redraw)
      ::ChartRedraw(this.ID());
   return true;
  }
//+------------------------------------------------------------------+
//| Set the 1:1 scale flag                                           |
//+------------------------------------------------------------------+
bool CChartObj::SetScaleFix11Flag(const string source,const bool flag,const bool redraw=false)
  {
   ::ResetLastError();
   if(!::ChartSetInteger(this.ID(),CHART_SCALEFIX_11,flag))
     {
      CMessage::ToLog(source,::GetLastError(),true);
      return false;
     }
   this.SetProperty(CHART_PROP_SCALEFIX_11,flag);
   if(redraw)
      ::ChartRedraw(this.ID());
   return true;
  }
//+------------------------------------------------------------------+
//| Set the flag of specifying a scale in points per bar             |
//+------------------------------------------------------------------+
bool CChartObj::SetScalePTPerBarFlag(const string source,const bool flag,const bool redraw=false)
  {
   ::ResetLastError();
   if(!::ChartSetInteger(this.ID(),CHART_SCALE_PT_PER_BAR,flag))
     {
      CMessage::ToLog(source,::GetLastError(),true);
      return false;
     }
   this.SetProperty(CHART_PROP_SCALE_PT_PER_BAR,flag);
   if(redraw)
      ::ChartRedraw(this.ID());
   return true;
  }
//+------------------------------------------------------------------+
//|Set the flag displaying a symbol ticker in the upper left corner  |
//+------------------------------------------------------------------+
bool CChartObj::SetShowTickerFlag(const string source,const bool flag,const bool redraw=false)
  {
   ::ResetLastError();
   if(!::ChartSetInteger(this.ID(),CHART_SHOW_TICKER,flag))
     {
      CMessage::ToLog(source,::GetLastError(),true);
      return false;
     }
   this.SetProperty(CHART_PROP_SHOW_TICKER,flag);
   if(redraw)
      ::ChartRedraw(this.ID());
   return true;
  }
//+------------------------------------------------------------------+
//|Set the flag displaying OHLC values in the upper left corner      |
//+------------------------------------------------------------------+
bool CChartObj::SetShowOHLCFlag(const string source,const bool flag,const bool redraw=false)
  {
   ::ResetLastError();
   if(!::ChartSetInteger(this.ID(),CHART_SHOW_OHLC,flag))
     {
      CMessage::ToLog(source,::GetLastError(),true);
      return false;
     }
   this.SetProperty(CHART_PROP_SHOW_OHLC,flag);
   if(redraw)
      ::ChartRedraw(this.ID());
   return true;
  }
//+------------------------------------------------------------------+
//| Set the flag of displaying the Bid value                         |
//| using a horizontal line on the chart                             |
//+------------------------------------------------------------------+
bool CChartObj::SetShowBidLineFlag(const string source,const bool flag,const bool redraw=false)
  {
   ::ResetLastError();
   if(!::ChartSetInteger(this.ID(),CHART_SHOW_BID_LINE,flag))
     {
      CMessage::ToLog(source,::GetLastError(),true);
      return false;
     }
   this.SetProperty(CHART_PROP_SHOW_BID_LINE,flag);
   if(redraw)
      ::ChartRedraw(this.ID());
   return true;
  }
//+------------------------------------------------------------------+
//| Set the flag of displaying the Ask value                         |
//| using a horizontal line on the chart                             |
//+------------------------------------------------------------------+
bool CChartObj::SetShowAskLineFlag(const string source,const bool flag,const bool redraw=false)
  {
   ::ResetLastError();
   if(!::ChartSetInteger(this.ID(),CHART_SHOW_ASK_LINE,flag))
     {
      CMessage::ToLog(source,::GetLastError(),flag);
      return false;
     }
   this.SetProperty(CHART_PROP_SHOW_ASK_LINE,flag);
   if(redraw)
      ::ChartRedraw(this.ID());
   return true;
  }
//+------------------------------------------------------------------+
//| Set the flag of displaying the Last value                        |
//| using a horizontal line on the chart                             |
//+------------------------------------------------------------------+
bool CChartObj::SetShowLastLineFlag(const string source,const bool flag,const bool redraw=false)
  {
   ::ResetLastError();
   if(!::ChartSetInteger(this.ID(),CHART_SHOW_LAST_LINE,flag))
     {
      CMessage::ToLog(source,::GetLastError(),true);
      return false;
     }
   this.SetProperty(CHART_PROP_SHOW_LAST_LINE,flag);
   if(redraw)
      ::ChartRedraw(this.ID());
   return true;
  }
//+------------------------------------------------------------------+
//| Set the flag of displaying vertical separators                   |
//| between adjacent periods                                         |
//+------------------------------------------------------------------+
bool CChartObj::SetShowPeriodSeparatorsFlag(const string source,const bool flag,const bool redraw=false)
  {
   ::ResetLastError();
   if(!::ChartSetInteger(this.ID(),CHART_SHOW_PERIOD_SEP,flag))
     {
      CMessage::ToLog(source,::GetLastError(),true);
      return false;
     }
   this.SetProperty(CHART_PROP_SHOW_PERIOD_SEP,flag);
   if(redraw)
      ::ChartRedraw(this.ID());
   return true;
  }
//+------------------------------------------------------------------+
//| Set the flag of displaying a grid on the chart                   |
//+------------------------------------------------------------------+
bool CChartObj::SetShowGridFlag(const string source,const bool flag,const bool redraw=false)
  {
   ::ResetLastError();
   if(!::ChartSetInteger(this.ID(),CHART_SHOW_GRID,flag))
     {
      CMessage::ToLog(source,::GetLastError(),true);
      return false;
     }
   this.SetProperty(CHART_PROP_SHOW_GRID,flag);
   if(redraw)
      ::ChartRedraw(this.ID());
   return true;
  }
//+------------------------------------------------------------------+
//| Set the flag of displaying object text descriptions              |
//+------------------------------------------------------------------+
bool CChartObj::SetShowObjectDescriptionsFlag(const string source,const bool flag,const bool redraw=false)
  {
   ::ResetLastError();
   if(!::ChartSetInteger(this.ID(),CHART_SHOW_OBJECT_DESCR,flag))
     {
      CMessage::ToLog(source,::GetLastError(),true);
      return false;
     }
   this.SetProperty(CHART_PROP_SHOW_OBJECT_DESCR,flag);
   if(redraw)
      ::ChartRedraw(this.ID());
   return true;
  }
//+------------------------------------------------------------------+
//| Set the flag of displaying trading levels on the chart           |
//+------------------------------------------------------------------+
bool CChartObj::SetShowTradeLevelsFlag(const string source,const bool flag,const bool redraw=false)
  {
   ::ResetLastError();
   if(!::ChartSetInteger(this.ID(),CHART_SHOW_TRADE_LEVELS,flag))
     {
      CMessage::ToLog(source,::GetLastError(),true);
      return false;
     }
   this.SetProperty(CHART_PROP_SHOW_TRADE_LEVELS,flag);
   if(redraw)
      ::ChartRedraw(this.ID());
   return true;
  }
//+------------------------------------------------------------------+
//| Set the flag enabling dragging                                   |
//| trading levels on a chart using a mouse                          |
//+------------------------------------------------------------------+
bool CChartObj::SetDragTradeLevelsFlag(const string source,const bool flag,const bool redraw=false)
  {
   ::ResetLastError();
   if(!::ChartSetInteger(this.ID(),CHART_DRAG_TRADE_LEVELS,flag))
     {
      CMessage::ToLog(source,::GetLastError(),true);
      return false;
     }
   this.SetProperty(CHART_PROP_DRAG_TRADE_LEVELS,flag);
   if(redraw)
      ::ChartRedraw(this.ID());
   return true;
  }
//+------------------------------------------------------------------+
//| Set the flag of displaying the time scale on the chart           |
//+------------------------------------------------------------------+
bool CChartObj::SetShowDateScaleFlag(const string source,const bool flag,const bool redraw=false)
  {
   ::ResetLastError();
   if(!::ChartSetInteger(this.ID(),CHART_SHOW_DATE_SCALE,flag))
     {
      CMessage::ToLog(source,::GetLastError(),true);
      return false;
     }
   this.SetProperty(CHART_PROP_SHOW_DATE_SCALE,flag);
   if(redraw)
      ::ChartRedraw(this.ID());
   return true;
  }
//+------------------------------------------------------------------+
//| Set the flag of displaying the price scale on the chart          |
//+------------------------------------------------------------------+
bool CChartObj::SetShowPriceScaleFlag(const string source,const bool flag,const bool redraw=false)
  {
   ::ResetLastError();
   if(!::ChartSetInteger(this.ID(),CHART_SHOW_PRICE_SCALE,flag))
     {
      CMessage::ToLog(source,::GetLastError(),true);
      return false;
     }
   this.SetProperty(CHART_PROP_SHOW_PRICE_SCALE,flag);
   if(redraw)
      ::ChartRedraw(this.ID());
   return true;
  }
//+------------------------------------------------------------------+
//|Set the flag of displaying the quick trading panel on the chart   |
//+------------------------------------------------------------------+
bool CChartObj::SetShowOneClickPanelFlag(const string source,const bool flag,const bool redraw=false)
  {
   ::ResetLastError();
   if(!::ChartSetInteger(this.ID(),CHART_SHOW_ONE_CLICK,flag))
     {
      CMessage::ToLog(source,::GetLastError(),true);
      return false;
     }
   this.SetProperty(CHART_PROP_SHOW_ONE_CLICK,flag);
   if(redraw)
      ::ChartRedraw(this.ID());
   return true;
  }
//+------------------------------------------------------------------+
//| Set the flag of docking a chart window                           |
//+------------------------------------------------------------------+
bool CChartObj::SetDockedFlag(const string source,const bool flag,const bool redraw=false)
  {
   ::ResetLastError();
   if(!::ChartSetInteger(this.ID(),CHART_IS_DOCKED,flag))
     {
      CMessage::ToLog(source,::GetLastError(),true);
      return false;
     }
   this.SetProperty(CHART_PROP_IS_DOCKED,flag);
   if(redraw)
      ::ChartRedraw(this.ID());
   return true;
  }
//+------------------------------------------------------------------+
Wie wir sehen können, sind alle diese Methoden identisch mit der oben betrachteten, bis auf die editierbare Eigenschaft (in der letzten Methode mit Farbe markiert).
Drei private Methoden zum Einstellen der Anzeigemodi Chart, Skala und Chart-Volumen:
//+------------------------------------------------------------------+
//| Set the chart type                                               |
//+------------------------------------------------------------------+
bool CChartObj::SetMode(const string source,const ENUM_CHART_MODE mode,const bool redraw=false)
  {
   ::ResetLastError();
   if(!::ChartSetInteger(this.ID(),CHART_MODE,mode))
     {
      CMessage::ToLog(source,::GetLastError(),true);
      return false;
     }
   this.SetProperty(CHART_PROP_MODE,mode);
   if(redraw)
      ::ChartRedraw(this.ID());
   return true;
  }
//+------------------------------------------------------------------+
//| Set the chart scale                                              |
//+------------------------------------------------------------------+
bool CChartObj::SetScale(const string source,const int scale,const bool redraw=false)
  {
   int value=(scale<0 ? 0 : scale>5 ? 5 : scale);
   ::ResetLastError();
   if(!::ChartSetInteger(this.ID(),CHART_SCALE,value))
     {
      CMessage::ToLog(source,::GetLastError(),true);
      return false;
     }
   this.SetProperty(CHART_PROP_SCALE,value);
   if(redraw)
      ::ChartRedraw(this.ID());
   return true;
  }
//+------------------------------------------------------------------+
//| Set the mode of displaying the volumes on a chart                |
//+------------------------------------------------------------------+
bool CChartObj::SetModeVolume(const string source,ENUM_CHART_VOLUME_MODE mode,const bool redraw=false)
  {
   ::ResetLastError();
   if(!::ChartSetInteger(this.ID(),CHART_SHOW_VOLUMES,mode))
     {
      CMessage::ToLog(source,::GetLastError(),true);
      return false;
     }
   this.SetProperty(CHART_PROP_SHOW_VOLUMES,mode);
   if(redraw)
      ::ChartRedraw(this.ID());
   return true;
  }
//+------------------------------------------------------------------+
Die Methoden sind ebenfalls identisch mit den oben betrachteten, bis auf die Eingänge, bei denen anstelle der Flags die gewünschten Modi übergeben werden, während bei der Methode zum Setzen der Chart-Skala zusätzlich die Grenzen des übergebenen Skalenwertes (0-5) geprüft werden.
Die Charts verfügen über die Eigenschaften, die nicht eingestellt werden können. Sie können nur erhalten werden. Damit das Chartobjekt aber die gleichen Werte wie der Chart hat, brauchen wir Methoden, die es uns erlauben, die Werte der Chartparameter in die entsprechenden Objekteigenschaften einzutragen. Diese werden beim Erstellen des Chart-Objekts gesetzt, aber wenn sie vom Terminal geändert werden, dann müssen wir rechtzeitig auf diese Änderung reagieren und die entsprechenden Änderungen an den Eigenschaften des Chart-Objekts vornehmen.
Dafür sind die folgenden privaten Methoden gedacht:
//+------------------------------------------------------------------+
//|  Set the property                                                |
//| "Number of bars on a chart that are available for display"       |
//+------------------------------------------------------------------+
void CChartObj::SetVisibleBars(void)
  {
   this.SetProperty(CHART_PROP_VISIBLE_BARS,::ChartGetInteger(this.ID(),CHART_VISIBLE_BARS));
  }
//+-------------------------------------------------------------------+
//|  Set the property                                                 |
//| "The total number of chart windows including indicator subwindows"|
//+-------------------------------------------------------------------+
void CChartObj::SetWindowsTotal(void)
  {
   this.SetProperty(CHART_PROP_WINDOWS_TOTAL,::ChartGetInteger(this.ID(),CHART_WINDOWS_TOTAL));
  }
//+----------------------------------------------------------------------+
//| Set the property "The number of the first visible bar on the chart"  |
//+----------------------------------------------------------------------+
void CChartObj::SetFirstVisibleBars(void)
  {
   this.SetProperty(CHART_PROP_FIRST_VISIBLE_BAR,::ChartGetInteger(this.ID(),CHART_FIRST_VISIBLE_BAR));
  }
//+------------------------------------------------------------------+
//| Set the property "Width of the chart in bars"                    |
//+------------------------------------------------------------------+
void CChartObj::SetWidthInBars(void)
  {
   this.SetProperty(CHART_PROP_WIDTH_IN_BARS,::ChartGetInteger(this.ID(),CHART_WIDTH_IN_BARS));
  }
//+------------------------------------------------------------------+
//| Set the property "Width of the chart in pixels"                  |
//+------------------------------------------------------------------+
void CChartObj::SetWidthInPixels(void)
  {
   this.SetProperty(CHART_PROP_WIDTH_IN_PIXELS,::ChartGetInteger(this.ID(),CHART_WIDTH_IN_PIXELS));
  }
//+------------------------------------------------------------------+
//| Set the property "Chart window maximized"                        |
//+------------------------------------------------------------------+
void CChartObj::SetMaximizedFlag(void)
  {
   this.SetProperty(CHART_PROP_IS_MAXIMIZED,::ChartGetInteger(this.ID(),CHART_IS_MAXIMIZED));
  }
//+------------------------------------------------------------------+
//| Set the property "Chart window minimized"                        |
//+------------------------------------------------------------------+
void CChartObj::SetMinimizedFlag(void)
  {
   this.SetProperty(CHART_PROP_IS_MINIMIZED,::ChartGetInteger(this.ID(),CHART_IS_MINIMIZED));
  }
//+------------------------------------------------------------------+
//| Set the property "Name of an EA launched on the chart"           |
//+------------------------------------------------------------------+
void CChartObj::SetExpertName(void)
  {
   this.SetProperty(CHART_PROP_EXPERT_NAME,::ChartGetString(this.ID(),CHART_EXPERT_NAME));
  }
//+------------------------------------------------------------------+
//| Set the property "Name of a script launched on the chart"        |
//+------------------------------------------------------------------+
void CChartObj::SetScriptName(void)
  {
   this.SetProperty(CHART_PROP_SCRIPT_NAME,::ChartGetString(this.ID(),CHART_SCRIPT_NAME));
  }
//+------------------------------------------------------------------+
Der Chart-Parameter wird hier auf die entsprechende Objekteigenschaft gesetzt. Die Arbeit mit diesen Methoden werden wir in den kommenden Artikeln implementieren.
Nun müssen wir die Methoden für einen vereinfachten Zugriff auf die Eigenschaften des Chart-Objekts in den öffentlichen Klassenbereich einfügen. Dies werden die Methoden zum Aktivieren/Deaktivieren der Chart-Parameter, zum Einstellen der Farbe, der Größe und anderer Funktionen sein, die für die Arbeit mit dem Chart notwendig sind.
Die Methoden sind recht zahlreich. Lassen Sie sie uns daher in Gruppen einteilen.
Die Methoden zum Zurückgeben/Einstellen von Eigenschaften in den Status Aktiviert/Deaktiviert:
//--- Constructors
                     CChartObj(){;}
                     CChartObj(const long chart_id);
//+------------------------------------------------------------------+
//| Methods of simplified access to chart object properties          |
//+------------------------------------------------------------------+
//--- (1) Return, (2) enable, (3) disable drawing a price chart
   bool              IsShow(void)                                    const { return (bool)this.GetProperty(CHART_PROP_SHOW);              }
   bool              SetShowON(const bool redraw=false)                    { return this.SetShowFlag(DFUN,true,redraw);                   }
   bool              SetShowOFF(const bool redraw=false)                   { return this.SetShowFlag(DFUN,true,redraw);                   }

//--- (1) Return, (2) enable, (3) disable access to the context menu using the right click
   bool              IsAllowedContextMenu(void)                      const { return (bool)this.GetProperty(CHART_PROP_CONTEXT_MENU);      }
   bool              SetContextMenuON(const bool redraw=false)             { return this.SetContextMenuFlag(DFUN,true,redraw);            }
   bool              SetContextMenuOFF(const bool redraw=false)            { return this.SetContextMenuFlag(DFUN,false,redraw);           }

//--- (1) Return, (2) enable, (3) disable access to the Crosshair using the middle click
   bool              IsCrosshairTool(void)                           const { return (bool)this.GetProperty(CHART_PROP_CROSSHAIR_TOOL);    }
   bool              SetCrosshairToolON(const bool redraw=false);
   bool              SetCrosshairToolOFF(const bool redraw=false);

//--- (1) Return, (2) enable, (3) disable scrolling the chart horizontally using the left click
   bool              IsMouseScroll(void)                             const { return (bool)this.GetProperty(CHART_PROP_MOUSE_SCROLL);      }
   bool              SetMouseScrollON(const bool redraw=false)             { return this.SetMouseScrollFlag(DFUN,true,redraw);            }
   bool              SetMouseScrollOFF(const bool redraw=false)            { return this.SetMouseScrollFlag(DFUN,false,redraw);           }

//--- (1) Return, (2) enable, (3) disable sending messages about mouse wheel events to all MQL5 programs on a chart
   bool              IsEventMouseWhell(void)                         const { return (bool)this.GetProperty(CHART_PROP_EVENT_MOUSE_WHEEL); }
   bool              SetEventMouseWhellON(const bool redraw=false)         { return this.SetEventMouseWhellFlag(DFUN,true,redraw);        }
   bool              SetEventMouseWhellOFF(const bool redraw=false)        { return this.SetEventMouseWhellFlag(DFUN,false,redraw);       }

//--- (1) Return, (2) enable, (3) disable sending messages about mouse button movement and click events to all MQL5 programs on a chart
   bool              IsEventMouseMove(void)                          const { return (bool)this.GetProperty(CHART_PROP_EVENT_MOUSE_MOVE);  }
   bool              SetEventMouseMoveON(const bool redraw=false)          { return this.SetEventMouseMoveFlag(DFUN,true,redraw);         }
   bool              SetEventMouseMoveOFF(const bool redraw=false)         { return this.SetEventMouseMoveFlag(DFUN,false,redraw);        }

//--- (1) Return, (2) enable, (3) disable sending messages about the graphical object creation event to all MQL5 programs on a chart
   bool              IsEventObjectCreate(void)                       const { return (bool)this.GetProperty(CHART_PROP_EVENT_OBJECT_CREATE);}
   bool              SetEventObjectCreateON(const bool redraw=false)       { return this.SetEventObjectCreateFlag(DFUN,true,redraw);      }
   bool              SetEventObjectCreateOFF(const bool redraw=false)      { return this.SetEventObjectCreateFlag(DFUN,false,redraw);     }

//--- (1) Return, (2) enable, (3) disable sending messages about the graphical object destruction event to all MQL5 programs on a chart
   bool              IsEventObjectDelete(void)                       const { return (bool)this.GetProperty(CHART_PROP_EVENT_OBJECT_DELETE);}
   bool              SetEventObjectDeleteON(const bool redraw=false)       { return this.SetEventObjectDeleteFlag(DFUN,true,redraw);      }
   bool              SetEventObjectDeleteOFF(const bool redraw=false)      { return this.SetEventObjectDeleteFlag(DFUN,false,redraw);     }

//--- (1) Return, (2) enable, (3) disable price chart in the foreground
   bool              IsForeground(void)                              const { return (bool)this.GetProperty(CHART_PROP_FOREGROUND);        }
   bool              SetForegroundON(const bool redraw=false)              { return this.SetForegroundFlag(DFUN,true,redraw);             }
   bool              SetForegroundOFF(const bool redraw=false)             { return this.SetForegroundFlag(DFUN,false,redraw);            }

//--- (1) Return, (2) enable, (3) disable shift of the price chart from the right border
   bool              IsShift(void)                                   const { return (bool)this.GetProperty(CHART_PROP_SHIFT);             }
   bool              SetShiftON(const bool redraw=false)                   { return this.SetShiftFlag(DFUN,true,redraw);                  }
   bool              SetShiftOFF(const bool redraw=false)                  { return this.SetShiftFlag(DFUN,false,redraw);                 }

//--- (1) Return, (2) enable, (3) disable auto scroll to the right border of the chart
   bool              IsAutoscroll(void)                              const { return (bool)this.GetProperty(CHART_PROP_AUTOSCROLL);        }
   bool              SetAutoscrollON(const bool redraw=false)              { return this.SetAutoscrollFlag(DFUN,true,redraw);             }
   bool              SetAutoscrollOFF(const bool redraw=false)             { return this.SetAutoscrollFlag(DFUN,false,redraw);            }

//--- (1) Return, (2) enable, (3) disable the permission to manage the chart using a keyboard
   bool              IsKeyboardControl(void)                         const { return (bool)this.GetProperty(CHART_PROP_KEYBOARD_CONTROL);  }
   bool              SetKeyboardControlON(const bool redraw=false)         { return this.SetKeyboardControlFlag(DFUN,true,redraw);        }
   bool              SetKeyboardControlOFF(const bool redraw=false)        { return this.SetKeyboardControlFlag(DFUN,false,redraw);       }

//--- (1) Return, (2) enable, (3) disable the permission for the chart to intercept Space and Enter key strokes to activate the quick navigation bar
   bool              IsQuickNavigation(void)                         const { return (bool)this.GetProperty(CHART_PROP_QUICK_NAVIGATION);  }
   bool              SetQuickNavigationON(const bool redraw=false)         { return this.SetQuickNavigationFlag(DFUN,true,redraw);        }
   bool              SetQuickNavigationOFF(const bool redraw=false)        { return this.SetQuickNavigationFlag(DFUN,false,redraw);       }

//--- (1) Return, (2) enable, (3) disable a fixed scale
   bool              IsScaleFix(void)                                const { return (bool)this.GetProperty(CHART_PROP_SCALEFIX);          }
   bool              SetScaleFixON(const bool redraw=false)                { return this.SetScaleFixFlag(DFUN,true,redraw);               }
   bool              SetScaleFixOFF(const bool redraw=false)               { return this.SetScaleFixFlag(DFUN,false,redraw);              }

//--- (1) Return, (2) enable, (3) disable the 1:1 scale
   bool              IsScaleFix11(void)                              const { return (bool)this.GetProperty(CHART_PROP_SCALEFIX_11);       }
   bool              SetScaleFix11ON(const bool redraw=false)              { return this.SetScaleFix11Flag(DFUN,true,redraw);             }
   bool              SetScaleFix11OFF(const bool redraw=false)             { return this.SetScaleFix11Flag(DFUN,false,redraw);            }

//--- (1) Return, (2) enable, (3) disable the mode of specifying the chart scale in points per bar
   bool              IsScalePTPerBar(void)                           const { return (bool)this.GetProperty(CHART_PROP_SCALE_PT_PER_BAR);  }
   bool              SetScalePTPerBarON(const bool redraw=false)           { return this.SetScalePTPerBarFlag(DFUN,true,redraw);          }
   bool              SetScalePTPerBarOFF(const bool redraw=false)          { return this.SetScalePTPerBarFlag(DFUN,false,redraw);         }

//--- (1) Return, (2) enable, (3) disable a display of a symbol ticker in the upper left corner
   bool              IsShowTicker(void)                              const { return (bool)this.GetProperty(CHART_PROP_SHOW_TICKER);       }
   bool              SetShowTickerON(const bool redraw=false)              { return this.SetShowTickerFlag(DFUN,true,redraw);             }
   bool              SetShowTickerOFF(const bool redraw=false)             { return this.SetShowTickerFlag(DFUN,false,redraw);            }

//--- (1) Return, (2) enable, (3) disable a display of OHLC values in the upper left corner
   bool              IsShowOHLC(void)                                const { return (bool)this.GetProperty(CHART_PROP_SHOW_OHLC);         }
   bool              SetShowOHLCON(const bool redraw=false)                { return this.SetShowOHLCFlag(DFUN,true,redraw);               }
   bool              SetShowOHLCOFF(const bool redraw=false)               { return this.SetShowOHLCFlag(DFUN,false,redraw);              }

//--- (1) Return, (2) enable, (3) disable the display of a Bid value as a horizontal line on the chart
   bool              IsShowBidLine(void)                             const { return (bool)this.GetProperty(CHART_PROP_SHOW_BID_LINE);     }
   bool              SetShowBidLineON(const bool redraw=false)             { return this.SetShowBidLineFlag(DFUN,true,redraw);            }
   bool              SetShowBidLineOFF(const bool redraw=false)            { return this.SetShowBidLineFlag(DFUN,false,redraw);           }

//--- (1) Return, (2) enable, (3) disable the display of a Ask value as a horizontal line on the chart
   bool              IsShowAskLine(void)                             const { return (bool)this.GetProperty(CHART_PROP_SHOW_ASK_LINE);     }
   bool              SetShowAskLineON(const bool redraw=false)             { return this.SetShowAskLineFlag(DFUN,true,redraw);            }
   bool              SetShowAskLineOFF(const bool redraw=false)            { return this.SetShowAskLineFlag(DFUN,false,redraw);           }

//--- (1) Return, (2) enable, (3) disable the display of a Last value as a horizontal line on the chart
   bool              IsShowLastLine(void)                            const { return (bool)this.GetProperty(CHART_PROP_SHOW_LAST_LINE);    }
   bool              SetShowLastLineON(const bool redraw=false)            { return this.SetShowLastLineFlag(DFUN,true,redraw);           }
   bool              SetShowLastLineOFF(const bool redraw=false)           { return this.SetShowLastLineFlag(DFUN,false,redraw);          }

//--- (1) Return, (2) enable, (3) disable the display of vertical separators between adjacent periods
   bool              IsShowPeriodSeparators(void)                    const { return (bool)this.GetProperty(CHART_PROP_SHOW_PERIOD_SEP);   }
   bool              SetShowPeriodSeparatorsON(const bool redraw=false)    { return this.SetShowPeriodSeparatorsFlag(DFUN,true,redraw);   }
   bool              SetShowPeriodSeparatorsOFF(const bool redraw=false)   { return this.SetShowPeriodSeparatorsFlag(DFUN,false,redraw);  }

//--- (1) Return, (2) enable, (3) disable the display of the chart grid
   bool              IsShowGrid(void)                                const { return (bool)this.GetProperty(CHART_PROP_SHOW_GRID);         }
   bool              SetShowGridON(const bool redraw=false)                { return this.SetShowGridFlag(DFUN,true,redraw);               }
   bool              SetShowGridOFF(const bool redraw=false)               { return this.SetShowGridFlag(DFUN,false,redraw);              }

//--- (1) Return, (2) enable, (3) disable the display of text descriptions of objects
   bool              IsShowObjectDescriptions(void)   const { return (bool)this.GetProperty(CHART_PROP_SHOW_OBJECT_DESCR);                }
   bool              SetShowObjectDescriptionsON(const bool redraw=false);
   bool              SetShowObjectDescriptionsOFF(const bool redraw=false);

//--- (1) Return, (2) enable, (3) disable the display of trade levels on the chart (levels of open positions, Stop Loss, Take Profit and pending orders)
   bool              IsShowTradeLevels(void)                         const { return (bool)this.GetProperty(CHART_PROP_SHOW_TRADE_LEVELS); }
   bool              SetShowTradeLevelsON(const bool redraw=false)         { return this.SetShowTradeLevelsFlag(DFUN,true,redraw);        }
   bool              SetShowTradeLevelsOFF(const bool redraw=false)        { return this.SetShowTradeLevelsFlag(DFUN,false,redraw);       }

//--- (1) Return, (2) enable, (3) disable the ability to drag trading levels on a chart using mouse
   bool              IsDragTradeLevels(void)                         const { return (bool)this.GetProperty(CHART_PROP_DRAG_TRADE_LEVELS); }
   bool              SetDragTradeLevelsON(const bool redraw=false)         { return this.SetDragTradeLevelsFlag(DFUN,true,redraw);        }
   bool              SetDragTradeLevelsOFF(const bool redraw=false)        { return this.SetDragTradeLevelsFlag(DFUN,false,redraw);       }

//--- (1) Return, (2) enable, (3) disable the display of the time scale on the chart
   bool              IsShowDateScale(void)                           const { return (bool)this.GetProperty(CHART_PROP_SHOW_DATE_SCALE);   }
   bool              SetShowDateScaleON(const bool redraw=false)           { return this.SetShowDateScaleFlag(DFUN,true,redraw);          }
   bool              SetShowDateScaleOFF(const bool redraw=false)          { return this.SetShowDateScaleFlag(DFUN,false,redraw);         }

//--- (1) Return, (2) enable, (3) disable the display of the price scale on the chart
   bool              IsShowPriceScale(void)                          const { return (bool)this.GetProperty(CHART_PROP_SHOW_PRICE_SCALE);  }
   bool              SetShowPriceScaleON(const bool redraw=false)          { return this.SetShowPriceScaleFlag(DFUN,true,redraw);         }
   bool              SetShowPriceScaleOFF(const bool redraw=false)         { return this.SetShowPriceScaleFlag(DFUN,false,redraw);        }

//--- (1) Return, (2) enable, (3) disable the display of the quick trading panel on the chart
   bool              IsShowOneClickPanel(void)                       const { return (bool)this.GetProperty(CHART_PROP_SHOW_ONE_CLICK);    }
   bool              SetShowOneClickPanelON(const bool redraw=false)       { return this.SetShowOneClickPanelFlag(DFUN,true,redraw);      }
   bool              SetShowOneClickPanelOFF(const bool redraw=false)      { return this.SetShowOneClickPanelFlag(DFUN,false,redraw);     }

//--- (1) Return, (2) enable, (3) disable docking the chart window
   bool              IsDocked(void)                                  const { return (bool)this.GetProperty(CHART_PROP_IS_DOCKED);         }
   bool              SetDockedON(const bool redraw=false)                  { return this.SetDockedFlag(DFUN,true,redraw); }
   bool              SetDockedOFF(const bool redraw=false)                 { return this.SetDockedFlag(DFUN,false,redraw); }

//--- (1) Enable and (2) disable the display of the chart above all others
   bool              SetBringToTopON(const bool redraw=false)              { return this.SetBringToTopFlag(DFUN,true,redraw);             }
   bool              SetBringToTopOFF(const bool redraw=false)             { return this.SetBringToTopFlag(DFUN,false,redraw);            }
Alle Methoden zum Setzen von Flags sind identisch und geben das Ergebnis der oben besprochenen entsprechenden privaten Methoden zum Setzen von Flags zurück. Die Methoden zur Rückgabe der Eigenschaften geben den in der entsprechenden Objekteigenschaft gesetzten Wert zurück. Die letzten beiden Methoden setzen nur Flags, da es keine Möglichkeit gibt, die Chart-Eigenschaft "Über allem anderem" über die Funktion ChartGetInteger() mit der ID CHART_BRING_TO_TOP zurückzugeben, da diese Chart-Eigenschaft nur zum Schreiben der Werte gedacht ist.
Die Methoden zum Zurückgeben/Einstellen der Modi der Darstellung des Charts, Skala des Charts und Volumen des Charts:
//--- (1) Return, set the chart type (2) bars, (3) candles, (4) line
   ENUM_CHART_MODE   Mode(void)                                      const { return (ENUM_CHART_MODE)this.GetProperty(CHART_PROP_MODE);   }
   bool              SetModeBars(const bool redraw=false)                  { return this.SetMode(DFUN,CHART_BARS,redraw);                 }
   bool              SetModeCandles(const bool redraw=false)               { return this.SetMode(DFUN,CHART_CANDLES,redraw);              }
   bool              SetModeLine(const bool redraw=false)                  { return this.SetMode(DFUN,CHART_LINE,redraw);                 }

//--- (1) Return, (2 - 7) set the chart scale
   int               Scale(void)                                     const { return (int)this.GetProperty(CHART_PROP_SCALE);              }
   bool              SetScale0(const bool redraw=false)                    { return this.SetScale(DFUN,0,redraw);                         }
   bool              SetScale1(const bool redraw=false)                    { return this.SetScale(DFUN,1,redraw);                         }
   bool              SetScale2(const bool redraw=false)                    { return this.SetScale(DFUN,2,redraw);                         }
   bool              SetScale3(const bool redraw=false)                    { return this.SetScale(DFUN,3,redraw);                         }
   bool              SetScale4(const bool redraw=false)                    { return this.SetScale(DFUN,4,redraw);                         }
   bool              SetScale5(const bool redraw=false)                    { return this.SetScale(DFUN,5,redraw);                         }

//--- (1) Return, set the volume display modes (2) disabled, (3) tick volumes, (4) real volumes
   ENUM_CHART_VOLUME_MODE  ModeVolume(void)                          const { return (ENUM_CHART_VOLUME_MODE)this.GetProperty(CHART_PROP_SHOW_VOLUMES);}
   bool              SetModeVolumeHide(const bool redraw=false)            { return this.SetModeVolume(DFUN,CHART_VOLUME_HIDE,redraw);    }
   bool              SetModeVolumeTick(const bool redraw=false)            { return this.SetModeVolume(DFUN,CHART_VOLUME_TICK,redraw);    }
   bool              SetModeVolumeReal(const bool redraw=false)            { return this.SetModeVolume(DFUN,CHART_VOLUME_REAL,redraw);    }
Die Methoden zur Rückgabe der Eigenschaftswerte sind hier identisch mit den Methoden zur Rückgabe von Flags — der in der entsprechenden Objekteigenschaft gesetzte Wert wird zurückgegeben. Die Methoden zum Setzen von Werten geben das Ergebnis der privaten Methoden mit dem angegebenen Wert zurück, der in der Objekt- und Chart-Eigenschaft gesetzt werden soll.
Die Methoden zur Rückgabe und Einstellung der Farben für die Anzeige von verschiedenen Chartelementen und anderen editierbaren Chart-Parametern:
//--- Return, (2) set the chart background color
   color             ColorBackground(void)                           const { return (color)this.GetProperty(CHART_PROP_COLOR_BACKGROUND); }
   bool              SetColorBackground(const color colour,const bool redraw=false);

//--- (1) Return, (2) set the color of axes, scale and OHLC line
   color             ColorForeground(void)                           const { return (color)this.GetProperty(CHART_PROP_COLOR_FOREGROUND); }
   bool              SetColorForeground(const color colour,const bool redraw=false);

//--- (1) Return and (2) set the grid color
   color             ColorGrid(void)                                 const { return (color)this.GetProperty(CHART_PROP_COLOR_GRID);       }
   bool              SetColorGrid(const color colour,const bool redraw=false);

//--- (1) Return and (2) set the volume color and position opening levels
   color             ColorVolume(void)                               const { return (color)this.GetProperty(CHART_PROP_COLOR_VOLUME);     }
   bool              SetColorVolume(const color colour,const bool redraw=false);

//--- (1) Return and (2) set the color of up bar, its shadow and border of bullish candle body
   color             ColorUp(void)                                   const { return (color)this.GetProperty(CHART_PROP_COLOR_CHART_UP);   }
   bool              SetColorUp(const color colour,const bool redraw=false);

//--- (1) Return and (2) set the color of down bar, its shadow and border of bearish candle body
   color             ColorDown(void)                                 const { return (color)this.GetProperty(CHART_PROP_COLOR_CHART_DOWN); }
   bool              SetColorDown(const color colour,const bool redraw=false);

//--- (1) Return and (2) set the color of the chart line and Doji candles
   color             ColorLine(void)                                 const { return (color)this.GetProperty(CHART_PROP_COLOR_CHART_LINE); }
   bool              SetColorLine(const color colour,const bool redraw=false);

//--- (1) Return and (2) set the color of the bullish candle body
   color             ColorCandleBull(void)                           const { return (color)this.GetProperty(CHART_PROP_COLOR_CANDLE_BULL);}
   bool              SetColorCandleBull(const color colour,const bool redraw=false);

//--- (1) Return and (2) set the color of the bearish candle body
   color             ColorCandleBear(void)                           const { return (color)this.GetProperty(CHART_PROP_COLOR_CANDLE_BEAR);}
   bool              SetColorCandleBear(const color colour,const bool redraw=false);

//--- (1) Return and (2) set the Bid price line color
   color             ColorBid(void)                                  const { return (color)this.GetProperty(CHART_PROP_COLOR_BID);        }
   bool              SetColorBid(const color colour,const bool redraw=false);

//--- (1) Return and (2) set the Ask price line color
   color             ColorAsk(void)                                  const { return (color)this.GetProperty(CHART_PROP_COLOR_ASK);        }
   bool              SetColorAsk(const color colour,const bool redraw=false);

//--- (1) Return and (2) set the color of the price line of the last performed deal (Last)
   color             ColorLast(void)                                 const { return (color)this.GetProperty(CHART_PROP_COLOR_LAST);       }
   bool              SetColorLast(const color colour,const bool redraw=false);

//--- (1) Return and (2) set the color of stop order levels (Stop Loss and Take Profit)
   color             ColorStops(void)                                const { return (color)this.GetProperty(CHART_PROP_COLOR_STOP_LEVEL); }
   bool              SetColorStops(const color colour,const bool redraw=false);

//--- (1) Return and (2) set the left coordinate of the undocked chart window relative to the virtual screen
   int               FloatLeft(void)                                 const { return (int)this.GetProperty(CHART_PROP_FLOAT_LEFT);         }
   bool              SetFloatLeft(const int value,const bool redraw=false);

//--- (1) Return and (2) set the top coordinate of the undocked chart window relative to the virtual screen
   int               FloatTop(void)                                  const { return (int)this.GetProperty(CHART_PROP_FLOAT_TOP);          }
   bool              SetFloatTop(const int value,const bool redraw=false);

//--- (1) Return and (2) set the right coordinate of the undocked chart window relative to the virtual screen
   int               FloatRight(void)                                const { return (int)this.GetProperty(CHART_PROP_FLOAT_RIGHT);        }
   bool              SetFloatRight(const int value,const bool redraw=false);

//--- (1) Return and (2) set the bottom coordinate of the undocked chart window relative to the virtual screen
   int               FloatBottom(void)                               const { return (int)this.GetProperty(CHART_PROP_FLOAT_BOTTOM);       }
   bool              SetFloatBottom(const int value,const bool redraw=false);

//--- (1) Return and (2) set the shift size of the zero bar from the right border in %
   double            ShiftSize(void)                                 const { return this.GetProperty(CHART_PROP_SHIFT_SIZE);              }
   bool              SetShiftSize(const double value,const bool redraw=false);

//--- (1) Return and (2) set the chart fixed position from the left border in %
   double            FixedPosition(void)                             const { return this.GetProperty(CHART_PROP_FIXED_POSITION);          }
   bool              SetFixedPosition(const double value,const bool redraw=false);

//--- (1) Return and (2) set the fixed chart maximum
   double            FixedMaximum(void)                              const { return this.GetProperty(CHART_PROP_FIXED_MAX);               }
   bool              SetFixedMaximum(const double value,const bool redraw=false);

//--- (1) Return and (2) set the fixed chart minimum
   double            FixedMinimum(void)                              const { return this.GetProperty(CHART_PROP_FIXED_MIN);               }
   bool              SetFixedMinimum(const double value,const bool redraw=false);

//--- (1) Return and (2) set the value of the scale in points per bar
   double            PointsPerBar(void)                              const { return this.GetProperty(CHART_PROP_POINTS_PER_BAR);          }
   bool              SetPointsPerBar(const double value,const bool redraw=false);

//--- (1) Return and (2) set the comment on the chart
   string            Comment(void)                                   const { return this.GetProperty(CHART_PROP_COMMENT);                 }
   bool              SetComment(const string comment,const bool redraw=false);

//--- (1) Return and (2) set the chart symbol
   string            Symbol(void)                                    const { return this.GetProperty(CHART_PROP_SYMBOL);                  }
   bool              SetSymbol(const string symbol);

//--- (1) Return and (2) set the chart period
   ENUM_TIMEFRAMES   Timeframe(void)                                 const { return (ENUM_TIMEFRAMES)this.GetProperty(CHART_PROP_TIMEFRAME); }
   bool              SetTimeframe(const ENUM_TIMEFRAMES timeframe);
Die Methoden zur Rückgabe der Eigenschaften geben die in der entsprechenden Objekteigenschaft eingestellten Werte zurück. Die Setzmethoden werden hier nur deklariert. Ihre Implementierung wird später besprochen.
Die Methoden, die die Eigenschaften des Chart-Objekts zurückgeben, entsprechen den schreibgeschützten Chart-Parametern:
//--- (1) Return the Chart object identification attribute
   bool              IsObject(void)                                  const { return (bool)this.GetProperty(CHART_PROP_IS_OBJECT);         }

//--- Return the chart ID
   long              ID(void)                                        const { return this.GetProperty(CHART_PROP_ID);                      }

//--- Return the number of bars on a chart that are available for display
   int               VisibleBars(void)                               const { return (int)this.GetProperty(CHART_PROP_VISIBLE_BARS);       }

//--- Return the total number of chart windows including indicator subwindows
   int               WindowsTotal(void)                              const { return (int)this.GetProperty(CHART_PROP_WINDOWS_TOTAL);      }

//--- Return the chart window handle
   int               Handle(void)                                    const { return (int)this.GetProperty(CHART_PROP_WINDOW_HANDLE);      }

//--- Return the number of the first visible bar on the chart
   int               FirstVisibleBars(void)                          const { return (int)this.GetProperty(CHART_PROP_FIRST_VISIBLE_BAR);  }

//--- Return the chart width in bars
   int               WidthInBars(void)                               const { return (int)this.GetProperty(CHART_PROP_WIDTH_IN_BARS);      }

//--- Return the chart width in pixels
   int               WidthInPixels(void)                             const { return (int)this.GetProperty(CHART_PROP_WIDTH_IN_PIXELS);    }

//--- Return the "Chart window maximized" property
   bool              IsMaximized(void)                               const { return (bool)this.GetProperty(CHART_PROP_IS_MAXIMIZED);      }

//--- Return the "Chart window minimized" property
   bool              IsMinimized(void)                               const { return (bool)this.GetProperty(CHART_PROP_IS_MINIMIZED);      }

//--- Return the name of an EA launched on the chart
   string            ExpertName(void)                                const { return this.GetProperty(CHART_PROP_EXPERT_NAME);             }

//--- Return the name of a script launched on the chart
   string            ScriptName(void)                                const { return this.GetProperty(CHART_PROP_SCRIPT_NAME);             }
Die Methoden geben den Wert zurück, der auf die entsprechende Eigenschaft des Chartobjekts gesetzt wurde.
Die Methoden, die Chart-Parameterwerte zurückgeben/einstellen, für die der Subfenster-Index angegeben werden sollte:
//--- (1) Return and (2) set the height of the specified chart in pixels
   int               WindowHeightInPixels(const int sub_window)      const { return (int)::ChartGetInteger(this.ID(),CHART_HEIGHT_IN_PIXELS,sub_window);       }
   bool              SetWindowHeightInPixels(const int height,const int sub_window,const bool redraw=false);

//--- Return the distance in Y axis pixels between the upper frame of the indicator subwindow and the upper frame of the chart main window
   int               WindowYDistance(const int sub_window)           const { return (int)::ChartGetInteger(this.ID(),CHART_WINDOW_YDISTANCE,sub_window);       }

//--- Return the specified subwindow visibility
   bool              IsVisibleWindow(const int sub_window)           const { return (bool)::ChartGetInteger(this.Handle(),CHART_WINDOW_IS_VISIBLE,sub_window); }

//--- Return the minimum of the specified chart
   double            PriceMinimum(const int sub_window)              const { return ::ChartGetDouble(this.ID(),CHART_PRICE_MIN,sub_window);  }

//--- Return the maximum of the specified chart
   double            PriceMaximum(const int sub_window)              const { return ::ChartGetDouble(this.ID(),CHART_PRICE_MAX,sub_window);  }
Diese Methoden werden hier temporär gesetzt. Später wird das Chartobjekt die Liste der zum Chart gehörenden Indikator-Unterfenster enthalten. Die Nummern dieser Unterfenster sollen in den Funktionen zum Setzen/Rückgeben der Werte angegeben werden, so dass die Methoden zu überarbeiten sind. Daher werden die Werte direkt aus dem Chart zurückgegeben, der durch das Chartobjekt beschrieben wird, und nicht aus den Objekteigenschaften.
Die Methode für die Tick-Emulation:
//--- Emulate a tick (chart updates - similar to the terminal Refresh command)
   void              EmulateTick(void)                                     { ::ChartSetSymbolPeriod(this.ID(),this.Symbol(),this.Timeframe());}

  };
//+------------------------------------------------------------------+
//| Parametric constructor                                           |
//+------------------------------------------------------------------+
Der Aufruf der Funktion ChartSetSymbolPeriod() unter Angabe des Symbols und eines Zeitrahmens, der dem des aktuellen Charts entspricht, kann zur Aktualisierung des Charts verwendet werden (ähnlich wie der Befehl Aktualisieren im Terminal). Ein Update des Charts wiederum löst eine Neuberechnung der mit ihm verbundenen Indikatoren aus. So ist es möglich, einen Indikator im Chart auch dann zu berechnen, wenn es keine Ticks gibt (z. B. am Wochenende).
Implementieren wir die deklarierte Methoden im Methodenblock für einen vereinfachten Zugriff auf die Objekteigenschaften außerhalb des Klassenkörpers.
Die Methoden zum Einstellen der Farbe des Chartelements und anderer benutzerdefinierter Chart-Parameter:
//+------------------------------------------------------------------+
//| Set the chart background color                                   |
//+------------------------------------------------------------------+
bool CChartObj::SetColorBackground(const color colour,const bool redraw=false)
  {
   ::ResetLastError();
   if(!::ChartSetInteger(this.ID(),CHART_COLOR_BACKGROUND,colour))
     {
      CMessage::ToLog(DFUN,::GetLastError(),true);
      return false;
     }
   this.SetProperty(CHART_PROP_COLOR_BACKGROUND,colour);
   if(redraw)
      ::ChartRedraw(this.ID());
   return true;
  }
//+------------------------------------------------------------------+
//| Set the color of axes, scale and OHLC line                       |
//+------------------------------------------------------------------+
bool CChartObj::SetColorForeground(const color colour,const bool redraw=false)
  {
   ::ResetLastError();
   if(!::ChartSetInteger(this.ID(),CHART_COLOR_FOREGROUND,colour))
     {
      CMessage::ToLog(DFUN,::GetLastError(),true);
      return false;
     }
   this.SetProperty(CHART_PROP_COLOR_FOREGROUND,colour);
   if(redraw)
      ::ChartRedraw(this.ID());
   return true;
  }
//+------------------------------------------------------------------+
//| Set the grid color                                               |
//+------------------------------------------------------------------+
bool CChartObj::SetColorGrid(const color colour,const bool redraw=false)
  {
   ::ResetLastError();
   if(!::ChartSetInteger(this.ID(),CHART_COLOR_GRID,colour))
     {
      CMessage::ToLog(DFUN,::GetLastError(),true);
      return false;
     }
   this.SetProperty(CHART_PROP_COLOR_GRID,colour);
   if(redraw)
      ::ChartRedraw(this.ID());
   return true;
  }
//+------------------------------------------------------------------+
//| Set the volume color and position opening levels                 |
//+------------------------------------------------------------------+
bool CChartObj::SetColorVolume(const color colour,const bool redraw=false)
  {
   ::ResetLastError();
   if(!::ChartSetInteger(this.ID(),CHART_COLOR_VOLUME,colour))
     {
      CMessage::ToLog(DFUN,::GetLastError(),true);
      return false;
     }
   this.SetProperty(CHART_PROP_COLOR_VOLUME,colour);
   if(redraw)
      ::ChartRedraw(this.ID());
   return true;
  }
//+----------------------------------------------------------------------+
//|Set the color of up bar, its shadow and border of bullish candle body |
//+----------------------------------------------------------------------+
bool CChartObj::SetColorUp(const color colour,const bool redraw=false)
  {
   ::ResetLastError();
   if(!::ChartSetInteger(this.ID(),CHART_COLOR_CHART_UP,colour))
     {
      CMessage::ToLog(DFUN,::GetLastError(),true);
      return false;
     }
   this.SetProperty(CHART_PROP_COLOR_CHART_UP,colour);
   if(redraw)
      ::ChartRedraw(this.ID());
   return true;
  }
//+-----------------------------------------------------------------------+
//|Set the color of down bar, its shadow and border of bearish candle body|
//+-----------------------------------------------------------------------+
bool CChartObj::SetColorDown(const color colour,const bool redraw=false)
  {
   ::ResetLastError();
   if(!::ChartSetInteger(this.ID(),CHART_COLOR_CHART_DOWN,colour))
     {
      CMessage::ToLog(DFUN,::GetLastError(),true);
      return false;
     }
   this.SetProperty(CHART_PROP_COLOR_CHART_DOWN,colour);
   if(redraw)
      ::ChartRedraw(this.ID());
   return true;
  }
//+------------------------------------------------------------------+
//| Set the color of the chart line and Doji candles                 |
//+------------------------------------------------------------------+
bool CChartObj::SetColorLine(const color colour,const bool redraw=false)
  {
   ::ResetLastError();
   if(!::ChartSetInteger(this.ID(),CHART_COLOR_CHART_LINE,colour))
     {
      CMessage::ToLog(DFUN,::GetLastError(),true);
      return false;
     }
   this.SetProperty(CHART_PROP_COLOR_CHART_LINE,colour);
   if(redraw)
      ::ChartRedraw(this.ID());
   return true;
  }
//+------------------------------------------------------------------+
//| Set the color of bullish candle body                             |
//+------------------------------------------------------------------+
bool CChartObj::SetColorCandleBull(const color colour,const bool redraw=false)
  {
   ::ResetLastError();
   if(!::ChartSetInteger(this.ID(),CHART_COLOR_CANDLE_BULL,colour))
     {
      CMessage::ToLog(DFUN,::GetLastError(),true);
      return false;
     }
   this.SetProperty(CHART_PROP_COLOR_CANDLE_BULL,colour);
   if(redraw)
      ::ChartRedraw(this.ID());
   return true;
  }
//+------------------------------------------------------------------+
//| Set the color of bearish candle body                             |
//+------------------------------------------------------------------+
bool CChartObj::SetColorCandleBear(const color colour,const bool redraw=false)
  {
   ::ResetLastError();
   if(!::ChartSetInteger(this.ID(),CHART_COLOR_CANDLE_BEAR,colour))
     {
      CMessage::ToLog(DFUN,::GetLastError(),true);
      return false;
     }
   this.SetProperty(CHART_PROP_COLOR_CANDLE_BEAR,colour);
   if(redraw)
      ::ChartRedraw(this.ID());
   return true;
  }
//+------------------------------------------------------------------+
//| Set the Bid price line color                                     |
//+------------------------------------------------------------------+
bool CChartObj::SetColorBid(const color colour,const bool redraw=false)
  {
   ::ResetLastError();
   if(!::ChartSetInteger(this.ID(),CHART_COLOR_BID,colour))
     {
      CMessage::ToLog(DFUN,::GetLastError(),true);
      return false;
     }
   this.SetProperty(CHART_PROP_COLOR_BID,colour);
   if(redraw)
      ::ChartRedraw(this.ID());
   return true;
  }
//+------------------------------------------------------------------+
//| Set the Ask price line color                                     |
//+------------------------------------------------------------------+
bool CChartObj::SetColorAsk(const color colour,const bool redraw=false)
  {
   ::ResetLastError();
   if(!::ChartSetInteger(this.ID(),CHART_COLOR_ASK,colour))
     {
      CMessage::ToLog(DFUN,::GetLastError(),true);
      return false;
     }
   this.SetProperty(CHART_PROP_COLOR_ASK,colour);
   if(redraw)
      ::ChartRedraw(this.ID());
   return true;
  }
//+------------------------------------------------------------------+
//|Set the color of the price line of the last performed deal (Last) |
//+------------------------------------------------------------------+
bool CChartObj::SetColorLast(const color colour,const bool redraw=false)
  {
   ::ResetLastError();
   if(!::ChartSetInteger(this.ID(),CHART_COLOR_LAST,colour))
     {
      CMessage::ToLog(DFUN,::GetLastError(),true);
      return false;
     }
   this.SetProperty(CHART_PROP_COLOR_LAST,colour);
   if(redraw)
      ::ChartRedraw(this.ID());
   return true;
  }
//+------------------------------------------------------------------+
//|Set the color of stop order levels (Stop Loss and Take Profit)    |
//+------------------------------------------------------------------+
bool CChartObj::SetColorStops(const color colour,const bool redraw=false)
  {
   ::ResetLastError();
   if(!::ChartSetInteger(this.ID(),CHART_COLOR_STOP_LEVEL,colour))
     {
      CMessage::ToLog(DFUN,::GetLastError(),true);
      return false;
     }
   this.SetProperty(CHART_PROP_COLOR_STOP_LEVEL,colour);
   if(redraw)
      ::ChartRedraw(this.ID());
   return true;
  }
//+------------------------------------------------------------------+
//| Set the left coordinate of the undocked chart                    |
//| relative to the virtual screen                                   |
//+------------------------------------------------------------------+
bool CChartObj::SetFloatLeft(const int value,const bool redraw=false)
  {
   ::ResetLastError();
   if(!::ChartSetInteger(this.ID(),CHART_FLOAT_LEFT,value))
     {
      CMessage::ToLog(DFUN,::GetLastError(),true);
      return false;
     }
   this.SetProperty(CHART_PROP_FLOAT_LEFT,value);
   if(redraw)
      ::ChartRedraw(this.ID());
   return true;
  }
//+------------------------------------------------------------------+
//| Set the top coordinate of the undocked chart                     |
//| relative to the virtual screen                                   |
//+------------------------------------------------------------------+
bool CChartObj::SetFloatTop(const int value,const bool redraw=false)
  {
   ::ResetLastError();
   if(!::ChartSetInteger(this.ID(),CHART_FLOAT_TOP,value))
     {
      CMessage::ToLog(DFUN,::GetLastError(),true);
      return false;
     }
   this.SetProperty(CHART_PROP_FLOAT_TOP,value);
   if(redraw)
      ::ChartRedraw(this.ID());
   return true;
  }
//+------------------------------------------------------------------+
//| Set the right coordinate of the undocked chart                   |
//| relative to the virtual screen                                   |
//+------------------------------------------------------------------+
bool CChartObj::SetFloatRight(const int value,const bool redraw=false)
  {
   ::ResetLastError();
   if(!::ChartSetInteger(this.ID(),CHART_FLOAT_RIGHT,value))
     {
      CMessage::ToLog(DFUN,::GetLastError(),true);
      return false;
     }
   this.SetProperty(CHART_PROP_FLOAT_RIGHT,value);
   if(redraw)
      ::ChartRedraw(this.ID());
   return true;
  }
//+------------------------------------------------------------------+
//| Set the bottom coordinate of the undocked chart                  |
//| relative to the virtual screen                                   |
//+------------------------------------------------------------------+
bool CChartObj::SetFloatBottom(const int value,const bool redraw=false)
  {
   ::ResetLastError();
   if(!::ChartSetInteger(this.ID(),CHART_FLOAT_BOTTOM,value))
     {
      CMessage::ToLog(DFUN,::GetLastError(),true);
      return false;
     }
   this.SetProperty(CHART_PROP_FLOAT_BOTTOM,value);
   if(redraw)
      ::ChartRedraw(this.ID());
   return true;
  }
//+------------------------------------------------------------------+
//| Set the value of zeroth bar shift                                |
//| from the right edge in %                                         |
//+------------------------------------------------------------------+
bool CChartObj::SetShiftSize(const double value,const bool redraw=false)
  {
   double size=(value<10.0 ? 10.0 : value>50.0 ? 50.0 : value);
   ::ResetLastError();
   if(!::ChartSetDouble(this.ID(),CHART_SHIFT_SIZE,size))
     {
      CMessage::ToLog(DFUN,::GetLastError(),true);
      return false;
     }
   this.SetProperty(CHART_PROP_SHIFT_SIZE,size);
   if(redraw)
      ::ChartRedraw(this.ID());
   return true;
  }
//+------------------------------------------------------------------+
//| Set the location of the chart fixed position                     |
//| from the left edge in %                                          |
//+------------------------------------------------------------------+
bool CChartObj::SetFixedPosition(const double value,const bool redraw=false)
  {
   double pos=(value<0 ? 0 : value>100.0 ? 100.0 : value);
   ::ResetLastError();
   if(!::ChartSetDouble(this.ID(),CHART_FIXED_POSITION,pos))
     {
      CMessage::ToLog(DFUN,::GetLastError(),true);
      return false;
     }
   this.SetProperty(CHART_PROP_FIXED_POSITION,pos);
   if(redraw)
      ::ChartRedraw(this.ID());
   return true;
  }
//+------------------------------------------------------------------+
//| Set the fixed chart maximum                                      |
//+------------------------------------------------------------------+
bool CChartObj::SetFixedMaximum(const double value,const bool redraw=false)
  {
   ::ResetLastError();
   if(!::ChartSetDouble(this.ID(),CHART_FIXED_MAX,value))
     {
      CMessage::ToLog(DFUN,::GetLastError(),true);
      return false;
     }
   this.SetProperty(CHART_PROP_FIXED_MAX,value);
   if(redraw)
      ::ChartRedraw(this.ID());
   return true;
  }
//+------------------------------------------------------------------+
//| Set the fixed chart minimum                                      |
//+------------------------------------------------------------------+
bool CChartObj::SetFixedMinimum(const double value,const bool redraw=false)
  {
   ::ResetLastError();
   if(!::ChartSetDouble(this.ID(),CHART_FIXED_MIN,value))
     {
      CMessage::ToLog(DFUN,::GetLastError(),true);
      return false;
     }
   this.SetProperty(CHART_PROP_FIXED_MIN,value);
   if(redraw)
      ::ChartRedraw(this.ID());
   return true;
  }
//+------------------------------------------------------------------+
//| Set the value of the scale in points per bar                     |
//+------------------------------------------------------------------+
bool CChartObj::SetPointsPerBar(const double value,const bool redraw=false)
  {
   ::ResetLastError();
   if(!::ChartSetDouble(this.ID(),CHART_POINTS_PER_BAR,value))
     {
      CMessage::ToLog(DFUN,::GetLastError(),true);
      return false;
     }
   this.SetProperty(CHART_PROP_POINTS_PER_BAR,value);
   if(redraw)
      ::ChartRedraw(this.ID());
   return true;
  }
//+------------------------------------------------------------------+
//| Set the comment on the chart                                     |
//+------------------------------------------------------------------+
bool CChartObj::SetComment(const string comment,const bool redraw=false)
  {
   ::ResetLastError();
   if(!::ChartSetString(this.ID(),CHART_COMMENT,comment))
     {
      CMessage::ToLog(DFUN,::GetLastError(),true);
      return false;
     }
   this.SetProperty(CHART_PROP_COMMENT,comment);
   if(redraw)
      ::ChartRedraw(this.ID());
   return true;
  }
//+------------------------------------------------------------------+
//| Set the height of the specified chart in pixels                  |
//+------------------------------------------------------------------+
bool CChartObj::SetWindowHeightInPixels(const int height,const int sub_window,const bool redraw=false)
  {
   ::ResetLastError();
   if(!::ChartSetInteger(this.ID(),CHART_HEIGHT_IN_PIXELS,sub_window,height))
     {
      CMessage::ToLog(DFUN,::GetLastError(),true);
      return false;
     }
   if(redraw)
      ::ChartRedraw(this.ID());
   return true;
  }
//+------------------------------------------------------------------+
//| Set the chart symbol                                             |
//+------------------------------------------------------------------+
bool CChartObj::SetSymbol(const string symbol)
  {
   ::ResetLastError();
   if(!::ChartSetSymbolPeriod(this.ID(),symbol,this.Timeframe()))
     {
      CMessage::ToLog(DFUN,::GetLastError(),true);
      return false;
     }
   this.SetProperty(CHART_PROP_SYMBOL,symbol);
   this.m_digits=(int)::SymbolInfoInteger(this.Symbol(),SYMBOL_DIGITS);
   return true;
  }
//+------------------------------------------------------------------+
//| Set the chart period                                             |
//+------------------------------------------------------------------+
bool CChartObj::SetTimeframe(const ENUM_TIMEFRAMES timeframe)
  {
   ::ResetLastError();
   if(!::ChartSetSymbolPeriod(this.ID(),this.Symbol(),timeframe))
     {
      CMessage::ToLog(DFUN,::GetLastError(),true);
      return false;
     }
   this.SetProperty(CHART_PROP_TIMEFRAME,timeframe);
   return true;
  }
//+------------------------------------------------------------------+
Die Methoden sind identisch mit den oben betrachteten privaten Methoden und haben die gleiche Logik, daher überlasse ich sie Ihnen zum Studium. Wenn Sie Fragen haben, können Sie diese gerne in den Kommentaren unten stellen.
Wenn Sie Fragen haben, können Sie diese gerne in den Kommentaren unten stellen. Damit ist die Erstellung des Chart-Objekts abgeschlossen.
Test
Für den Test verwende ich den EA aus dem vorherigen Artikel und speichere ihn im neuen Ordner \MQL5\Experts\TestDoEasy\Part67\ als TestDoEasyPart67.mq5.
Wir öffnen drei Charts mit unterschiedlichen Instrumenten. Der EA soll auf dem ersten arbeiten, während die beiden anderen einfach geöffnet bleiben. Beim ersten Start liest der EA alle Charts ein, erstellt die entsprechenden Chart-Objekte, fügt sie der temporär erstellten Liste hinzu und liest die erstellte Liste, die die Kurzbeschreibungen der Chart-Objekte anzeigt, aus. Für den allerersten Chart, auf dem der EA arbeitet, wird die vollständige Beschreibung des Chartobjekts angezeigt.
Die Klasse der Signale ja jetzt über das Hauptobjekt der CEngine-Bibliothek eingebunden, anstelle einer Zeile, die die MQL5-Signalobjektklasse einbindet.
//|                                             TestDoEasyPart66.mq5 |
//|                        Copyright 2021, MetaQuotes Software Corp. |
//|                             https://mql5.com/en/users/artmedia70 |
//+------------------------------------------------------------------+
#property copyright "Copyright 2021, MetaQuotes Software Corp."
#property link      "https://mql5.com/en/users/artmedia70"
#property version   "1.00"
//--- includes
#include <DoEasy\Engine.mqh>
#include <DoEasy\Objects\MQLSignalBase\MQLSignal.mqh>
//--- enums
include the chart object class file:
//|                                             TestDoEasyPart67.mq5 |
//|                        Copyright 2021, MetaQuotes Software Corp. |
//|                             https://mql5.com/en/users/artmedia70 |
//+------------------------------------------------------------------+
#property copyright "Copyright 2021, MetaQuotes Software Corp."
#property link      "https://mql5.com/en/users/artmedia70"
#property version   "1.00"
//--- includes
#include <DoEasy\Engine.mqh>
#include <DoEasy\Objects\Chart\ChartObj.mqh>
//--- enums
Im OnTick(), anstelle des Codeblocks für die Arbeit mit Signalen
//--- Search for available signals in the database and check the ability to subscribe to a signal by its name
   static bool done=false;
   //--- If the first launch and working with signals is enabled in EA custom settings
   if(InpUseMqlSignals && !done)
     {
      //--- Display the list of all free signals in the journal
      Print("");
      engine.GetSignalsMQL5Collection().PrintShort(true,false,true);
      //--- Get the list of free signals
      CArrayObj *list=engine.GetListSignalsMQL5Free();
      //--- If the list is obtained
      if(list!=NULL)
        {
         //--- Find a signal with the maximum growth in % in the list
         int index_max_gain=CSelect::FindMQLSignalMax(list,SIGNAL_MQL5_PROP_GAIN);
         CMQLSignal *signal_max_gain=list.At(index_max_gain);
         //--- If the signal is found
         if(signal_max_gain!=NULL)
           {
            //--- Display the full signal description in the journal
            signal_max_gain.Print();
            //--- If managed to subscribe to a signal
            if(engine.SignalsMQL5Subscribe(signal_max_gain.ID()))
              {
               //--- Set subscription parameters
               //--- Enable copying deals by subscription
               engine.SignalsMQL5CurrentSetSubscriptionEnableON();
               //--- Set synchronization without the confirmation dialog
               engine.SignalsMQL5CurrentSetConfirmationsDisableOFF();
               //--- Set copying Stop Loss and Take Profit
               engine.SignalsMQL5CurrentSetSLTPCopyON();
               //--- Set the market order slippage used when synchronizing positions and copying deals
               engine.SignalsMQL5CurrentSetSlippage(2);
               //--- Set the percentage for converting deal volume
               engine.SignalsMQL5CurrentSetEquityLimit(50);
               //--- Set deposit limitations (in %)
               engine.SignalsMQL5CurrentSetDepositPercent(70);
               //--- Display subscription parameters in the journal
               engine.SignalsMQL5CurrentSubscriptionParameters();
              }
           }
        }
      done=true;
      return;
     }
   //--- If a signal subscription is active,  unsubscribe
   if(engine.SignalsMQL5CurrentID()>0)
     {
      engine.SignalsMQL5Unsubscribe();
     }
//---
ergänzen wir den Codeblock für die Arbeit mit Chart-Objekten:
//+------------------------------------------------------------------+
//| Expert tick function                                             |
//+------------------------------------------------------------------+
void OnTick()
  {
//--- Handle the NewTick event in the library
   engine.OnTick(rates_data);

//--- If working in the tester
   if(MQLInfoInteger(MQL_TESTER))
     {
      engine.OnTimer(rates_data);   // Working in the timer
      PressButtonsControl();        // Button pressing control
      engine.EventsHandling();      // Working with events
     }

//--- If the trailing flag is set
   if(trailing_on)
     {
      TrailingPositions();          // Trailing positions
      TrailingOrders();             // Trailing pending orders
     }

//--- If it is the first launch
   static bool done=false;
   if(!done)
     {
      //--- Create the list object for storing chart objects
      CArrayObj *list=new CArrayObj();
      if(list==NULL)
         return;
      //--- Declare the variables and get the first chart ID
      long currChart,prevChart=ChartFirst();
      int i=0;
      //--- Create the chart object and add it to the list
      CChartObj *chart_first=new CChartObj(prevChart);
      list.Add(chart_first);
      //--- In the loop by the total number of terminal charts (not more than 100)
      while(i<CHARTS_MAX)
        {
         //--- based on the previous one, get the new chart
         currChart=ChartNext(prevChart);
         //--- When reaching the end of the chart list, complete the loop
         if(currChart<0) break;
         //--- Create the chart object based on the current chart ID in the loop and add it to the list
         CChartObj *chart=new CChartObj(currChart);
         list.Add(chart);
         //--- remember the current chart ID for ChartNext() and increase the loop counter
         prevChart=currChart;
         i++;
        }
      Print("");
      //--- From the filled list in the loop, receive the next chart object and display its short description
      int total=list.Total();
      for(int j=0;j<total;j++)
        {
         CChartObj *chart_obj=list.At(j);
         chart_obj.PrintShort();
        }
      Print("");
      //--- Display the full description of the very first chart
      chart_first=list.At(0);
      chart_first.Print();
      //--- Destroy the list of chart objects
      delete list;
      done=true;
     }
//---
  }
//+------------------------------------------------------------------+
Die gesamte Logik ist im Code beschrieben und bedarf keiner weiteren Erklärungen. Wenn Sie Fragen haben, können Sie diese gerne in den Kommentaren unten stellen.
Das ist alles, was ich im aktuellen Artikel tun wollte.
Kompilieren Sie den EA, öffnen Sie drei Charts im Terminal und starten Sie den EA auf dem ersten von ihnen, während Sie in den Parametern vorsorglich "Nur mit dem aktuellen Symbol und Zeitrahmen arbeiten" angeben:
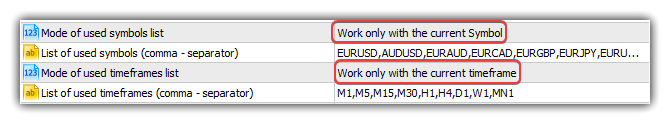
Während des ersten Ticks erzeugt der EA drei Chart-Objekte und zeigt neben den Meldungen über die Initialisierung verschiedener Bibliotheksklassen auch kurze Beschreibungen der drei erzeugten Chart-Objekte an:
Chart window EURUSD H4 ID: 131733844391938630, HWND: 918600
Chart window AUDUSD H1 ID: 131733844391938632, HWND: 1182638
Chart window GBPUSD H4 ID: 131733844391938633, HWND: 1705036
Anschließend die vollständige Beschreibung aller Eigenschaften des Chart-Objekts, das das erste Terminal-Chart beschreibt:
============= The beginning of the parameter list (Chart window EURUSD H4) =============
Chart ID: 131733844391938630
Timeframe: H4
Drawing attributes of a price chart: Yes
Object "Chart": No
Chart on top of other charts: No
Accessing the context menu by pressing the right mouse button: Yes
Accessing the "Crosshair tool" by pressing the middle mouse button: Yes
Scrolling the chart horizontally using the left mouse button: Yes
Sending messages about mouse wheel events to all mql5 programs on a chart: No
Send notifications of mouse move and mouse click events to all mql5 programs on a chart: No
Send a notification of an event of new object creation to all mql5-programs on a chart: No
Send a notification of an event of object deletion to all mql5-programs on a chart: No
Chart type: Display as Japanese candlesticks
Price chart in the foreground: No
Price chart indent from the right border: Yes
Automatic moving to the right border of the chart: Yes
Managing the chart using a keyboard: Yes
Allowed to intercept Space and Enter key presses on the chart to activate the quick navigation bar: Yes
Scale: 2
Fixed scale mode: No
Scale 1:1 mode: No
Scale to be specified in points per bar: No
Display a symbol ticker in the upper left corner: Yes
Display OHLC values in the upper left corner: Yes
Display Bid values as a horizontal line in a chart: Yes
Display Ask values as a horizontal line in a chart: Yes
Display Last values as a horizontal line in a chart: No
Display vertical separators between adjacent periods: No
Display grid in the chart: No
Display volume in the chart: Tick volumes
Display textual descriptions of objects: Yes
The number of bars on the chart that can be displayed: 96
The total number of chart windows, including indicator subwindows: 1
Chart window handle: 918600
Number of the first visible bar in the chart: 95
Chart width in bars: 117
Chart width in pixels: 466
Chart background color: clrWhite
Color of axes, scales and OHLC line: clrBlack
Grid color: clrSilver
Color of volumes and position opening levels: clrGreen
Color for the up bar, shadows and body borders of bull candlesticks: clrBlack
Color for the down bar, shadows and body borders of bear candlesticks: clrBlack
Line chart color and color of "Doji" Japanese candlesticks: clrBlack
Body color of a bull candlestick: clrWhite
Body color of a bear candlestick: clrBlack
Bid price level color: clrLightSkyBlue
Ask price level color: clrCoral
Line color of the last executed deal price (Last): clrSilver
Color of stop order levels (Stop Loss and Take Profit): clrOrangeRed
Displaying trade levels in the chart (levels of open positions, Stop Loss, Take Profit and pending orders): Yes
Permission to drag trading levels on a chart with a mouse: Yes
Showing the time scale on a chart: Yes
Showing the price scale on a chart: Yes
Showing the "One click trading" panel on a chart: No
Chart window is maximized: No
Chart window is minimized: No
The chart window is docked: Yes
The left coordinate of the undocked chart window relative to the virtual screen: 0
The top coordinate of the undocked chart window relative to the virtual screen: 0
The right coordinate of the undocked chart window relative to the virtual screen: 0
The bottom coordinate of the undocked chart window relative to the virtual screen: 0
------
The size of the zero bar indent from the right border in percents: 18.63
Chart fixed position from the left border in percent value: 0.00
Fixed  chart maximum: 1.22650
Fixed  chart minimum : 1.17770
Scale in points per bar: 1.00
Chart minimum: 1.17770
Chart maximum: 1.22650
------
Text of a comment in a chart: ""
The name of the Expert Advisor running on the chart: "TestDoEasyPart67"
The name of the script running on the chart: ""
Symbol: "EURUSD"
============= End of the parameter list (Chart window EURUSD H4) =============
Was kommt als Nächstes?
Im nächsten Artikel werde ich die Funktionen des Chart-Objekts erweitern, indem ich Unterfenster-Objekte dafür anlege und die Chart-Objekt-Kollektion erstelle.
Alle Dateien der aktuellen Version der Bibliothek sind unten zusammen mit der Test-EA-Datei für MQL5 zum Testen und Herunterladen angehängt.
Ich empfehle nicht, Chart-Objekte in ihrem aktuellen Zustand in Ihrer Arbeit zu verwenden, da sie weiter verändert werden sollen.
Ihre Fragen und Vorschläge schreiben Sie bitte in den Kommentarteil.
*Frühere Artikel dieser Serie:
Preise in der DoEasy-Bibliothek (Teil 62): Aktualisieren der Tick-Serien in Echtzeit, Vorbereitung für die Arbeit mit Markttiefe
Preise in der DoEasy-Bibliothek (Teil 63): Markttiefe und deren abstrakte Anforderungsklasse
Preise in der DoEasy-Bibliothek (Teil 64): Markttiefe, Klassenobjekte für Schnappschüsse der Markttiefe und der Schnappschuss-Reihen
Preise und Signale in der DoEasy-Bibliothek (Teil 65): Kollektion der Markttiefe und die Klasse für die Arbeit mit MQL5.com- Signalen
Andere Klassen in der Bibliothek DoEasy (Teil 66): MQL5.com die Kollektionsklasse der Signale
Übersetzt aus dem Russischen von MetaQuotes Ltd.
Originalartikel: https://www.mql5.com/ru/articles/9213
Warnung: Alle Rechte sind von MetaQuotes Ltd. vorbehalten. Kopieren oder Vervielfältigen untersagt.
Dieser Artikel wurde von einem Nutzer der Website verfasst und gibt dessen persönliche Meinung wieder. MetaQuotes Ltd übernimmt keine Verantwortung für die Richtigkeit der dargestellten Informationen oder für Folgen, die sich aus der Anwendung der beschriebenen Lösungen, Strategien oder Empfehlungen ergeben.


 Neuronale Netzwerke leicht gemacht (Teil 13): Batch-Normalisierung
 Brute-Force-Ansatz zur Mustersuche (Teil IV): Minimale Funktionalität
- Freie Handelsapplikationen
- Über 8.000 Signale zum Kopieren
- Wirtschaftsnachrichten für die Lage an den Finanzmärkte
Sie stimmen der Website-Richtlinie und den Nutzungsbedingungen zu.