适用于MetaTrader 5的免费EA交易和指标 - 23

Trade Receiver Free is a free tool to copy trades/signals from multiple MT4/MT5 accounts. The provider account must use copier EA to send the signal. This version can be used on MT5 accounts only. For MT4 accounts, you must use Trade Receiver Free . Reference: - For MT4 receiver, please download Trade Receiver Free .
- For MT5 receiver, please download Trade Receiver Free MT5 .
- For cTrader receiver, please download Trade Receiver Free cTrader .
- If you only need copy from MT4 account to u
FREE
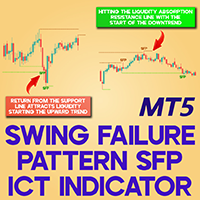
Swing Failure Pattern SFP ICT Indicator MT5 The Swing Failure Pattern (SFP) ICT Indicator for MT5 helps identify instances where the price tests a key support or resistance level, briefly surpasses it, and then swiftly pulls back, closing within the initial zone. This MetaTrader 5 tool marks liquidity zones using distinct green and orange lines. «Indicator Installation & User Guide» MT5 Indicator Installation | Swing Failure Pattern Sfp ICT Indicator MT4 | ALL Products By TradingFinderLab
FREE
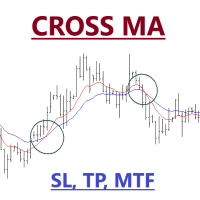
Expert Advisor of Cross two moving averages accompanied by stop loss, take profit and multi timeframes on each moving averages. You can change all the parameters contained in the moving averages
Please use as appropriate, hopefully can be useful and assist you in the transaction Don't forget to give a review if this product helps you
MA Method 0 = simple 1 = exponential 2 = smoothed 3 = LW
FREE

VWAP FanMaster:精准掌握回调策略!
VWAP FanMaster 是专为追求 精准入场点 和 高效回调交易 的交易者打造的终极指标。 它结合了 VWAP(加权平均成交价) 与 斐波那契扇形线 ,清晰标绘出市场中的重要价格区域。 主要特点 简单而强大 :只需移动垂直线,指标将自动绘制 VWAP 和 斐波那契扇形线 。
智能交易策略 :等待价格回到绘制的区域,以捕捉 完美回调 的支撑和阻力点。
高级可视化工具 :快速识别 价格共振区域 ,做出果断的交易决策。 为什么选择 VWAP FanMaster? 易于使用 ,适合新手和资深交易者。
提升交易精度 ,通过结合两种强大的分析工具。
改善风险管理 ,提供清晰一致的价格预测。 优化您的交易策略,用 VWAP FanMaster 轻松掌控市场!
FREE

This indicator automatically draws horizontal lines at 00s, 20s, 50s and 80s levels. If you trade ICT concepts and are an ICT Student, then you know that these levels are used as institutional support/resistance levels and/or fibonacci retracement anchor points. Features
Draws horizontal lines at 00, 20, 50 and 80 levels above and below current market price . Choose the amount of levels to show on chart Customizable line colors Recommended for forex currency pairs. Saves time looking for thes
FREE

One of the best trend indicators available to the public. Trend is your friend. Works on any pair, index, commodities, and cryptocurrency Correct trend lines Multiple confirmation lines Bollinger Bands trend confirmation Trend reversal prediction Trailing stop loss lines Scalping mini trends Signals Alerts and Notifications Highly flexible Easy settings Let me know in the reviews section what you think about it and if there are any features missing.
Tips: Your confirmation line will predict tre
FREE

EA for gold trading that best works on 15m time frame at Meta trader-5. Also can use for GBPUSD, AUDUSD, NZDUSD work on 30M chart. ***I have given you free please positive Review*** I will provide more customization option with more profitability**
It works best only in gold as it's best customization for gold. I am experienced trader as well as developer so here I have presented my strategy. It's build with Moving average and Parabolic Sar indicators. I used two moving average and Parabolic
FREE

The ICT Zone Arrow Indicator is an innovative tool developed based on ICT principles. It provides ease and efficiency in identifying key trading areas in the market. Based on the 'killzone' concept, this indicator provides traders with important support and resistance levels by identifying places where large changes in price direction could potentially occur.
The ICT Zone Arrow Indicator provides visual graphical markers that help traders identify trade entry zones with a high probability of s
FREE

Overview
The Period Breakout Indicator is a versatile tool designed for traders seeking to identify breakout opportunities based on customizable time periods. This indicator automatically determines the highest and lowest prices within a user-defined period, allowing you to tailor it precisely to your trading strategy. Key Features
Customizable Time Periods: Define the start and end times based on your preferred trading hours or any specific period. The indicator will then calculate the highes
FREE

FairPrice Donchain is a free, trend-following breakout Expert Advisor designed to capture significant market moves by dynamically computing Donchian channels. The algorithm identifies breakout signals by comparing the previous bar’s close against a channel derived from historical highs and lows—ensuring that trades are entered when clear trends emerge. Key features include: Dynamic Channel Calculation: The EA calculates the highest high and lowest low over a user-defined period, enabling it to d
FREE

The utility draws pivot levels for the selected timefram in classic method. Pivot = (high + close + low) / 3 R1 = ( 2 * Pivot) - low S1 = ( 2 * Pivot) - high R2 = Pivot + ( high - low ) R3 = high + ( 2 * (Pivot - low)) S2 = Pivot - (high - low) S3 = low - ( 2 * (high - Pivot)) you can change the timeframe, colors and fontsize. also you can change the text for the levels.
Have fun and give feedback...
FREE
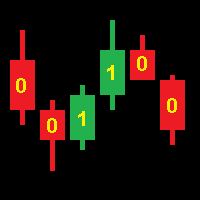
Operation of the CodEx Expert Advisor is based on patterns composed of consecutive candles. Positions are closed when opposite signals appear. Sequences of candles are encoded into an integer according to the following rule. The code number must be converted to binary form and the highest bit must be discarded. The resulting sequence of bits encodes a continuous sequence of candles, where 1 is a bullish candle, 0 is a bearish candle. The higher bits encode the earlier candles. For example: 19[10
FREE

The daily custom period seperator indicator allows you to draw period seperators for your lower time frame charts H1 and below. The period seperator gives you options to set different colors for: Weekend - saturday/sunday Monday and Friday Midweek - Tuesday to Thursday.
By default the indicator plots the period seperator line at 00:00 hours for the last 10 days.
Use Cases: The indicator can be used as a colourful alternative period seperator to the default MT5 period seperator. For those tha
FREE
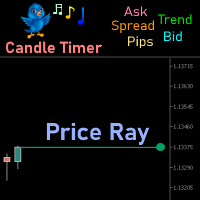
Price Ray indicator is a utility that will improve the way you trade. Primarily, it shows the Bid, Ask or Last price as a line ray which beams till the current candle, last visible chart candle or extended to all candle bars. The enhanced features in this indicator provide information in an area where you focus most, right next to the current candle. You can select text to be shown above or below the Price ray. The indicator is fully customizable, allowing it to fit any strategy requirements. Th
FREE

实时监控: https://www.mql5.com/en/signals/2252642 Quant ML DAX40 是一个为德国DAX指数相关工具设计的交易机器人,运行在H1时间框架上。 该机器人由机器学习算法生成和验证,重点关注策略的稳定性。具体特点如下: 仅使用基于ATR的固定止损和获利水平进行市场进入。 不使用追踪止损、保本、加仓、网格或在第一个头寸亏损时添加额外头寸。 在样本内(IS)和样本外(OOS)数据上进行了测试和验证。 此外,它还在超出IS和OOS范围的数据上进行了前向测试和手动验证。 该策略旨在年复一年地运作。 您还可以获取其他所有机器人,并构建一个强大的策略组合。如果您需要更多信息或有其他问题,请随时告知!
FREE

The TRIXe Indicator is the combination of the TRIX indicator (Triple Exponential Moving Average) with the addition of an EMA (Exponential Moving Average) signal. It provides signs of trend continuity and the start of a new trend.
The entry and exit points of operations occur when the indicator curves cross.
It performs better when combined with other indicators.
FREE

Script "Bar Close Timer Pro" is designed to display a real-time countdown to the closure of the current bar. This professional tool is tailored for traders working on any timeframe, enhancing chart analysis efficiency through precise time control. The script automatically adapts to the chart’s current timeframe (M1, H1, D1, etc.), calculating the remaining time until the candle closes. (Note: When switching timeframes, the script must be reattached to the chart.) Flexible display settings: Cus
FREE
Contador de tempo que iniciará outro candle. Este indicador conta o tempo que falta para terminal um candle e iniciar outro, funciona em qualquer tempo gráfico. Em seus parametros de configurações permite alterar o tamanho e a cor da fonte da letra. Gratis para teste por 15 dias. Contador de tempo do candle. Permite alterar o tamanho e a cor da letra. Após baixar o contador de tempo de candle Flash arraste para o gráfico, configure o tamanho da fonte desejado e as cores preferidas.
FREE

Candle cross MA is an indicator that works "silently", that is, drawing only a moving average on the chart.
It alerts you when the last candle cross with a moving average that you set. Alert is given only when the candle closes.
The moving average settings are fully customizable.
The indicator sends popup, and push notifications. You can also deactivate alerts when the chart is inactive. Are you the trend type? Do not miss another opportunity!
FREE

The Daily Highs and Lows Indicator is a versatile tool that combines support and resistance levels with real-time market dynamics. By incorporating previous daily highs and lows, it provides valuable insights into market psychology and identifies potential areas of price reversals or breakouts. With its ability to adapt to changing market conditions and customizable options, traders can stay ahead of trends and make informed decisions. This indicator is suitable for various trading styles and ti
FREE

The Moving Average Slope (MAS) subtracts the moving average level n-periods ago from the current moving average level. This way, the trend of the moving average can be drawn on the moving average line.
Features Observe uptrends and downtrends at a glance. The indicator is non-repainting. Returns buffer values for the trend of the moving average to be used as part of an EA. (see below)
Inputs Moving Average Period : The period of the moving average (MA). Slope Period : Number of periods between
FREE

Dynamic ATR TP Ratio The ATR Take Profit Manager Expert Advisor (EA) automatically calculates and adjusts the take profit (TP) level for your open trades, based on market volatility. This EA uses the Average True Range (ATR) indicator, which measures market volatility, to set your TP level, ensuring it adapts to the current market conditions. What is ATR? The Average True Range (ATR) is a technical indicator that shows the volatility of an asset over a specific period. It measures how much the
FREE

The traditional Money Flow Index indicator, this time, EA friendly . There are 3 buffers exposed that can be used by EAs to automatically analyze the Overbought and Oversold conditions of the quote. Just use the traditional iCustom() function to get these signals. This Money Flow Index calculation is based on the traditional Metaquote's MFI indicator.
SETTINGS
MFI Period Volume type to analyze (Real Volume or Ticks) Starting Overbought region Starting Oversold region
USING WITH EAs
Buffer #0:
FREE

Что показывает на графике индикатор TrendBreak? 1 — рисует линию тренда до максимальных максимумов в 100 баров. 2 — рисует линию тренда до максимальных максимумов в 30 баров. 3 — рисует линию тренда до максимальных минимумов в 100 баров. 4 — рисует линию тренда до максимальных минимумов в 30 баров. И эти линии указывают на сжатие тренда. Также индикатор выбирает 100-й бар и рисует ровную линию к максимуму и минимуму.
FREE

Hello, This indicator is a unique high reliability 7-in-1 multicurrency indicator comprising these sub-indicator’s: A Trend Power Crossover Indicator. A Percent Change Crossover Indicator. A Currency Overbought/Oversold Indicator. A Currency Deviation Indicator. A Currency Impulse Signal Indicator. A Trend Power Indicator. A Currency Volatility Indicator. The main advantage of this indicator is that it's reasoning by currency and not by currency pair. The values of each sub-indicator are calcula
FREE

The "YK-LOT-SIZE" is a custom indicator for MetaTrader 5 (MT5) that displays the total lot sizes and profits for both buy and sell positions on the current chart. Key features of the indicator: It calculates the total lot sizes for all open buy and sell positions of the current symbol. It calculates the total profits (including commissions and swaps) for all open buy and sell positions. The indicator displays the information on the chart using two lines of text: "BUY Lots: [total buy lots] | BUY
FREE

Indicator and Expert Adviser EA Available in the comments section of this product. Download with Indicator must have indicator installed for EA to work.
Mt5 indicator alerts for bollinger band and envelope extremes occurring at the same time. Buy signal alerts occur when A bullish candle has formed below both the lower bollinger band and the lower envelope Bar must open and close below both these indicators. Sell signal occur when A bear bar is formed above the upper bollinger band and upper
FREE

Elevate your trading with this Metatrader 5 expert – the Position Volume Calculator. This tool takes the guesswork out of risk management and profit optimization. Simply input your desired stop-loss points with dragging the stop-loss line, and let the expert advisor compute the optimal position volume for your trade. Plus, with customizable reward ratios, it's easier than ever to set your take-profit points for maximum gains. Trade with confidence and precision. Try the Position Volume Calculat
FREE

The indicator plots two lines by High and Low prices. The lines comply with certain criteria. The blue line is for buy. The red one is for sell. The entry signal - the bar opens above\below the lines. The indicator works on all currency pairs and time frames It can be used either as a ready-made trading system or as an additional signal for a custom trading strategy. There are no input parameters. Like with any signal indicator, it is very difficult to use the product during flat movements. You
FREE

The Chandelier Exit Indicator for MT5 is a powerful tool designed to help traders manage trades by dynamically adjusting stop-loss levels based on market volatility. It is based on the Average True Range (ATR) and follows the trend, placing stop-loss levels above or below price action, depending on the trend direction. This makes it an effective tool for trend-following strategies, breakout trading, and risk management .
Key Features: • Dynamic Stop-Loss Placement – Adjusts stop-
FREE
A system with steady ROI > 10% a month like clockwork! Hi Lo Breakout strategy opens and closes trades based on the time of day in relation to the highs and lows of both yesturday and today. It will then trade out these prices using the trade management settings within user inputs. For best results see .set file at comment no2 . Features :
A purely mechanical system. Simply set and leave. No martingale or grid. Risks are small per trade. An optional automatic lot adjustment feature t
FREE

CANDLESTICK_MT5
A very interesting indicator of candlestick patterns, converted from the free version of the CANDLESTICK indicator for the MetaTrader4 terminal to the version for the MetaTrader5 terminal. In addition to candlestick patterns, it draws support and resistance lines, which are perfectly worked out by the price on the chart. It can work on any timeframe. Has simple settings. When converting, the logic of work and the design of the original CANDLESTICK indicator for the MT4 terminal
FREE

指数移动平均线(双重或三重)包络指标是一种技术分析工具,旨在帮助您识别金融市场中的趋势和潜在的逆转点。该指标为交易员提供了选择两种指数移动平均线的灵活性:双重指数移动平均线(DEMA)或三重指数移动平均线(TEMA)。
主要特点:
双重或三重指数移动平均线:根据您的分析偏好和需求,切换在DEMA和TEMA之间。 可定制的包络线:定义自己的带宽参数并调整包络线的外观以适应您的交易风格。 趋势识别:包络线有助于可视化市场趋势,从而更容易识别看涨和看跌趋势。 潜在的逆转点:价格触及包络线可能表明潜在的逆转点,使您能够做出明智的决策。 用户友好:该指标易于在您的MetaTrader 5平台上安装和使用。
立即免费下载此指标,提升您在MetaTrader 5中的技术分析能力!
FREE
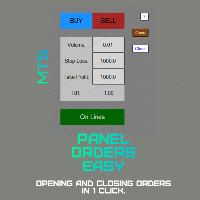
This utility (as an advisor) allows you to open and close positions in a couple of clicks. Panel Orders Easy is a Lite version of the Panel Orders program. Opening and closing positions in it is not available. You can see the full version among my other products.
The control panel , in the form of graphical objects, allows you to manage orders without the help of third-party programs.
Program Features: 1. There is a lot selection option. Either the usual fixed or a percentage of the depos
FREE

DESCRIPCION GENERAL * Bot automático * Bot de uso exclusivo de la plataforma binary.com donde se podemos encontrar los Sintéticos * Mercado de Sintéticos recomendado Range Break 200 * Deposito mínimo para el Bot 1 000 USD CONFIGURACION * No cambiar los valores de las Bandas de Bollinguer * En el parámetro TP_of_SL poner 100 * El stop loss es automático *Temporalidad de vela recomendada 1 minuto Como recomendación si quieres usarlo con menos capital se sugiere que cambies el parámetro de mu
FREE
The Expert Advisor recommended for trade on EUS/GBP M15. It is based on free indicator "UpdatedRSI", and Neuro networks AI. The robot calculates the market entry/exit points based on signals from indicator "UpdatedRSI". The trading volume for opening a position depends on results of previous trades. It is possible to limit the amount of risk (the AutoMM parameter). It uses an efficient trailing, which automatically adjusts the take profit and stop loss parameters to minimize losses. It also has
FREE

The advisor NewsCatcher Free opens trades when the price makes a reversal move from support and resistance levels. Market entries should be confirmed by the Relative Strength Index (RSI). The RSI is implemented as a tachometer. It is recommended to use this advisor in a highly volatile market after a political event or a release of major economic data.
You can use this advisor in the semi-automated mode (the RSI performs an information role) or in the fully automated mode (the RSI decides when t
FREE

TRADER JET 是一款完全自动化的专业交易机器人。 专为 GBPJPY 外汇市场设计。
EA 不需要参数配置。 准备开始研究 GBPJPY H1。 您只需要对该地块做出决定即可。
它包括一个智能系统,可以识别趋势并过滤市场噪音。 专家根据趋势方向下订单。
商品通道指数、MACD 信号、标准差和移动平均线是每个提供输入和输出订单的 MT5 平台上的三个指标。 使用 GBPJPY H1 的一年历史数据(2022-2023)对专家进行评估。
我测试了 2022 年 1 月至 2023 年 6 月期间 GBPJPY H1 平价的指标,起始资金为 2000 美元,手数为 0.10,最大点差为 30,结果如屏幕截图所示。
推荐:
EAMagic - EA 的神奇数字,允许顾问专门以其头寸进行操作。 每个图表必须具有唯一的值。
该 EA 不需要参数配置。
确定您已下载并测试了此平价英镑/日元 H1 时间范围的历史记录。
我建议使用 VPS 或始终连接到互联网的计算机。
推荐任何经纪人。
建议最低存款额 - 美分账户 1000 美元,手数 0.1
最大点差:30 点
FREE
Adaptive Regression - Free AI Trading Indicator Discover one of the most advanced tools on this entire platform, combining traditional statistical analysis with cutting-edge AI. This 100% free trading indicator is crafted for dedicated traders who appreciate simplicity, yet never compromise on sophistication.
Key Features : Self-learning regression bands that adapt to market volatility Single-layer neural network to prevent over-optimization - Enable Deep Learning in the inputs (= Tr
FREE

StopLevel 仪表控制 STOPLEVEL 水平。当液位发生变化时,它会发出警报信号。 STOPLEVEL - 设置止损订单的当前收盘价的最小抵消点数,或允许的最小止损/止盈点数。 STOPLEVEL 的零值意味着没有限制止损/止盈的最小距离,或者交易服务器使用外部机制进行动态水平控制,无法传输到终端。在第二种情况下,STOPLEVEL 实际上是“浮动的”。 指标设置: color_ - 级别的区域颜色 draw_bars - 用于显示级别区域的条数 width_price - 价格标签的厚度 仪表控制 STOPLEVEL 水平。当液位发生变化时,它会发出警报信号。 STOPLEVEL - 设置止损订单的当前收盘价的最小抵消点数,或允许的最小止损/止盈点数。 STOPLEVEL 的零值意味着没有限制止损/止盈的最小距离,或者交易服务器使用外部机制进行动态水平控制,无法传输到终端。在第二种情况下,STOPLEVEL 实际上是“浮动的”。 指标设置: color_ - 级别的区域颜色 draw_bars - 用于显示级别区域的条数 width_price - 价格标签的厚度
FREE

Sharing-Is-Caring Trade Copier
Features Local & Remote copy One tool can act as provider or receiver of trades Co-exist with other positions opened manually or from other expert advisors Can be stopped and restarted at any time without any issues such as deals getting closed mysteriously Copy same lot or adjust according to your balance and leverage Partial close/open Manage max funds to use One provider can copy to unlimited number of receivers One receiver can copy from unlimited number of p
FREE

TEVOL-Trailer 结合布林带和MACD技术来识别市场趋势和回调,提供了一种强大的和全面的交易策略。用户可以通过动态手数设置功能,设定风险资本的百分比,EA将根据当前账户余额自动计算出最佳手数。跟踪止损使用抛物线SAR进行动态调整,有效保护利润。此外,EA还配备了一个实时动态仪表盘,展示市场状况、EA的表现以及账户状态,帮助用户做出明智的交易决策。 最低推荐余额: $500
杠杆: 无最低限制
资产: 指数、货币和商品
账户类型: 净头寸 购买后,请联系以获取适用于日内交易和波段交易的设置文件。文件包含详细的优化参数,助力提升EA的性能。
如需了解更多信息或有任何疑问,请给 DM 留言。有关参数的更多信息或问题,请发送邮件至 DM。
关注我们的 " ALGO FORGE " 频道! 掌握最新的自动化交易策略、分析及算法交易的最新动态! 不要错过这个机会——立即优化您的交易之旅!
FREE

The Spots Indicator can be used for Entering and Exiting your trades based on the common candlestick patterns such as: engulfing, hanging man, doji etc. It is designed to publish desktop and mobile notification every time a signal is triggered. However, it is worth noting that this indicator is recommended to be used with other indicator for confirming the entries. It is best to use it with the Investment Castle Trend Lines indicator and the Supply and Demand indicator .
FREE

If you find this indicator useful, please take a moment to leave a review and a comment! Your feedback helps improve the product and keeps it free for everyone. Thank you! This code is a custom indicator designed for MetaTrader 5 that visually displays the main trading sessions (Sydney, Tokyo, London, and New York) on the chart. Here's a comprehensive explanation of its functionality: 1. Main Objectives of the Indicator Display Trading Sessions : The indicator marks and displays the time period
FREE

Free indicator to quickly detect trendline breakouts and high or low of a price range. It displays lines based on the highs and lows of prices, and also finds and displays inclined trend lines. As soon as the price goes beyond the line and the candlestick closes, the indicator signals this with an arrow (you can also enable an alert). This indicator is easy to use and also free. The number of candles for defining trend lines as well as the high and low of the trading range is configurable. It w
FREE

For those who feel that regular RSI is too fast and too noisy to be used on regular trades or in EAs and want to have an alternative to meter the Momentum of the Price, here is a solution presented on the great article of the Technical Analysis of Stocks & Commodities magazine (April, 2015), by Vitali Apirine, called: Slow Relative Strenght Index . Its reading is almost the same as the regular RSI, but its levels of Overbought and Oversold are 80 and 20 instead. SRSI is very powerful to show div
FREE

Full Automated Trading panel . it works on any trading instruments: Forex, Stocks, Futures, Indices, CFD, Bonds, Cryptocurrencies; interface minimization function; flexibility of use;
Join my channel and check video of it ===> https://t.me/Ash_TheTrader/4986
Features :
Auto SL and TP Auto Close partial Auto Trailing Session Time Alert Time of trading Alert Profit and Percentage and etc.
FREE

Se procuras um robô rápido, agressivo e de alta frequência , o Best Scalper 5min TF é uma das melhores opções. Projetado para timeframes ultra curtos (M5 – 5 minutos) , ele entra e sai de operações rapidamente, capitalizando nos pequenos movimentos do mercado. Este robô combina filtros de volatilidade, padrões de candles e suporte/resistência dinâmica para identificar as melhores oportunidades. Ele é otimizado para pares de moedas e índices altamente voláteis , como US100 e GOLD , onde os peque
FREE
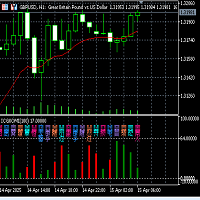
伏羲卦象双色震荡指示器功能及使用说明(V2.1) 伏羲卦象双色震荡指示器指标说明: (1)本卦象变化指标是根据中国古代文化中"易经"哲学的阴阳转化思想,融合金融交易K线图每一蜡烛图K线周期多空相互博弈的结果,用中国最古老的预测编码方法,以易经伏羲64卦象的形式,将卦象的每一爻的阴阳和蜡烛K线图的阴阳结合在一起,实时绘制在交易图表子窗口的每一根K线图的下方, 以表示未来的K线的走向趋势。 (2)指标在子窗口的左上侧只显示当前蜡烛K线所对应的卦数,非当前K线的卦象指标是在K线的每个蜡烛下方标注了对应的卦名。 (3)本指标同时又将主图中卦象的变化,再以卦数双色柱状图在子窗口绘制,更直观地标示每根蜡烛K线对应的卦象的形态变化,预示未来的可能走向. (3)本指标的重大创新意义: a:突破传统的三根或者两根K线的组合预测,而是用六根K线的组合装成卦象进行多空的预示。通过卦象的变化,交易者一定会有全新的交易灵感. B:与单纯的主图卦象指标不同,本指标的特点,直观且易于交易者实现报警提醒或者以此指标的信号进行EA交易系统的开发. (4)本指标适合所有时间框架.卦名卦象随K线的变化自动更新。 (5
FREE
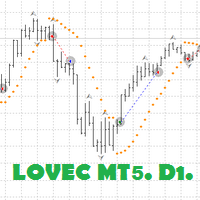
Robot Lovec MT5.
I offer you an Advisor, my own development.
Designed exclusively for working on the trend on the daily chart D1.
Suitable for indices, futures, commodities and bonds.
Entries are made exclusively at the opening of the candle, which gives the same ideal execution Exit from the transaction by a combination of conditions. The Advisor loves trends. Where it brings the main profit! No martingale, no averaging or order grids. Only one transaction, at one time. It is possible t
FREE

This is just a ADX with multi symbols, multi timeframes, and colors. features. different symbols and timeframes from the main chart. draw ADX and ADX moving average. easy to identify if ADX is above 25 or not. e asy to identify if ADX is above moving average or not. easy to identify the direction of the trend by color, not by DI line. unnecessary DI lines can be erased
FREE

This EA get all the opened postions on the current symbol and add SL and TP And also MoveSl to perfect value. Principle Small SL according to current bid or ask. Ex: If current SL is too big compared to the configured SL, move it. But never move a position SL Higher
The EA also go through all positions and activate trailing stops, so that you never lose any winning position.
FREE

本指标是一款众所周知的 MetaTrader 4 指标,现直接免费在互联网上提供。它完全不会重绘。 它实现了一类突破策略。箭头指示行情的方向。在 M15 或更高时间帧里使用此指标。
FREE
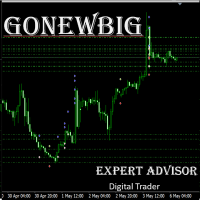
GoNewBig 是根據信號產生器做出交易決定後再根據現有的資金量調整下單的單量 設計目的希望所有參與交易的交易者,都能夠獲取合理的利潤
值得注意的是,過去的歷史回測匯或許會有相當大的利潤發生.但是將來的行情型態是不可知的.所以不要盲目地相信EA會創造出絕對的利潤,但也不要一昧地認為自動交易就是不可取的
特點
自適應的交易信號: 根據市場狀況自動調節信號產生的條件 簡單的設定方式: 只需簡單的設定即可. 單品種交易: 根據信號產生器做EURUSD單品種的交易 無華麗顯示面板: 將算力完全用在交易程序的計算 可以更高效續的執行工作 短期交易策略: 開單頻率及持倉時間一週 安全的風險控制: 在當前行情不例於持倉狀況時安全認損 不會早造成爆倉或是大量虧損
環境
使用時間框 H1 交易品種 EURUSD (品種必須列在報價清單上) 啟動資金使用1500美金即可運行 免費版只能交易EURUSD 正式版可以交易多品種 購買或是測試可以聯繫我取得適當的參數
運行淨值保持在2500美金以上 能更加確保交易帳戶的安全
參數
Magic : 自訂義EA持倉的辨識碼 Comm :
FREE
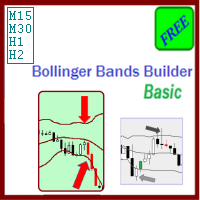
The Bollinger Bands Builder Basic expert advisor is a free and configurable trading strategy using the Bollinger Bands indicator as its primary signal provider technique.
Like its sibling products from the expert advisors group, this systems aims to ensure low drawdown and avoiding exposure to high risks through:
usage of automatically placed stop loss orders for all launched trades; allowing maximum 1 managed open trade at a given time, avoiding pressure on margin/deposit load; minimization o
FREE

HiperCube ADX Histogram is here!
Discount code for 25% off at Darwinex Zero: DWZ2328770MGM This indicators helps you to know if could be a strong trend in the market . ADX is a very popular and usefull indicator, so many top traders reccomends use it as filter to bad trades, or in combinations of other analysis.
With HiperCube ADX you will be a premium exoerience using a beautifula and great indicator for your trading.
FEATURES: Fully Customizable Custom Your Chart! Custom Color to Histogram I
FREE
The Ichimoku Wave EA is one of the most comprehensive free Expert Advisors, ideal for traders seeking a high-performance automated solution based on the Ichimoku Cloud indicator. With multiple strategies available, it provides a robust approach to identifying buy and sell opportunities, utilizing either fixed or dynamic lot sizes that automatically adjust based on account balance and desired risk. Its architecture is designed to protect the trader's capital, featuring a daily P/L limit that hal
FREE

本指标基于 Heiken Ashi 指标。它可帮助用户识别何处进行买入、卖出。当新信号出现时,它可发出提示和声音。它还具有发送邮件功能。您的邮件地址和 SMTP 服务器设置应该在 MetaTrader 5 的 "邮箱" 标栏里的设置窗口里指定。 蓝色向上箭头 = 买。 红色向下箭头 = 卖。 Line = 尾随终止。 您可以使用一款我的移动止损产品,来自动移动止损,并包括设置盈亏平衡。 ROMAN5 分形尾随终止 ROMAN5 抛物线SAR 尾随终止 ROMAN5 布林带尾随终止 ROMAN5 HeikenAshi 尾随终止 ROMAN5 均线尾随终止 ROMAN5 高级尾随终止
FREE

Introducing the "Super Trend Filter Oscillator," your ultimate trading companion designed to enhance your technical analysis and help you make informed decisions in the financial markets. This innovative oscillator is crafted to provide valuable insights into market trends and price movements, assisting traders like you in identifying potential entry and exit points. Features: Trend Identification: The Super Trend Filter Oscillator excels in detecting prevailing market trends, whether they are b
FREE

The Pirates MACD is a Momentum Indicator that shows us not just the Classical MACD, it also shows us high priority trades. the user has an option of selecting among several options the best settings that suits their trading style, even if one has no trading style, Pirates always find a way to survive hence the Pirates MACD is equipped with easy to understand tools. that reduce the strain on ones analysis giving them visual advantages over classical MACD techniques.
This product is made as an e
FREE

Close Positions Panel is a scalper’s best friend; specifically, those with an aggressive trading style, opening multiple positions in both buy and sell directions. This tool provides the possibility of closing positions with different combinations:
Close All:Closing all buy/ sell/ in profit/ and in loss positions
Close Buy: Closing all buy positions
Close Sell: Closing all sell positions
Close Profit: closing all po
FREE

如果您喜欢这个免费工具,请留下 5 星评级! 太感谢了 :) “风险管理助手”EA 集合是一套全面的工具,旨在通过有效管理各种市场条件下的风险来增强交易策略。 该系列由三个关键组件组成:平均、转换和对冲专家顾问,每个组件都针对不同的交易场景提供独特的优势。
该 EA 是市场上标准风险管理策略的发展
https://www.mql5.com/en/blogs/post/756961
1.“平均助手”EA: MT4: https://www.mql5.com/en/market/product/115468 MT5: https://www.mql5.com/en/market/product/115469 2.“切换助手”EA: MT4: https://www.mql5.com/en/market/product/115478 MT5: https://www.mql5.com/en/market/product/115428 3.“对冲助手”EA: MT4: https://www.mql5.com/en/market/product/115466 MT5: https://
FREE
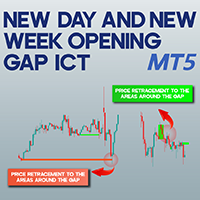
New Day and New Week Opening Gap ICT NWOG NDOG MT5 The New Day and New Week Opening Gap ICT NWOG NDOG MT5 indicator is a powerful and practical tool designed for traders using MetaTrader 5. It helps detect price gaps that emerge at the start of a new trading day or week, making them visible on the chart. When the market closes at the end of a session, the reopening price may differ from the previous close, leading to a price gap. This indicator marks weekly price gaps ( NWOG ) in red and daily p
FREE

Introducing the Ultimate MT5 Auto SL/TP Assistant EA – Your Trading, Simplified Tired of manually setting Stop Loss and Take Profit every time you place a trade? Our MT5 Expert Advisor is designed to automatically apply predefined SL and TP levels to any order you place – whether it's a market order, pending order, or a trade modified manually. Fast, accurate, and fully automated, this EA ensures consistent risk management without interrupting your trading flow. Just set your preferred SL/TP onc
FREE

Esse indicador é a combinação do RSI (IFR) com Média Móvel Simples aplicada o RSI em um único indicador para facilitar a criação de alguma estratégia. Fiz esse indicador para que um único indicador contenha os buffer necessários para implementar alguma EA.
Descrição dos Buffers para o EA,
Buffer 0 -> Valor do RSI Buffer 1 -> Valor da média móvel aplicada ao RSI
FREE
strategy description: - Detect underlying trend using the BxTrender indicator in daily time frame. - Trigger entry using supertrend indicator in M15 time frame. - Also use supertrend indicator to set SL and TP accordingly. EA setup - Nasdaq and other indices(like DAX40) are suggested to be traded. - Risk per trade is hard coded to 0.5%. - Risk:Reward ratio is hard coded to 1:1. - All indicators are being used with default setting. No optimization done. - You have the magic number option to use t
FREE

Ratio Indicator - User Guide
Special Deal! Leave a review and get the indicator Long & Short Cointegration Analyzer for free — just send me a message!
This Ratio indicator between assets allows you to monitor and trade the price relationship between two assets selected by the user. It calculates the ratio between the prices of two assets, referred to as Asset1 and Asset2 (e.g., "GBPUSD" and "EURUSD"), and plots a moving average of the ratio along with Bollinger Bands . These bands are used to
FREE

I present the well-known Fractal indicator.
Levels have been added to this indicator.
At the extreme points, you can see the continuation of the price line, which changes when the values of the Fractal indicator change.
The indicator is easy to use. The basic Fractal settings have been saved.
FractalLevels Parameters:
LeftBars - the number of bars on the left
RightBars - the number of bars on the right
FREE
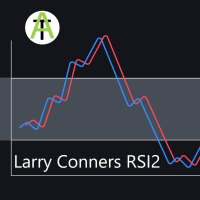
This MQL5 Expert Advisor is an adaption of the trading strategy made famous by trading legend Larry Conners. The EA essentially buys on the dips and sells on the rises. Buy Signal
Current candle is above the 55 EMA
RSI 2 period is below 10 Sell Signal
Current candle is below the 55 EMA
RSI 2 period is above 90 This strategy has been adapted into a scalping strategy. Default settings are for EURUSD 1H time-frame 2018/01/01 - 2020/05/30
FREE
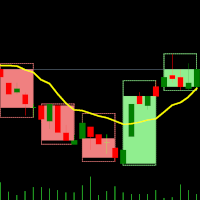
双时间框架指标 – 蜡烛嵌套蜡烛 概述 蜡烛嵌套蜡烛指标 是一款 多时间框架可视化工具 ,可在较低时间框架图表上叠加较高时间框架蜡烛图。无需频繁切换时间框架,交易者即可观察较小的蜡烛 如何嵌套在较大的蜡烛内 ,从而提升市场结构分析、趋势识别和交易精度。 该指标允许用户选择 基础(较低)时间框架 并应用 倍数 ,从而自动计算并绘制较高时间框架结构,使得交易者可以在一个图表上轻松分析多个时间周期。 指标工作原理 选择基础时间框架: 打开你希望使用的图表,例如 M1、M5、M10 等。 应用时间倍数: 设置一个倍数来确定较高的时间框架。 示例: M1 图表,倍数为 5 → 显示 M1 内嵌 M5 蜡烛。 M10 图表,倍数为 6 → 显示 M10 内嵌 H1 蜡烛。 绘制较高时间框架蜡烛: 指标将在较低时间框架图表上绘制较高时间框架蜡烛,并显示 开盘价、最高价、最低价、收盘价(OHLC) 。 每根 较高时间框架蜡烛 包括:
外部框 (High-Low): 代表该时间周期的最高价与最低价。
内部框 (Open-Close): 代表开盘价和收盘价。
实时更新: 当前蜡烛随着市场价格变
FREE
您知道为什么MetaTrader市场是出售交易策略和技术指标的最佳场所吗?不需要广告或软件保护,没有支付的麻烦。一切都在MetaTrader市场提供。
您错过了交易机会:
- 免费交易应用程序
- 8,000+信号可供复制
- 探索金融市场的经济新闻
注册
登录