YouTube'dan Mağaza ile ilgili eğitici videoları izleyin
Bir ticaret robotu veya gösterge nasıl satın alınır?
Uzman Danışmanınızı
sanal sunucuda çalıştırın
sanal sunucuda çalıştırın
Satın almadan önce göstergeyi/ticaret robotunu test edin
Mağazada kazanç sağlamak ister misiniz?
Satış için bir ürün nasıl sunulur?
MetaTrader 5 için ücretsiz Uzman Danışmanlar ve göstergeler - 23
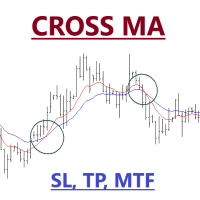
Expert Advisor of Cross two moving averages accompanied by stop loss, take profit and multi timeframes on each moving averages. You can change all the parameters contained in the moving averages
Please use as appropriate, hopefully can be useful and assist you in the transaction Don't forget to give a review if this product helps you
MA Method 0 = simple 1 = exponential 2 = smoothed 3 = LW
FREE

Strangely enough, everyone seems to have their own idea of how you should measure support and resistance. Not every support and resistance zone is strong. The strongest support or resistance levels will more often than not be with trend . What this means is, if we are in a bull trend, pullback levels to support will more often than not be ‘stronger‘ than resistance levels above. These expert advisors use several mathematical models and statistical models to determine the strongest support and r
FREE
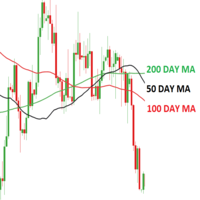
Working with pending orders Buy Stop and Sell Stop. A channel of two indicators iMA (Moving Average, MA).
Input parameters Take Profit - Take Profit; Trailing Stop - trailing; Trailing Step - trailing step; Lots - lot size is set manually (a NECESSARY CONDITION: Risk must be equal to zero!); Risk - lot size is calculated automatically, in risk percents per trade (a NECESSARY CONDITION: "Lots" must be equal to zero!); Difference - offsets from the channel borders; Expert Every T
FREE

Candle cross MA is an indicator that works "silently", that is, drawing only a moving average on the chart.
It alerts you when the last candle cross with a moving average that you set. Alert is given only when the candle closes.
The moving average settings are fully customizable.
The indicator sends popup, and push notifications. You can also deactivate alerts when the chart is inactive. Are you the trend type? Do not miss another opportunity!
FREE
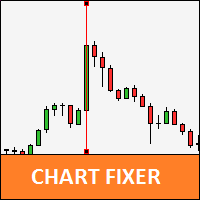
Utility that allows you to set a specific date on the chart. You set a reference point through a vertical line and it is done! When changing timeframes, the reference point is always positioned at the center of the chart. That way you can analyze a specific date at different timeframes easily, without losing the reference point or scrolling the chart to it.
This is a product developed by Renato Fiche Junior and available to all MetaTrader 5 users!
Partners: "Águia Traders" team ( Eagle Trad
FREE

Looks for strong price movements and draws levels upon their completion.
You determine the strength of the movement yourself by specifying in the settings the number of points and the number of candles of the same color in a row in one direction.
There are 2 types of building in the settings: extrenum - high / low close - close price You can also adjust the number of displayed levels and the number of candles for calculations.
By default, the settings indicate 5 levels for 360 candles.
FREE

This particular moving average adjusts to the average number of highest highs and lowest lows recorded over a defined period, thereby accommodating changes in trend strength. Utilizing this moving average in a crossover system or as dynamic support/resistance can yield compelling outcomes. Configuration: Length: Determines the indicator's period, with larger values delivering smoother outcomes. Application: The Dynamic Trend Adaptive Moving Average functions akin to conventional moving averages,
FREE
Use this expert advisor whose strategy is essentially based on the Relative Strength Index (RSI) indicator as well as a personal touch.
Other free expert advisors are available in my personal space as well as signals, do not hesitate to visit and leave a comment, it will make me happy and will make me want to offer content. Expert advisors currently available: LVL Creator LVL Creator Pro LVL Bollinger Bands
Trading is not a magic solution, so before using this expert on a live account, carr
FREE

Main: Not martingale, not a grid; Working on all symbols;
Signals: There is a good rational algorithm. Work of two indicators: Stochastic and OsMA (you can set a separate Timeframe for each indicator)
Stop Loss/Take Profit: There is a good money management system (there are several type for trailing stop loss); There is virtual levels of Stop Loss / Take Profit; There is smart lot (percent by risk) or fix lot
Important: EA can work on closed candles, and on current candles; Quickly o
FREE

What are Donchian Channels? Donchian Channels are three lines generated by moving average calculations that comprise an indicator formed by upper and lower bands around a mid-range or median band. The upper band marks the highest price of a security over N periods while the lower band marks the lowest price of a security over N periods. The area between the upper and lower bands represents the Donchian Channel. Career futures trader Richard Donchian developed the indicator in the mid-twentieth c
FREE

Indicator that allows the maximum and minimum of days to be marked, with real time update, closing of the previous day and beginning of the day. It is possible to define which markings will be made and also the colors for each mark. The values of each tick are displayed in the upper left corner of the screen, below the trading panel within the chart. Maximum and Minimum of the Day and Closing of the Previous Day are marked with a horizontal line, while the beginning of the day with a
FREE

//////////////////////////////////////////////// //////////////////////////////////
An improved version of the standard Bulls Power and Bears Power indicators.
Now it's two in one.
The setup is simple - you just need to specify the period. It is also very easy to understand the readings of this indicator, a signal above zero is a buy, and below it is a sell.
//////////////////////////////////////////////// ///////////////////////////////////
I hope this indicator will be very useful t
FREE

1. Bu belgeler sistemi yerel bir belgeler sistemidir, yani gönderici ve alıcı aynı bilgisayarda çalışmalı. Çünkü MT4 / 5 hesabı birçok bilgisayarlar üzerinde aynı and a girebilir, sadece okuyulan hesap parolanı müşteriye göndermelisiniz. Yerel ticaret çok hızlı ve stabil, çünkü bu ağı dahil etmez.
2. Şimdilik alıcı sonu. Çizelgeyi yüklerken, giriş parametrosinde "senderaaccount" değiştirmeniz gerekiyor, başlangıç sonun MT4 / MT5 hesabına normalde çalışmak için. Ayrıca, yayınlama sonunu yüklem
FREE

This indicator is based on the Fractals indicator. It helps the user identifying whether to buy or sell. It comes with an alert that will sound whenever a new signal appears. It also features an email facility. Your email address and SMTP Server settings should be specified in the settings window of the "Mailbox" tab in your MetaTrader 5. Blue arrow up = Buy. Red arrow down = Sell. Line = Trailing Stop. You can use one of my Trailing Stop products that automatically move the Stop Loss and includ
FREE

Genaral: Not martingale, not a grid; Use on EURUSD Use on M5 EA was opimized only on 2020 year
Signals: There is a good rational algorithm. Work of 3 indicators: WRP, DeMarker, CCI (from 3 timeframes) (you can set a separate Timeframe for each indicator)
Stop Loss/Take Profit: There is a good money management system (there are several type for trailing stop loss); There is virtual levels of Stop Loss / Take Profit; There is smart lot (percent by risk) or fix lot
Important: EA can work
FREE

This is an EA that is suitable for those of you who want to explore the power of the Moving Average indicator. We created this application to show the advantages of the Moving Average.
MA Period and MA Shift settings are available, so the user can adjust the EA's performance by himself, to suit his needs. The recommended TFs are M1 and M5. Recommended assets are XAU (gold) and GBP.
Because MT5 no longer provides options for Buy_only or Sell_only, we provide the facility to set these trading
FREE

Hesap net değer koruma aracı, hesabınızın net değerini korumak için gereken bir araçtır. Hesabınız aynı anda birden fazla otomatik ticaret programını çalıştırdığında, özellikle gece uyurken, beklenmedik kayıplara uğrayabilirsiniz, çünkü siyah kuğu olayları veya ticaret programı arızaları meydana gelebilir. Bu araç, bu tür sorunlardan kaçınmanıza etkili bir şekilde yardımcı olacaktır.
Ayarlaması oldukça basittir, sadece korunmasını istediğiniz miktarı girmeniz yeterlidir. Mevcut hesap net değe
FREE

Gerçek Dönen Top Göstergesi
Dönen topaçın gerçek anlamı olan dengeli gövde ve fitil yükseklik oranı ile grafik üzerinde doğru topacı algılar ve onu Hammers and Doji veya Null Candlestick'ten ayırır.
Bu gösterge, grafikte bulunan topaç sayısına bir kanat simgesi çizer.
Ayarlar şunları içerir:
Çubuk Sayısı : Aramayı çubuk sayısına göre ayarlamak için
Simgenin Rengi: simgenin rengini değiştir
Simge kodu: simge için kanatların kodunu değiştirin
FREE

Trend View is a simple indicator that shows in a text the trend of the current currency in the timeframe you choose. Inputs are: Color: color of the text. Timeframe: timeframe for calculations. Trend can be: UP: bullish trend. DOWN: bearish trend. ---: trend not defined. You can use this indicator to show the main trend of a bigger timeframe helping you to choose your trades. Note: text is draggable.
FREE

This is a general purpose indicator that displays colored lines at fixed and customizable price intervals, entered as parameters. It offers universal, constant, and familiar price ranges that allow quick and precise price analysis of a currency pair. With default parameters, this indicator implements The Quarters Theory , as described originally by Ilian Yotov . [ Installation Guide | Update Guide | Troubleshooting | FAQ | All Products ] Easy to use No optimization needed Customizable price int
FREE

Mesafe Fiyat Hareketli Ortalama
Bu, fiyattan hareketli ortalamaya olan mesafeyi gerçek zamanlı olarak hesaplayan bir göstergedir.
Bununla sizin tarafınızdan seçilen belirli bir zaman diliminde fiyatın hareketli ortalamadan maksimum sapmasını izleyebilir, örneğin mesafeyi son 30 günün maksimum sapmasına göre izleyebilirsiniz.
Hareketli ortalamanın periyodunu ve türünü seçmek mümkündür.
Daha da iyi hale getirmek için, fiyatın tüm zamanların en yüksek seviyesine ulaşması durumunda iki uy
FREE

This Indicator works as a momentum oscillator however it is most used to surf the trends. Despite of being an oscillator, MACD (Moving Average Convergence/Divergence) doesn't work with over limit conditions (such as OverBought or OverSold). Graphically it's shown as two lines and an histogram with the diference of them. Standard metatrader has this indicator, however with only the two lines and without the histogram. This way it is much easier to read and uderstand it.
FREE

Kindly rate and comment about the product for upgradation & Support
The 5 EMA is plotted in green color ( Lime ).
The 14 EMA is plotted in red color ( Red ).
The 20 EMA is plotted in blue color ( Blue ).
The 200 EMA is plotted in yellow color ( Yellow ).
The Quarter EMA that provided calculates and plots four Exponential Moving Averages (EMAs) on the chart using different periods: 5, 14, 20, and 200. Each EMA is represented by a different color on the chart. Here's a description of each
FREE

Long & Short Göstergesi: Pazar Hareket Analizi için Nihai Araç Gerçek Zamanlı Bilgilerle Yüksek Başarı Oranı
Varlık hareketlerini yüksek doğrulukla takip edin ve kararlarınızı anlık güncellenmiş verilere dayanarak verin. ️ Daha Güvenli İşlem Girişleri
Pozitif ve negatif korelasyonların gücünü kullanarak daha güvenli ve bilgilendirilmiş işlem girişleri yapın. Kısa ve Uzun Vadeli Analizi Kolaylaştırır
Kısa ve uzun vadeli stratejiler için ideal, ticaret ihtiyaçlarınıza uyum sağla
FREE

Based on the trend-following principle of CCI, it has been improved to become an indicator that can identify the reversal of the trend and its development direction, that is, it can identify the top and bottom attenuation of the oscillating trend in the trend market. feature The red and green columns represent the trend of bullish or bearish development under the current cycle. The blue line shows the position and attenuation of the current price trend in the current cycle. The upper and lower
FREE
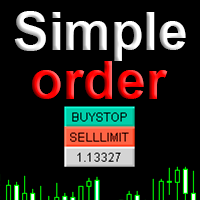
Simple order is designed to make placing pending orders as easy and fast as possible. Setting a pending order takes just two steps. 1. Double-click on the price of placing an order, after that a panel with buttons for order names appears. 2. Click on the button of the required order That's it, the pending order is set. If necessary, we adjust the order by dragging, as well as change the sizes of stop loss and take profit. Don't forget to pre-set the size of the stop loss and take profit in the S
FREE

Au79 is a powerful trading robot designed to help you profit from the XAUUSD market on the H4 timeframe. Using a sophisticated algorithm and advanced indicators, Au79 is optimized to deliver consistent and reliable results over time. Our backtesting and optimization process has been rigorous, testing the EA from January 1, 2019, to March 30, 2023, using real ticks with a history quality of 99%. This ensures that the EA performs well in a range of market conditions, and that its results are accur
FREE

At first, I got my teeth into Phoenix Ultra Expert Advisor.
This Expert Advisor will support automatic close order if the direction is correct and perform recovery if the direction is wrong. If you enter an order: 1. The price goes in the right direction and hits the Min Profit Point , trailing stop 20% of the current profit. 2. The price goes in the opposite direction, the Expert Advisor will place the order with the volume is Recovery Volume Percent at the input, the distance t
FREE

The Advanced Pivot Point Indicator is a powerful tool designed to help traders identify key support and resistance levels in the market. This versatile indicator offers a customizable and user-friendly interface, allowing traders to select from five different pivot point calculation methods: Floor, Woodie, Camarilla, Tom DeMark, and Fibonacci. With its easy-to-read lines for pivot points (PP), support (S1, S2, S3, S4), and resistance (R1, R2, R3, R4) levels, the Advanced Pivot Point Indicator pr
FREE

Correction Breakthrough, fiyat oluşumlarının analizine ve fiyat hareketlerinin ataletine dayanan bir düzeltme veya ticaret koridorundan olası koparma noktalarını tespit etmek için güçlü bir araçtır.
_________________________________
Gösterge sinyalleri nasıl kullanılır:
Gösterge, mevcut fiyat çubuğunda bir sinyal oluşturur. Oluşan sinyali, sinyal çubuğunun sinyal okunun üstünde/altında kapatıldıktan sonra kullanmanız önerilir. Gösterge sinyallerini yeniden çizmiyor.
___________________
FREE

Laguerre Indicator with Gamma Input Overview: The Laguerre Indicator is a sophisticated financial analysis tool designed to provide traders and investors with a dynamic and responsive method to track market trends. Its core functionality is centered around a unique algorithm that adapts to market volatility, offering clearer insights compared to traditional indicators. Key Feature - Gamma Input: Gamma: The sole input for the Laguerre Indicator, 'gamma,' plays a pivotal role in calibrating the i
FREE

This is my version of Currency Strength Meter.
One of the best indicators for spotting weak and strong currencies. Based on the information obtained, its very simple to decide which currency buy and which sell.
It is very simple to use, but extremely effective.
General rules are: - Buy currencies above level 0
- Sell currencies below level 0
You can also mix the main currencies together -->
EURUSD > 0 and USDJPY < 0 --> BUY on EURJPY
FREE

1. The Expert Adviser is built with a basic, simple and stable trading strategy with i touch or Price Action Principle that is highly effective and accurate with a sniper entry system for a good money management.. 2. The expert advisor works best as from 15 minutes time frame and above.... 3. The expert advisor work with all broker all currency pair and synthetic indices... 4. Use a reasonable lot size and correct settings if you want to get the best of the Expert Advisor.. 5. With Default setti
FREE

The Keltner Channel is a volatility-based technical indicator composed of three separate lines. The middle line is an exponential moving average (EMA) of the price. Additional lines are placed above and below the EMA. The upper band is typically set two times the Average True Range (ATR) above the EMA, and the lower band is typically set two times the ATR below the EMA. The bands expand and contract as volatility (measured by ATR) expands and contracts. Since most price action will be encompasse
FREE

Helps trader to place order seamlessly Close mulitple position at a time Place SL or TP for multiple position in a click Place hedge order same time with predefined SL and TP Place multi layer pending order in a click Place martingale layer Be informed about SL and TP in currency Get to know time remaining in current candle Get to know current spread View PnL, Balance, Equity on screen
FREE
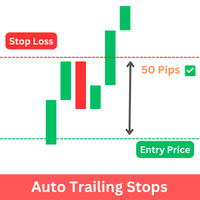
The Expert Advisor (EA) developed is specifically designed for scalping trading strategies . It functions as a trailing stop manager for any positions opened by the user. The EA continuously monitors open positions and dynamically adjusts the stop-loss level as the price moves in favor of the trade. This trailing stop mechanism helps traders secure profits by automatically tightening the stop-loss level as the trade progresses, thereby reducing potential losses and maximizing gains in fast-movi
FREE

Highly configurable Momentum indicator.
Features: Highly customizable alert functions (at levels, crosses, direction changes via email, push, sound, popup) Multi timeframe ability Color customization (at levels, crosses, direction changes) Linear interpolation and histogram mode options Works on strategy tester in multi timeframe mode (at weekend without ticks also) Adjustable Levels Parameters:
Momentum Timeframe: You can set the lower/higher timeframes for Momentum. Momentum Bar Shift:
FREE

Day Points
Indicadtor that shows the points considered important for X days. (Open,Close, High, Low) Used a lot by those who do day trade. These points can be used for decision making by a trader. You will choose the amount of days ago for it to show.
Settings High/Low/Close/Open Show - True/False. Days - Number of days that will show on the chart. Color - Line Color. Style - Line Style.
FREE
This indicator allows to hide ZigZag indicator (on all MT4 timeframes) from a date define by the user with the vertical line. This indicator can be use with other "Hidden Indicators". Indicator Inputs: Depth Deviation Backstep Information on "ZigZag" indicator is available here: https://www.mql5.com/en/articles/1537 ************************************************************* Hey traders!! Give me your feeds! We are a community here and we have the same objective.... make some money from th
FREE
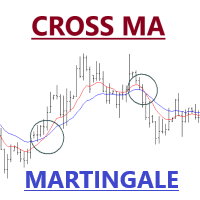
Expert Advisor of Cross two moving averages accompanied by stop loss, take profit, martingale and multi timeframes on each moving averages. You can change all the parameters contained in the moving averages
Please use as appropriate, hopefully can be useful and assist you in the transaction Don't forget to give a review if this product helps you
MA Method 0 = simple 1 = exponential 2 = smoothed 3 = LW
FREE

This utility identifies certain candle open times on chart, this can help you to see your favorite candle open and use it as it fits in your strategy. This tool is very useful for intraday charting and indicating your sessions. ___________________________________________________________________________________
Disclaimer: Do NOT trade or invest based upon the analysis presented on this channel. Always do your own research and due diligence before investing or trading. I’ll never tell you what
FREE
Yeni bir gösterge türü. Trend tanımlama için özel olarak tasarlanmıştır. Yatırımcıların iyi ticaret için doğru ve uygun zamanda yatırım yapmaları için harika bir araç.
Potansiyel müşterilerinize ve müşterilerinize memnuniyetleri için sunabilirsiniz. Çok kullanışlı ve modaya uygun bir araç. Kolay okunur, anlaşılır ve kullanıcı dostudur.
Bu araçla, ticarete girilebilecek potansiyel noktaları ve çıkış için düşük potansiyel noktaları kolayca belirleyebilirsiniz.
İyi şanslar!
FREE

如果产品有任何问题或者您需要在此产品上添加功能,请联系我 Contact/message me if you encounter any issue using the product or need extra feature to add on the base version.
PA Touching Alert is a tool to free you from watching price to touch certain critical price levels all day alone. With this tool, you can set two price levels: upper price and lower price, which should be greater than/less than the current price respectively. Then once price touches the upper price or lower price, alert and/or notification would be sent
FREE
SK Stochastic Candle Moves EA based on Stochastic oscillator . It is used to generate overbought and oversold trading signals. Easy to use and Simple No Martingale Recommended GBPUSD,EURUSD Timeframe M30,H1 others timeframes with the appropriate settings. Works for ECN/Non-ECN brokers and 2-3-4-5 digit symbols
A low latency vps is and an lower spread broker is always recommended. Support us by open My recommended broker. Exness Tickmill How its work ? Candles move XXX bars above
FREE

The DJ_M5_810504785_L_OD_CF_1522_SQX is an algorithmic trading strategy for MetaTrader, tested on DJ using the M5 timeframe from December 7, 2017, to June 2, 2023. There is no need to set up parameters, all settings are already optimized and fine-tuned.
Recommended broker RoboForex because of EET timezone.
You can find the strategy source code for StrategyQuant at the link: http://quantmonitor.net/listing/dow-jones-bollinger-master/
Key details are:
MagicNumber: 810504785 Main Chart
FREE

Volume Projection Indicator The Volume Projection Indicator is a specialized tool designed for traders who focus on the relationship between volume and price action. This intuitive indicator projects the expected volume for the ongoing candle, aiding in decision-making during live market conditions. The indicator presents volume data in a histogram format directly on the chart for quick analysis. Features: Bullish Volume Representation : Each green bar in the histogram signifies the volume for a
FREE

Tick imbalance bars (TIB), described in the book Advances in Financial Machine Learning (2018) by Marcos López de Prado. Indicator that show candlestick bars with an different sampling method than time fixed. Real time data is sourced to the indicator and it may be used as substitute of the default graph. Each bar is formed when a predefined tick balance is exceeded, showing in the graph the OHLC of this cluster of ticks. The input variable is the amount of ticks of each bar. The indicator may
FREE

Genaral: Not martingale, not a grid; Use on EURUSD Use on M5
Signals: There is a good rational algorithm. Work of two indicators: 2 DeMarker (from 2 timeframes) (you can set a separate Timeframe for each indicator)
Stop Loss/Take Profit: There is a good money management system (there are several type for trailing stop loss); There is virtual levels of Stop Loss / Take Profit; There is smart lot (percent by risk) or fix lot
Important: EA can work on closed candles, and on current candl
FREE

The 2indtompson indicator is an indicator for comparing two instruments for determining volumes, for balancing in pair trading or arbitrage trading, prepared from an analog version for the MT4 terminal. So if you need to compare how much two instruments will weigh and you don't know how to do it, then put an indicator on the chart and it will automatically calculate the volumes needed for balancing. Additionally, the indicator shows the state of the instruments relative to each other - Divergenc
FREE
* This product was converted using "BRiCK Convert4To5 MT4 " based on the MQL4 source file of "BRiCK Convert4To5 MT4 Free" . "Convert4To5" is a Script that converts MQL4 source files into MQL5 source files.
Experts, Indicators, Scripts, and Libraries with extension ".mq4" will be available for MT5.
Parameter
None.
Procedure
1. Open the following folder.
terminal_data_folder\MQL4\Files\ (in the terminal menu select to view "File" - "Open the data directory") 2. Confirm that the BRiC
FREE

Menora (All In One) Indicator.
This is the advanced and premium indicator for the Magic Trend, a free indicator. It has 3 output signals driven by different market conditions. This indicator has a double function of working as an indicator and utility at the same time.
Specifications
1] 3 output signals a) Slow Moving Average with color change - The MA has a non-repaint color change, which makes it perfect for entry signals. b) Fast Moving Average (the original Magic Trend line) - Give
FREE

DLMACD - Divergence Local (Wave) MACD . The indicator displays divergences by changing the color of the MACD histogram. The indicator is easy to use and configure. It was created as an addition to the previously published DWMACD . For the calculation, a signal line or the values of the standard MACD histogram can be used. You can change the calculation using the UsedLine parameter. It is advisable to use a signal line for calculation if the histogram often changes directions and has small val
FREE

This MT5 Utility is designed to simplify the process of managing multiple trades. If you have several open positions, it can be time-consuming to close each one manually. With this tool, you can easily close all profit trades, losing trades, or just the trades that are linked to the chart you're currently viewing. It saves you time and effort by allowing you to manage your trades with just a few clicks, making your trading experience smoother and more efficient. Whether you're focusing on profit
FREE

VWAP BAR It´s power full indicator of candle by candle when lined up with greate analysis, you have great opportunity, finder defense candle. Is a good ideia from order flow method, now your meta trader 5 inside you time frame chart .
What is the Volume Weighted Average Price (VWAP)?
The volume weighted average price (VWAP) is a trading benchmark used by traders that gives the average price a security has traded at throughout the day, based on both volume and price. It is important
FREE
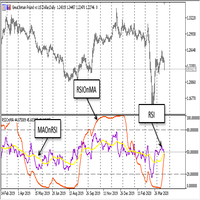
The EA trades on two indicators iMA (Moving Average, MA) and one iRSI (Relative Strength Index, RSI). Decision on trade signals is only made when a new bar appears, while positions are trailed and closed (in case of profit) at every tick. An unconventional solution was applied: The Slow indicator averaging period is calculated as the Fast averaging period multiplied by two, while the RSI averaging period is always equal to the Fast averaging period. This reduces the number of par
FREE

Double Correlation indicator (free) plots two windowed correlations in a separate window. the size of window is taken as input before the two symbols to correlate to. Two symbols are taken as an input parameters as well as period length. and the two correlations are computed with the currently shown symbol ex: input GBPJPY and AUDNZD. current symbol EURUSD then the following will be computed corr(EURUSD,GBPJPY) and corr(EURUSD,AUDNZD) The indicator can be useful to run a multi-symbol pair trad
FREE

The Fibonacci indicator automatically displays the Fibonacci retracement levels, representing significant support and resistance. The range for calculating the indicator can be taken from the previous day, week, month, year or user-specified session.
Levels 100 % (High) of the range from the previous session. 0 % (Low) of the range from the previous session. 76,4 % of the range from the previous session. 61,8 % of the range from the previous session. 50 % of the range from the previo
FREE

Funcionamento: O Painel Netting Panel RSJ funciona com qualquer ativo e em qualquer tempo gráfico . Ele funciona em contas do tipo " Netting " e " Hedge ", mas gerencia apenas uma posição por ativo, por isso o nome Netting. Se ele for executado em contas do tipo " Hedge ", ele fará o gerenciamento e proteção apenas da posição mais antiga , ou seja, da primeira posição que foi aberta por ele. Em contas " Netting " quando os botões " SELL " ou " BUY " forem pressionados, ocorrer
FREE

The Volume Weighted ATR indicator is a helpful tool for measuring market activity. It is based on the idea of the Volume-Weighted ATR. Combining these two elements helps identify potential turning points or breakout opportunities. The indicator for the classification of the activity of the market uses the moving average and its multiples. Accordingly, where the VWATR bar is located (relative to the moving average), it is labelled as ultra-low, low, average, high, very high or ultra high. The Vo
FREE

This indicator draws a vertical line repeatedly at the set time. The number of lines that can be set can be set arbitrarily. In addition, it is possible to set 4 types of lines. It is possible to change different times, colors, line types, etc. The time can be set to any time in minutes.
In the next version, we plan to display the high and low prices within the setting range.
FREE

TradeMirror is a trade copier EA for MT4/MT5 platform. Why TradeMirror
We understand the importance of security, stability and privacy for financial software, so we've gone the extra mile to harden these three elements in detail: Provides a user-friendly graphical interface that is easy to operate Focus on privacy and security, suitable for various financial scenarios with privacy requirements for order distribution Precise replication of orders, millisecond distribution Support full platform,
FREE

Source code only at 500 usd The Time Range Breakout Strategy is an advanced, automated trading solution designed to capitalize on market movements within specific time intervals. Developed for the MetaTrader platform using MQL5, this strategy identifies key breakout points within a user-defined time range and executes trades accordingly. Here's a detailed description of the product for sellers: Product Overview Time Range Breakout Strategy Product Highlights: Automated Trading : Executes buy and
FREE

Daily Monitoring : The indicator automatically calculates and displays the daily drawdown on your trading chart, allowing you to see how well you're performing on a daily basis. Risk Management : By monitoring daily drawdown, traders can better manage their risk. It helps to keep daily losses within acceptable limits. Real-Time Information : Daily drawdown is updated in real-time, providing accurate and up-to-date information about your trading performance. How to Use: Activate the "Daily Drawd
FREE

This indicator is designed according to the combination of WPR and Stoch indicators, when WPR goes up and Stoc goes up quickly too, the price may meet strong resistance, many times short order will take profit, but if the price break through it, Long positions are more likely to be profitable, and the reverse held true as well. You can adjust the parameters of WPR and Stoc to Adapt the symbol you operate. Click here to look the advanced edition: https://www.mql5.com/en/market/pro
FREE

To get started, subscribe to the RealTrend Telegram channel. t.me/RealTrendFree
RealTrend is an EA that facilitates trading for expert users.
The user's aim is to identify the right business trend
and let RealTrend suggest the placement of pending orders in strategic points
where the price will retrace and then continue its trend.
RealTrend is very simple to use and includes a single user-defined stoploss input and an intuitive chart panel.
The takeprofit is placed directly by the Bot.
FREE

You can send MetaTrader screenshot easily to your identified telegram channel via press the send button that on the chart. TelegramBotToken: Telegram API credentials. You can create API credentials on my.telegram.org web page ChatId: Your telegram chatId. Secreenshots will be sending this channel - Please do not press the button repeatedly. This may cause your bot or ip address to be blocked. - You have to add telegram api address ( https://api.telegram.org ) in Option > Expert Advisors > Allow
FREE

This indicator is based on the Moving Average indicator. It helps the user identifying whether to buy or sell. It comes with an alert that will sound whenever a new signal appears. It also features an email facility. Your email address and SMTP Server settings should be specified in the settings window of the "Mailbox" tab in your MetaTrader 5. Blue arrow up = Buy. Red arrow down = Sell. Line = Trailing Stop. You can use one of my Trailing Stop products that automatically move the Stop Loss and
FREE

Simple indicator to calculate fibonacci retracement levels on time. Add to chart and move trend line to set the fibonacci retracement levels. Inputs Levels - levels for which to calculate values, separated by space, default are fibonacci levels Show time - if true, time will be shown on levels Show date - if true, date will be shown on levels Show fibonacci level - if true, value of levels will be shown Fibonacci lines color - color of levels Trend line color - color of trend line which de
FREE

Shows min and max of last M5 Candle. Can be used to trade breakouts of last M5 candle. The M5 Candle Breakout Strategy avoids to stay too long in a sindways phase. See documentation on @swisstrader3713, where you can follow my live trading. The only parameters are the color of the lines defining the M5 stretch. Best use the indicator in M1 timeframe. The M5 Breakout Strategy has helped me to reduce overtrading.
FREE

"Driver Road Bands" indicator that is designed to be used in the 1H, 4H and 1D timeframes in the most ideal way. If we compare timeframes to roads and streets; main streets and highways with high traffic volume are similar to high-time timeframes in technical analysis. If you can interpret the curvilinear and linear lines drawn by this indicator on the graphic screen with your geometric perspective and develop your own buy and sell strategies; you may have the key to being a successful trader.
FREE
MetaTrader Mağaza - yatırımcılar için ticaret robotları ve teknik göstergeler doğrudan işlem terminalinde mevcuttur.
MQL5.community ödeme sistemi, MetaTrader hizmetlerindeki işlemler için MQL5.com sitesinin tüm kayıtlı kullanıcıları tarafından kullanılabilir. WebMoney, PayPal veya banka kartı kullanarak para yatırabilir ve çekebilirsiniz.
Ticaret fırsatlarını kaçırıyorsunuz:
- Ücretsiz ticaret uygulamaları
- İşlem kopyalama için 8.000'den fazla sinyal
- Finansal piyasaları keşfetmek için ekonomik haberler
Kayıt
Giriş yap
Gizlilik ve Veri Koruma Politikasını ve MQL5.com Kullanım Şartlarını kabul edersiniz
Hesabınız yoksa, lütfen kaydolun
MQL5.com web sitesine giriş yapmak için çerezlerin kullanımına izin vermelisiniz.
Lütfen tarayıcınızda gerekli ayarı etkinleştirin, aksi takdirde giriş yapamazsınız.