YouTubeにあるマーケットチュートリアルビデオをご覧ください
ロボットや指標を購入する
仮想ホスティングで
EAを実行
EAを実行
ロボットや指標を購入前にテストする
マーケットで収入を得る
販売のためにプロダクトをプレゼンテーションする方法
MetaTrader 5のための無料のエキスパートアドバイザーとインディケータ - 23

This indicator draws the Parabolic SAR. Top and bottom lines with customizable colors. With an additional parameter called “Validate Signals”, which identifies false breakouts and changes the color of the line to gray.
Input Parameters: Step ( default is 0.02 ) Maximum ( default is 0.2 ) Applied Price High ( default is High price) Applied Price Low (default is Low price) Validate Signals (boolean value to filter out false breakouts, default is true)
FREE

Au79 is a powerful trading robot designed to help you profit from the XAUUSD market on the H4 timeframe. Using a sophisticated algorithm and advanced indicators, Au79 is optimized to deliver consistent and reliable results over time. Our backtesting and optimization process has been rigorous, testing the EA from January 1, 2019, to March 30, 2023, using real ticks with a history quality of 99%. This ensures that the EA performs well in a range of market conditions, and that its results are accur
FREE
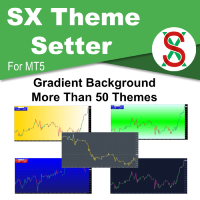
SX Theme Setter is intended for changing chart appearance in 2 modes: - Gradient background mode:
In this mode, the indicator creates a gradient background for your chart. Colors, steps and gradient type can be selected by user. - Color theme:
Color theme mode provides more than 50 built-in different color themes which can be selected from a list. Most of these themes are converted from official color themes of real trading platforms of the past and present. Try them out and see if they sui
FREE

Description:
The PTB_MoneyFlow indicator is designed to help traders identify key price levels and potential price movements using Fibonacci retracement levels, alongside tracking recent highs and lows over both short and long periods.
Key Features:
Highs and Lows Tracking:
The indicator calculates and plots the highest and lowest prices over two user-defined lookback periods:
Short Lookback Period: Default is 3 bars.
Long Lookback Period: Default is 144 bars.
These levels ar
FREE

The daily custom period seperator indicator allows you to draw period seperators for your lower time frame charts H1 and below. The period seperator gives you options to set different colors for: Weekend - saturday/sunday Monday and Friday Midweek - Tuesday to Thursday.
By default the indicator plots the period seperator line at 00:00 hours for the last 10 days.
Use Cases: The indicator can be used as a colourful alternative period seperator to the default MT5 period seperator. For those t
FREE
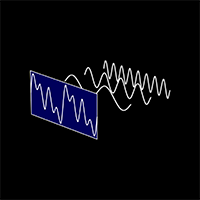
The "Cycle Extraction" indicator for MetaTrader 5 uses the Fast Fourier Transform (FFT) to discern cycles in financial time series. It facilitates the configuration of parameters such as the maximum number of bars, moving average settings, and specification of frequency thresholds, optimizing the analysis of repetitive market phenomena. Instructions Input Settings : Adjust variables such as Bar Count, Period, Method, and Applied to Price to customize the analysis to the user's needs. Data Visual
FREE
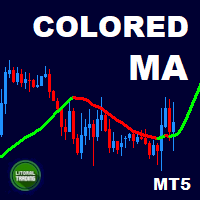
Are you the type who likes to use moving averages and surf the trend? Me Too! that is why I developed this indicator. It is basically a moving average that changes the color according to the trend (up or down). Its appearance can be customized and the price method too. The setup is very simple, no need to explain. If you have any questions or find any errors please contact us! Enjoy!
This is a free indicator, but it took hours to develop. If you want to pay me a coffee, I appreciate a lot <3
FREE

Volatility Doctor RSIをご紹介します。これは、信頼できるRSI指標を基に構築された画期的なツールであり、これまでにないトレーディング体験を提供するために設計されています。
当社のインジケーターは、リアルタイムのRSI読みを提供するだけでなく、選択した時間枠と好きな取引シンボルにおいて、RSIの読みが将来の10ステップ先にどこに位置するかを正確に予測します。
適応型インテリジェンス:このツールは市場に適応し、あなたのユニークなトレーディング戦略にシームレスに統合され、意思決定プロセスを向上させます。
Volatility Doctor RSIで今日からトレーディングを高めましょう。
あなたに平和と繁栄、そして利益をもたらす取引を願っています。
Gamuchirai Zororo Ndawana
Volatility Doctor.
FREE

Colors generated according to trading volume and market direction.
The analysis is carried out following the direction of the price and volume traded if the traded value exceeds the calculation base the system changes the color to green, informing you that the price direction is strong to buy, if the traded value is less than the calculation base the system changes to red, indicating that the price is strong for sale.
FREE

の指標に基づく指標を内蔵標準指標の指標を考慮し、電流指標の30の指標 そして、他の指標のすべての傾向の一般的な傾向を売買するための信号を与えます。 入力パラメータでは、各区分に特別なパラメータを設定できます。 インジケータはオシレータの形で実行され、すべてのインジケータの一般的な傾向と優位性を一方または他方の方向に示します。 https://youtu.be/UG2ZZEH9B_U
の指標に基づく指標を内蔵標準指標の指標を考慮し、電流指標の30の指標 そして、他の指標のすべての傾向の一般的な傾向を売買するための信号を与えます。 入力パラメータでは、各区分に特別なパラメータを設定できます。 インジケータはオシレータの形で実行され、すべてのインジケータの一般的な傾向と優位性を一方または他方の方向に示します。
FREE

Genaral: Not martingale, not a grid; Use on EURUSD Use on M5
Signals: There is a good rational algorithm. Work of two indicators: 2 DeMarker (from 2 timeframes) (you can set a separate Timeframe for each indicator)
Stop Loss/Take Profit: There is a good money management system (there are several type for trailing stop loss); There is virtual levels of Stop Loss / Take Profit; There is smart lot (percent by risk) or fix lot
Important: EA can work on closed candles, and on current candl
FREE
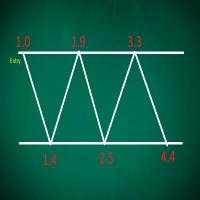
This EA performs with a Hedging strategy by which Buy and Sell signals are from the MACD indicator.... The lot sizes in the input are Custome for you to adjust as you pleased, so you are able to improve your hedging style. Inputs. Close Money- this option is basically the take profit in ($), for example if you set the close money at $20 the EA will automatically close all trades when your overall profit is $20. Nearby Hedge Pips- this basically determine the distance of pips between yo
FREE

O indicador imprime a linha da média longa quando as médias media e curta estão confinadas dentro dos limites de 1 ATR (average tru range) da média longa. Após períodos de congestão os preços se movimentam fortemente em uma direção. Este indicador não fornece pontos de entrada, apenas mostra que as médias estão bastante próximas. Parâmetros: Periodmalongo: Período da média longa. Periodmamedio: Período da segunda média. Periodmamedio2:Período da terceira média. Periodmacurto: Período da média cu
FREE

The TRIXe Indicator is the combination of the TRIX indicator (Triple Exponential Moving Average) with the addition of an EMA (Exponential Moving Average) signal. It provides signs of trend continuity and the start of a new trend.
The entry and exit points of operations occur when the indicator curves cross.
It performs better when combined with other indicators.
FREE

Swiss Holy Grail Indicator Motivation and functioning The HolyGrail indicator serves to optimize an entry. At that very moment I caught myself, that I went short in an uptrend, so I got into a trade in an anti-cyclical way. Or I have entered into a much too mature trend. This indicator should prevent such errors: One should always be aware of whether it is pro- or anticyclic entry, and one must always know about the maturity of the trend. Don't enter an old trend. Linda Raschke advises to buy th
FREE

ATR Bands with Take-Profit Zones for MT5 Optimize your risk management and trading strategy with the ATR Bands indicator for MT5 – a powerful tool designed to help you navigate market volatility, identify key price levels, and set realistic stop-loss and take-profit targets. Key Features: ATR-Based Bands : The core of this indicator relies on the Average True Range (ATR) to calculate dynamic upper and lower bands that adapt to market volatility. The bands provide a clear indication of potential
FREE

* This product was converted using "BRiCK Convert4To5 MT4 " based on the MQL4 source file of "BRiCK Convert4To5 MT4 Free" . "Convert4To5" is a Script that converts MQL4 source files into MQL5 source files.
Experts, Indicators, Scripts, and Libraries with extension ".mq4" will be available for MT5.
Parameter
None.
Procedure
1. Open the following folder.
terminal_data_folder\MQL4\Files\ (in the terminal menu select to view "File" - "Open the data directory") 2. Confirm that the BRiC
FREE

Everyone knows how to analyze the market , which level to buy / sell this is an easy job , which leads to unusual horrible loses , very little few people knows WHEN then enter the market , time is Money , this is the key!!!
This version is a Proof of concept limited version of ZamanCYcles founded here: https://www.mql5.com/en/market/product/81883?source=Site +Market+Product+Page This works Only on 3 Minutes Time frame for 45 Candles Get rest of planets and more than 10 other algorithms to pre
FREE

Custom Panel allows you to gather all kind of important information and display it as one handy table in the upper right corner of the chart.
You can choose the contents of the panel yourself. Every row will show your own customized condition or value. Every column shows a different timeframe. The panel may contain up to 10 rows and up to 8 columns. Sample usage Row : Price > EMA(30)
Mode : YES_NO
Meaning : is current price above EMA(30)
Row : Ask < Bands[L]
Mode : YES_NO
Meaning : is cur
FREE
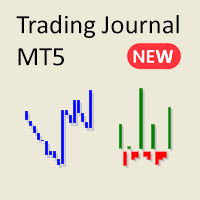
MetaTraderでの複雑で混乱したレポートに疲れていませんか?取引を追跡するための、よりクリーンで簡潔な方法をお試しください。 私の新しいユーティリティ/エキスパートアドバイザーは、取引のパフォーマンスを簡単に読み取れるミニマリストなビューを提供します。
このEAは現在、フィードバックを収集し、機能を改善している間、無料で提供されています。提案には前向きに対応しますが、開発は他の予定と並行して進行していることをご理解ください。
主な機能:
アカウント残高のラインチャート シンプルなラインチャートを使って、時間とともにアカウント残高の変化を追跡します。アカウントのパフォーマンスを瞬時に把握し、取引履歴のトレンドを一目で確認できます。
勝敗比の棒グラフ 毎日の取引セッションごとの利益と損失を可視化します。緑の棒は勝ち取引を、赤の棒は損失を表し、良い取引日と悪い取引日を迅速に識別するのに役立ちます。取引を閉じると、グラフは即座に更新されます。
詳細な統計表 このEAには、取引パフォーマンスを分析するために必要なすべての重要な指標が含まれています:
総純利益 総
FREE

A small utility displays the time in five time zones. You can customize the display of one to five time zones. For each time it is configured: show or not; name; time offset from GMT; color; In general settings, you can change: date / time format ("hh: mi", "hh: mi: ss", "yyyy.mm.dd hh: mi", "yyyy.mm.dd hh: mi: ss") font name; font size; offset from the left edge of the chart; offset from the top edge of the chart;
FREE

Necessary for traders: tools and indicators Waves automatically calculate indicators, channel trend trading Perfect trend-wave automatic calculation channel calculation , MT4 Perfect trend-wave automatic calculation channel calculation , MT5 Local Trading copying Easy And Fast Copy , MT4 Easy And Fast Copy , MT5 Local Trading copying For DEMO Easy And Fast Copy , MT4 DEMO Easy And Fast Copy , MT5 DEMO
The homeopathic indicator is also called the CCI indicator. The CCI indicator was propos
FREE

This version is 30 usd
British Fakeout EA is a trading strategy for GBPUSD. Strategy aims to catch fake movements and make a profit from them. For this purpose, it opens lots, these lots can be made with Fixed, Martigale or Equity Based Lot calculation. You can adjust the distance between lots with the GRID DISTANCE option. Live Signal
-Recommended Time Frame: 4H -Currency: GBPUSD -Recommended fixed lots for 1000 USD is 0.02 -Recommended equity lots for 50x leverage = 200 -Recommended equit
FREE

Black Friday PROMO launch My portfolio . I am giving this expert advisor for FREE.
The Expert Advisor has been developed by AI for Nikkei and M15 timeframe. There is no need to set up parameters, all settings are already optimized and fine-tuned. Recommended broker RoboForex because of EET timezone.
My recommendation is to have a look also at the rest of my products in the portfolio, as they work very well together in combination. Check other portfolio screenshots.
Dax Ai , Daw Ai , Niki A
FREE

Trading Signal for MetaTrader5 PC platform
The Signal is based on the Investologic EA trend strategy . Trend following indicator’s and oscillator’s, can work with any symbol or market in MT5 platform FOREX, GOLD, OIL, STOCKS, INDEXES, NASDAQ SPX500 The strategy
the strategy uses multi time frame combination of indicators and moving averages to find the best entry point wen the fast MA slow MA Crossover And Stochastic , RSI , Average Directional Movement Index ,combined together
FREE

This utility allows creating any amount of grid orders just by clicking with the mouse.
Instructions:
Trading mode
Deleting mode
Press ctrl and click with mouse to start drawing a grid While drawing, press shift to cancel Release buttons to send orders
Press shift and click with mouse to draw a removal line
Release buttons to confirm removal: EA deletes every pending order that the line touches
Inputs: - 3 options to calculate the grid sizing: Fixed points distance between gr
FREE

The EU_H1_110155136_S_Bi_CF_SQ3 is an algorithmic trading strategy for MetaTrader, tested on EURUSD using the H1 timeframe from April 1, 2004, to April 24, 2024. There is no need to set up parameters, all settings are already optimized and fine-tuned.
Recommended broker RoboForex because of EET timezone.
You can find the strategy source code for StrategyQuant at the link: http://quantmonitor.net/listing/eurusd-biggest-range-pulse/
Key details are:
Main Chart: Current symbol and time
FREE
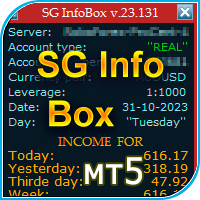
The "InfoBox" utility is designed to display the presence of open orders, the number of lots, current profit and much more in one window. The version for the MT4 platform is here . You've probably encountered a situation where you have an advisor that works on a currency pair, but information about its operation: - orders and their number, the size of the spread for the instrument, the volume of lots on the market, drawdown and much more - are scattered in different places of the terminal an
FREE

1. Торговая стратегия Что делает советник: Советник следит за некотоными индикаторами и при определенном условии (или условиях) помещать торговый запрос (на продажу или покупку) в зависимости от условий. Стратегия:
Используем индикатор Moving Average (скользящие средние) с периодом 8 (вы можете выбрать любой период, но в данной стратегии мы будем использовать период 8). Советник покупает, если 8-периодная скользящая средняя (далее для удобства будем называть ее MA-8) возрастает и текущая цена з
FREE

Imagine what results you could achieve in your manual trading if you had a tool that notifies you of a possible price reversal for all the symbols you are interested in at the same time (futures, stocks, forex or cryptocurrency)?
VSA screener is just the right tool. It was created for traders who value their time and make their own trading decisions on opening or closing a position. The software monitors the presence of trading patterns on the preselected tickers under several timeframes (up t
FREE

The NQ_H4_820422556_S_BB_CF_SQX is an algorithmic trading strategy for MetaTrader, tested on NQ using the H4 timeframe from December 7, 2017, to June 2, 2023. There is no need to set up parameters, all settings are already optimized and fine-tuned.
Recommended broker RoboForex because of EET timezone.
You can find the strategy source code for StrategyQuant at the link: http://quantmonitor.net/listing/nasdaq-trend-catcher/
Key details are:
MagicNumber: 820422556 Main Chart: Current
FREE

ライブモニタリング: https://www.mql5.com/en/signals/2252642 Quant ML SP500は、S&P 500関連のインストゥルメント用のボットです(H1タイムフレーム): .US500Cash CFD ESUxx 先物 SPY CFD S&P500指数を基にしたもの(具体的なインストゥルメント名はブローカーによって異なる場合があります)。 このボットは、戦略の安定性を重視した機械学習アルゴリズムによって生成および検証されています: 固定されたATRベースのSLおよびTPレベルを使用した市場エントリーのみを使用します。 トレーリングストップ、ブレークイーブン、マーチンゲール、グリッド、最初のポジションが赤字になったときに追加ポジションを取ることはありません。 インサンプル(IS)データおよびアウトオブサンプル(OOS)データの両方でテストおよび検証されています。 さらに、ISおよびOOSの外部データでも手動で前方テストおよび検証されています。
FREE

CANDLESTICK_MT5
A very interesting indicator of candlestick patterns, converted from the free version of the CANDLESTICK indicator for the MetaTrader4 terminal to the version for the MetaTrader5 terminal. In addition to candlestick patterns, it draws support and resistance lines, which are perfectly worked out by the price on the chart. It can work on any timeframe. Has simple settings. When converting, the logic of work and the design of the original CANDLESTICK indicator for the MT4 termina
FREE

This variant of the ZigZag indicator is recalculated at each tick only at the bars that were not calculated yet and, therefore, it does not overload CPU at all which is different from the standard indicator. Besides, in this indicator drawing of a line is executed exactly in ZIGZAG style and, therefore, the indicator correctly and simultaneously displays two of its extreme points (High and Low) at the same bar!
Depth is a minimum number of bars without the second ma
FREE

MACD indicators https://mql5.com This MACD indicator looks slightly different from the MACD indicator found in many other charting software. When the value of the signal line parameter is greater than the value of the MACD parameter, the indicator will give a buy prompt, and when the signal line parameter is less than the value of the MACD parameter, the indicator will give a sell prompt.
FREE
Э ксперт создан для скальпирования на открытии торгов ММВБ ( начинает работу через несколько секунд после 10=00) и продолжает скальпировать на открытии каждого бара.. Является продолжением продукта Morgen Open https://www.mql5.com/ru/market/product/47596 Эксперту желательно работать на часовом или M30 таймфрейме. Эксперт работает на указанное пользователем целое количество лотов, проверка минимальна, мартингейл не предусмотрен!!!. Эксперт при начале работы выставляет 2 отложенных ордера
FREE

The Day Trading Price Pattern indicator is an indicator of entry points that searches for and displays Price Action system patterns on dozens of trading instruments and on all standard time frames: (m1, m5, m15, m30, H1, H4, D1, Wk, Mn). Show all the main Price Patterns are introduced in the Ebook Day Trading With Price Action - Galen Wood You won't never miss any potential trading setup.
Want to send all the signals to your Telegram Channel? Checkout this guide
Advantages
1. Patterns:
FREE

" Outro " is an expert in automated " multi-symbol " trading that requires the trader to test on the pair of his choice and modify the entries according to his convenience. This Expert Advisor has been designed with non-optimized inputs, and uses a Martingale system for risk management. It is very important to read the blog post before you start. Enter to the private group . Outro uses two main indicators, Relative Strength Index and Stochastic Oscillator , for input decision making
FREE

Are you having trouble with too many events in the economic calendar? This reduces to the minimum number you need. You can filter by country code importance any key words and you can receive alerts before the set time of the event. ++++++++++++++ If country code is blank, display available code on the expert tab. You need to turn off the automatic calendar update setting in MT5. Any sound file of .wav format in Sounds directory. The length of keyword characters is limited by MT5.
FREE

Welcome to the Gold Lightning Strike EA!!! Trading Gold on Any Time Frame, targeting a high win rate and following a strategy with multiple conditions monitored for ideal trades!!! The EA uses a simple strategy using multiple Moving Averages with enhanced filtering to open optimal trades. A total of 6 unique signals are used to trade in both directions. As a customer, you can customize each signal per your preferred settings. Please note below that I recommend using various Raw Accounts wit
FREE

This indicator displays Point & Figure charts (PnF charts) in the indicator window. PnF charts show only price movements that are bigger than the specified box size. It helps to eliminate noise and allows focusing on main trends. Time is not a factor here. Only price movements are taken into account. That is why PnF chart is not synchronized with the main chart it is attached to. More about PnF charts: http://stockcharts.com/school/doku.php?id=chart_school:chart_analysis:pnf_charts Indicator wor
FREE

This is a usefull utility for monitoring spread and also for recording informations to a file. (Files will be placed into "Common\Files\Spread Monitor"). There is the possibility to let the indicator calculate high/low into the past thanks to downloading ticks. (It's a slow and approsimate thing! The best way to use it is to attach to a chart and let it recording spread in real time). There is also a buffer with the average of spread in latest X periods.
Easy and effective.
FREE

The advisor NewsCatcher Free opens trades when the price makes a reversal move from support and resistance levels. Market entries should be confirmed by the Relative Strength Index (RSI). The RSI is implemented as a tachometer. It is recommended to use this advisor in a highly volatile market after a political event or a release of major economic data.
You can use this advisor in the semi-automated mode (the RSI performs an information role) or in the fully automated mode (the RSI decides when
FREE
Program Features 1. Calculation of Margin Call and Liquidation Prices Monitoring all open positions: The program continuously analyzes all open positions on the trading account. Determining critical price levels: Margin Call Price: The price at which additional funds must be deposited to keep positions open. If this does not occur, liquidation follows. Liquidation Price: The price at which positions are automatically closed by the broker to prevent further losses. 2. Display of Prices on the Ch
FREE

Multi Diver EA trades symbols from Marketwatch . The strategy is based on the daily ranges and also on the RSI indicator. Risk management as well as breakeven and trailing stop accompany your positions and protect you from larger losses! You can use an indicator filter to weed out unwanted symbols. EA has been tested in EURUSD, USDCAD, USDJPY, XAUUSD and US30 H1 in the strategy tester and defaulted to these symbols. Please suggest your ideas in discussion. I will implement this as quickly as pos
FREE

Wizard Poverty Sanitizer is a moving average based indicator, using three EMA'S being 2OO EMA which is the slow EMA, the 21 EMA which is the median and the 10 EMA which is the fast. When the median and the fast EMA cross a signal is given, when the fast EMA goes above the Median EMA a buying signal is given and when the fast cross below the median a selling is given. Note that you can change the moving averages to you own choices of moving averages, allowing you to set your own MA strategy. a
FREE

The MetaCOT 2 CFTC ToolBox Demo is a special version of the fully functional MetaCOT 2 CFTC ToolBox MT5 library. The demo version has no restrictions, however, unlike the fully functional version, it outputs data with a delay. The library provides access to the CFTC (U.S. Commodity Futures Trading Commission) reports straight from the MetaTrader terminal. The library includes all indicators that are based on these reports. With this library you do not need to purchase each MetaCOT indicator sepa
FREE

Multset This is inte_plays indicator, which helps the trader to enter the trades appropriately it plots an arrow when there is appropriate environment which permits trading
Features 1. Sends push notification on mobile devices 2. Plots arrow on chart when the setting is found
TimeFrame Is suggested to be used on higher time frames only, especially starting 15min and above for proper moves
For more informations please Visit: https://t.me/Tz_Fx_Lab Subscribe to our Youtube channel: htt
FREE

Volume Projection Indicator The Volume Projection Indicator is a specialized tool designed for traders who focus on the relationship between volume and price action. This intuitive indicator projects the expected volume for the ongoing candle, aiding in decision-making during live market conditions. The indicator presents volume data in a histogram format directly on the chart for quick analysis. Features: Bullish Volume Representation : Each green bar in the histogram signifies the volume for a
FREE

Scalp using the behavior of a short moving average, the indicator gives the slope and identifies the "hyper" moments.
Operational advice:
Use M1 chart. Period 20 : open buy after two rising lows; sell after two max downhill; avoid countertrend openings; when the line goes flat put a stop at the opening price. Avoid actions in low volatility timeslots. When the curve that draws the min / max is very flat, it is better to postpone at least 15'.
Period 50 : matches the trend, when it is
FREE

Stat Monitor is a good information indicator.
Benefits of the indicator: The indicator provides useful information - the current spread, the cost of one lot of the symbol, trading leverage and the recommended lot size for trading. You can use the indicator on the MetaTrader 5 trading platform of any broker. The indicator provides useful information.
Version of the Stat Monitor indicator for MetaTrader 4 I wish you all good luck in trading and stable profit!
FREE
Long Term Double MACD Strategy with EMA Trend Confirmation
This strategy uses a leading and lagging MACD indicator. The leading indicator gives the entry signals, and the lagging indicator gives the exit signals. This Expert does not use any account management and as such you should make sure to set good stop losses.
Works best on longer timeframes on low volatility pairs.
FREE

QuantumAlert RSI Navigator is a free indicator available for MT4/MT5 platforms, its work is to provide "alerts" when the market is inside "overbought and oversold" regions in the form of "buy or sell" signals. This indicator comes with many customization options mentioned in the parameter section below, user can customise these parameters as needful. Join our MQL5 group , where we share important news and updates. You are also welcome to join our private channel as well, contact me for the priva
FREE

This indicator demonstrates the probable dynamic support and resistance levels of EMA, Ichimoku lines, and Key OHLC levels for different timeframes on one chart. This can drastically reduce the time and effort needed for switching between different timeframes.
EMA and Ichimoku Levels are drawn for the M1, M5, M15, M30, H1, H4, and D1 timeframes, and the Key OHLC levels of the last periods are drawn for the H4, D1, W1, and MN1 timeframes.
FREE

1、このトラッキングシステムはローカルトラッキングシステムであり、つまり送信側と受信側は同じコンピュータで操作しなければならない。MT 4/5アカウントは複数のコンピュータで同時に登録できるので、読み取り専用アカウントのパスワードを顧客に送るだけでいい。ローカル荷為替は、ネットワークの荷為替速度に関係しないので、非常に安定しています。 2.現在は送信端です。グラフに読み込めば正常に動作します。また、受信側をインストールして注文書を受信し、パラメータリストに送信側のmt 5アカウントを入力してください。 3.サポートとマルチフォローをお願いします。複数のMT 4/MT 5を実行すれば、いくつのインボイスを実行できますか?同じプラットフォームはコピーしてインストールしたフォルダで同時に複数のアカウントに登録することができます。 4.mt 4受信側でmt 5送信を受信し、mt 4と単mt 5を実現し、mt 5と単mt 5もサポートする。 5.機能紹介: 同プラットフォーム/クロスプラットフォームのフォローアップをサポートします。 応援します。 順方向のトラッキングをサポートします 固定単量シ
FREE

私の 推奨ブローカー を利用して、無料の製品をサポートしてください。 IC MARKETS Price Alert EA の利点: 一度の投資で生涯の利益: 毎月の支払いをする代わりに、一度の投資で生涯のアラートを得られるようにしましょう。私たちの Price Alert EA は永久にあなたのもので、長期的にリターンを最大化するコスト効率の良いソリューションを提供します。 単一のシンボルで無制限のアラート: 1つのシンボルに対して5つ以上のアラートを設定できることで、競争優位性を確保しましょう。妥協することなく、戦略を精密に調整し、市場の動きに自信を持って対応できます。 複数のシンボルに対応: 制限なしで取引!私たちの EA は、望むだけ多くのシンボルやペアにアラートを設定できます。比類のない柔軟性を体験し、ポートフォリオを楽に多様化しましょう。 使いやすいインターフェース: シンプルさを実現した使いやすいインターフェースを採用しています。好みを簡単に入力し、アラートをカスタマイズし、取引をコントロールできます。複雑な設定は不要で、直感的な操作が可能です。 モバイルへのリアルタイム通
FREE

Sharing-Is-Caring Trade Copier
Features Local & Remote copy One tool can act as provider or receiver of trades Co-exist with other positions opened manually or from other expert advisors Can be stopped and restarted at any time without any issues such as deals getting closed mysteriously Copy same lot or adjust according to your balance and leverage Partial close/open Manage max funds to use One provider can copy to unlimited number of receivers One receiver can copy from unlimited number of
FREE

Introducing the MetaTrader 5 Expert Advisor with Bull Signal Filter, Customizable Candle Size, Advanced Equity Management, and 1% Entry Price Calculation!
Are you searching for a comprehensive trading solution that combines powerful features and precise entry price calculation? Look no further! Our MetaTrader 5 Export Advisor is designed to provide you with advanced functionalities, enabling you to refine your trading strategy and effectively manage your equity.
The Bull Signal Filter rema
FREE

Introducing Dumangan MT5 - The Philippine God Of Harvest
(MT4 Version - https://www.mql5.com/en/market/product/98661 ) Experience the abundance of successful trades with Dumangan MT5, our new Expert Advisor available on MQL5.com. Named after the revered Philippine God of Harvest, Dumangan, this tool embodies the essence of reaping profits from the fertile ground of the markets, just like Dumangan blessed the fields with bountiful crops. A Focused Strategy with Customizable Settings Dumangan MT
FREE

ToolBot Advisor Indicator (RSI, ATR, ADX, OBV) FREE An effective indicator for your negotiations
The toolbot indicator and advisor brings leading (OBV) and lagging (RSI, ATR, ADX) indicators so that you have more security in your negotiations. In addition, it informs you of possible up and down trends as well as providing you with incredible advisors who will give you information about trading opportunities.
With this indicator you will have more security and speed in your decision making
FREE

BOT SMILES EA IS MADE OUT OF LOVE AND EMPOWERMENT. ONLY FOR FEW BUYERS THAT IS THE REASON OF THE PRICE . BOT SMILES EA is an aggressive multi-cycle scalper designed for EURUSD M1 . Each cycle is independent. it uses a sequence of orders and has its own TP and SL . It uses a martingale system.
This EA is using strong recurrences of the past to take position and achieve a high success rate . MODELLING :- 1 minute OHLC
INPUTS:- Buy default........... Check Drawdown Then BUY
FREE

One Click Close MT5 is an EA which allows you close orders quickly. EA display on chart two buttons. The first button "Close All Positions" is using to close all opened orders. The second button "Close Profit Positions" is using to close only profitable orders. EA is closing orders for all available symbols, not only for chart symbol. In EA params you can set distance from upper chart frame (Y Offset) and from left chart frame (X Offset). For installation EA it is only need to copy One Click Clo
FREE

「ChronoTrigger EA」は、緻密な取引戦略と自動化されたリスク管理機能を兼ね備えたエキスパートアドバイザーです。このEAは、RSI指標を活用し市場の買われ過ぎや売られ過ぎのタイミングを見極めることで、エントリーとエグジットの最適ポイントを計算し、投資家が市場の変動に左右されることなく安定した収益を得るための強力なサポートを提供します。 利用者は、ロットサイズやストップロス、テイクプロフィットの設定値を自由に設定し、さらに内部パラメータ(x0からx7)を調整することで、自身のトレーディングスタイルや市場の条件に完璧に合わせたパーソナライズが可能です。このEAは、あらゆる市場環境に柔軟に対応するために3桁または5桁の価格設定に自動調整し、多種多様な通貨ペアに適応します。 以下のような通貨ペアと時間足の組み合わせをおすすめします。 EURUSD on the 5-minute GBPUSD on the 5-minute
FREE

Highly configurable Awesome Oscillator (AO) indicator. Features: Highly customizable alert functions (at levels, crosses, direction changes via email, push, sound, popup) Multi timeframe ability Color customization (at levels, crosses, direction changes) Linear interpolation and histogram mode options Works on strategy tester in multi timeframe mode (at weekend without ticks also) Adjustable Levels Parameters:
AO Timeframe: You can set the current or a higher timeframes for AO. AO Bar Shift:
FREE
Have you ever been in a situation when you could not control the chart conveniently or had to make additional clicks to be able to scroll the history or set the scale fix numbers manually to be able to stretch the chart? Features: Chart centering. Automatic scale fix. Automatic scroll control. This tool is one of many features included in "Trading Essentials" utility application, which can be found on mql5.com
FREE

The JP_15_861542546_S_BB_CF_SQX is an algorithmic trading strategy for MetaTrader, tested on JP using the M15 timeframe from December 7, 2017, to June 2, 2023. There is no need to set up parameters, all settings are already optimized and fine-tuned.
Recommended broker RoboForex because of EET timezone.
You can find the strategy source code for StrategyQuant at the link: http://quantmonitor.net/listing/nikkei-breakout-zones/
Key details are:
MagicNumber: 861542546 Main Chart: Curren
FREE

SDivergence Indicator calculates and shows regular divergences and hidden divergences for MACD and Stochastic(for now). The benefit of this indicator is multiple input variables. Using these inputs you can modify to get more adaptive RD and HD's to your strategy. Guide : 1- First put your desired oscillator (MACD or Stochastic or Both) on the chart. 2- Run SDivergence indicator and set corresponding sub-window index of previously put oscillator in SDivergence input window. -Note: the chart sub-w
FREE

Introducing The Day Trader System: Your Shortcut to Day Trading Success! Are you a day trader seeking simplicity without compromising profitability? Look no further! We present The Day Trader System – your go-to solution for identifying lucrative opportunities in the fast-paced world of Forex. Simple Yet Powerful: The Day Trader System is a straightforward yet highly effective indicator designed exclusively for day traders. Say goodbye to complexity and hello to a system that simplifies
FREE

At first, I got my teeth into Dragon Ultra Expert Advisor. This Lesson is “Awesome”. In fact, It’s probably one of my best trading lessons I have ever written.
It took me at least 2 days of brain power and probably 20 coffees. Please pay it forward, share it with others. Enjoy.
Bruce Lee was arguably the best martial artist of all time, and guess what? He was not born the best martial artist of all time.
He earned that title through dedication and focus…he learned to become a MASTER of
FREE

This indicator allows you to visually identify with a different color the candlesticks that exceed a certain limit of the ATR.
Just drag and drop it on the chart.
The user must enter the value of the ATR period.
The user must enter the value of the ATR limit with which he wants to identify the candlesticks.
In the colors tab, the user can select the colors with which to repaint the candles.
It is recommended that the first color always be None.
The second color corresponds to b
FREE
MetaTraderマーケットは、他に類のない自動売買ロボットやテクニカル指標の販売場所です。
MQL5.community ユーザーメモを読んで、取引シグナルのコピー、フリーランサーによるカスタムアプリの開発、支払いシステムを経由した自動支払い、MQL5Cloud Networkなど、当社がトレーダーに対して提供するユニークなサービスについて詳しくご覧ください。
取引の機会を逃しています。
- 無料取引アプリ
- 8千を超えるシグナルをコピー
- 金融ニュースで金融マーケットを探索
新規登録
ログイン