适用于MetaTrader 5的免费EA交易和指标 - 21

Description: The Custom Moving Averages indicator displays three different moving averages on the chart: a 10-period Simple Moving Average (SMA10) in lime, a 21-period Simple Moving Average (SMA21) in red, and a 200-period Exponential Moving Average (EMA200) in thicker white. This indicator helps traders identify trends and potential entry/exit points based on the behavior of these moving averages. Features: Three moving averages in different periods: SMA10, SMA21, and EMA200. Customizable color
FREE

TickAll - Automated Trading Robot
Introduction: TickAll is an automated trading robot designed to assist both novice traders and professional traders in the Forex market. Utilizing advanced algorithms and up-to-date market analysis, TickAll helps you make the best trading decisions. Market Analysis: TickAll continuously monitors the market, analyzing various indicators, price movements, and patterns to identify potential trading opportunities. Trend Identification: Using so
FREE
Program Features 1. Calculation of Margin Call and Liquidation Prices Monitoring all open positions: The program continuously analyzes all open positions on the trading account. Determining critical price levels: Margin Call Price: The price at which additional funds must be deposited to keep positions open. If this does not occur, liquidation follows. Liquidation Price: The price at which positions are automatically closed by the broker to prevent further losses. 2. Display of Prices on the Ch
FREE

探索市场极限并抓住每一个机会是ZenithNadir Blueprint策略的精髓。ZenithNadir Blueprint是一种独特的交易策略,专为那些勇敢的投资者设计,他们在市场低谷寻找机会,并在市场巅峰果断回撤。受经典的马丁格尔加倍策略启发,它旨在通过精心规划的入场和退出机制来最大化投资回报。
然而,就像所有需要坚实基础的伟大梦想一样,ZenithNadir Blueprint策略也不例外。它的成功建立在对市场动态的深刻理解和彻底的风险管理之上。每笔交易不仅代表一个精确的机会时刻,还包含谨慎的风险评估。
选择ZenithNadir Blueprint意味着踏上一条非凡之路。投资者需要拥有决心和勇气,同时还需要智慧和策略。我们深知,在追求利润的同时,风险管理是不可或缺的。因此,ZenithNadir Blueprint策略经过深思熟虑地设计,为投资者提供了一个交易计划,使他们能够在市场高涨时享受,而在市场低迷时保持冷静。
总的来说,ZenithNadir Blueprint不仅仅是一种交易策略;它是一种投资哲学。它教导我们在市场波动中找到平衡,并以智慧和耐心拥抱每一
FREE

This Expert Advisor (EA) is crafted using AI technology and stands out due to its specialized training dataset derived from neural network methodologies, as opposed to conventional trading indicators. It is finely tuned for optimal performance on three specific Forex pairs. Using this EA on pairs other than those specified is not advised due to the extensive memory requirements post-training. The training dataset encompasses historical data spanning from January 1, 2019, to October 1, 2023. Whil
FREE

Volume Projection Indicator The Volume Projection Indicator is a specialized tool designed for traders who focus on the relationship between volume and price action. This intuitive indicator projects the expected volume for the ongoing candle, aiding in decision-making during live market conditions. The indicator presents volume data in a histogram format directly on the chart for quick analysis. Features: Bullish Volume Representation : Each green bar in the histogram signifies the volume for a
FREE

The "Standardize" indicator is a technical analysis tool designed to standardize and smooth price or volume data to highlight significant patterns and reduce market noise, making it easier to interpret and analyze.
Description & Functionality: Standardization : The indicator standardizes price or volume values by subtracting the mean and dividing by the standard deviation. This converts the data into a distribution with zero mean and standard deviation of one, allowing different data sets
FREE

This Expert Advisor is designed for news trading. This version is the free version for MT5. The amount of news to handle is limited to 5 news in USDPY (0.01 Lot). Please find below the other versions of this expert (The Pro versions have not limitations) : News Advisor MT5 Pro. News Advisor MT4 Pro. News Advisor MT4 Free. The main advantage of this expert is that it’s offering backtesting capabilities (something that is not found in most news expert advisors). This ability gives you the opportun
FREE
这是使用《新闻过滤器》所需的脚本。这个脚本选择任何你想过滤的图表,并将输入发送到新闻过滤程序。每个输入都是针对该图表的,所以你可以灵活地为每个图表设置不同的输入。新闻过滤器(免费演示)的链接可以在下面找到: 新闻过滤指南+下载链接
新闻选择 新闻来源于Forex Factory的经济日历。 选择可以基于任何一种货币,如USD,EUR,GBP,JPY,AUD,CAD,CHF,NZD和CNY等。 选择也可以基于关键识别,例如Non-Farm (NFP),FOMC,CPI等。 能够选择新闻影响级别的筛选,从低、中、到高影响。 自动模式只选择与图表相关的新闻。 新闻来源每小时自动刷新,以确保最新的新闻数据。 为每个新闻影响级别提供单独的输入,以确定您要过滤掉的新闻发布前后的分钟数。
订单管理选项
在新闻发布前关闭未平仓头寸的选项,并在新闻发布后恢复它们。 在新闻发布前删除挂单的选项,并在新闻发布后恢复它们。 在新闻发布前移除止损和止盈水平的选项,并在新闻发布后恢复它们。 在新闻发布前移动止损和止盈水平的选项,并在新闻发布后恢复它们。如果您希望在新闻期间适应增加的波动性,这个功能特别有
FREE

This is a simple tool to display the maximum lot size permitted for any asset based on the size of your account (or more accurately the free margin), and the leverage. It will display the max lot size allowed, and then the script will naturally exit after 3 seconds which gives you enough time to see the information. When you have an active position, it will calculate the maximum number of lots that are left while a position of a certain lot size is already running. Before the script terminat
FREE

CANDLESTICK_MT5
A very interesting indicator of candlestick patterns, converted from the free version of the CANDLESTICK indicator for the MetaTrader4 terminal to the version for the MetaTrader5 terminal. In addition to candlestick patterns, it draws support and resistance lines, which are perfectly worked out by the price on the chart. It can work on any timeframe. Has simple settings. When converting, the logic of work and the design of the original CANDLESTICK indicator for the MT4 termina
FREE

For those who hate candlesticks in lower timeframes (M1 through M15) we "invented" a clean new way to follow Price movement and displacement (volatility) called Price Trail Chart . The big "secret" is to get rid of those annoying candle wicks and draw the whole complete candle without them, this way we get a cleaner chart and a new view of the Price Path. No Open or Close markings, just LOW's and HIGH's, full body candle.
Additionaly we inserted a Volume monitor from our Best Downloaded indicat
FREE

El indicador técnico conocido como Líneas de Tendencia Perfecta . Este indicador es una herramienta valiosa en el análisis técnico y se utiliza para mejorar la toma de decisiones en el trading. Aquí tienes una descripción paso a paso de cómo funciona y cómo puede ser utilizado por los traders: Identificación de Tendencias : Las líneas de tendencia perfecta se dibujan conectando dos o más puntos de precio en un gráfico, revelando así la dirección general del mercado. Una línea ascendente indica
FREE

Что такое CCI индикатор? Стандартный Индикатор CCI (Commodity Channel Index) – это осциллятор, который измеряет силу, стоящую за тем или иным движением цены. Он помогает определить, кто находятся у руля: быки или медведи. Как и многие осцилляторы импульса, CCI работает, сравнивая текущую цену с предыдущими показателями, и на основе этого сравнения он решает, насколько сильное движение цены вверх/вниз.
Как рассчитать CCI? Метод расчета стандартного индикатора представляет собой оригинальн
FREE

This indicator utilizes the Narrow Range 7 concept . This concept says that if the seventh candle is the one with the smallest range, that is, the smallest difference between maximum and minimum of all 7 candles. The indicator marks this candle with two markers and waits for a breakout to happens in the next 6 candles. It's called "timeframe" because if in the next 6 candles the breakout not happens, it will remove all marks on candle. If it exceeds 7 times the timeframe, it also will remove the
FREE

TimeBar TimeBar 是一個簡單的資訊指示器,顯示柱關閉之前的剩餘時間,以及柱打開以來經過的時間和當前時間。 為了便於感知,增加了兩種顯示方式:以圖形左上角註釋的形式,或以圖形物件的形式。
優點 字體選擇 字體大小。 您可以設定任何一項。 評論的時候太小了 您可以移動物體。 雙擊滑鼠可以選擇任何時間並移動到圖表上的任何位置,它將照常繼續更新 視覺警報。 您可以設定指定的秒數,直到目前柱關閉,達到該時間後,時間將變成設定中指定的警告顏色 設定 選擇顯示的時間 每次的顏色(對於圖形物件) 一則警報,通知您酒吧即將關閉 使用 TimeBar 指標作為您交易系統的補充
使用連結嘗試我在市場上的其他產品 https://www.mql5.com/ru/users/capitalplus/seller
FREE

O Touch VWAP é um indicador que permite calcular uma Média Ponderada por Volume (VWAP) apenas apertando a tecla 'w' no seu teclado e após clicando no candle do qual deseja realizar o calculo, clicando abaixo do candle é calculada a VWAP baseado na minima dos preços com o volume, clicando sobre o corpo do candle é calculado uma VWAP sobre o preço medio com o volume e clicando acima do candle é calculado uma VWAP baseado na máxima dos preços com o volume, voce tambem tem a opção de remover a VWA
FREE

Bollinger Bands % or Bollinger Bands Percentage is one of the indicators used in the Sapphire Strat Maker - EA Builder .
It is calculated using the following formula:
Perc = (CLOSE_PRICE - LOWER_BOLLINGER) / (UPPER_BOLLINGER - LOWER_BOLLINGER) * 100
Thus, by taking the difference between closing price to the lower band and dividing it by the difference of the upper and the lower price levels of a Bollinger Bands indicator, we can calculate this indicator.
It shows how far the price is f
FREE

This indicator will draw two lines to represent the adjustment value, which can be used in both the Dollar and the Index.
The main advantage of this indicator is that it has two lines, one representing the adjustment calculated from the previous day and the other representing the adjustment calculated on the current day. The calculation of the adjustment on the current day is a great differential, since it will be possible to make operations in order to sleep bought or sold according to the a
FREE

Description :
Combination MT5 is a professional indicator based on the Stochastic Oscillator and Average True Range (ATR) technical indicators, thus, you can use it with any currency pair and any timeframe.Trade signals from Combination MT5 are drawn on the main chart in the form of arrows. When a blue arrow appears, then this is a signal to buy, when the red one appears then this is a signal to sell. You can set the alerts on/off. The Stochastic Oscillator and Average True Range (ATR) technic
FREE
GoDaekSun 是根據信號產生器做出交易決定後再根據現有的資金量調整下單的單量 設計目的希望所有參與交易的交易者,都能夠獲取合理的利潤
值得注意的是,過去的歷史回測匯或許會有相當大的利潤發生.但是將來的行情型態是不可知的.所以不要盲目地相信EA會創造出絕對的利潤,但也不要一昧地認為自動交易就是不可取的
特點
自適應的交易信號: 根據市場狀況自動調節信號產生的條件 簡單的設定方式: 只需簡單的設定即可. 單品種交易: 根據信號產生器做EURUSD單品種的交易 無華麗顯示面板: 將算力完全用在交易程序的計算 可以更高效續的執行工作 長期交易策略: 穩定的市場狀態時才會執行開單平倉 安全的風險控制: 在當前行情不例於持倉狀況時安全認損 不會早造成爆倉或是大量虧損
環境
使用時間框 M15 交易品種 EURUSD (品種必須列在報價清單上) 啟動資金使用1500美金即可運行 免費版只能交易EURUSD 正式版可以交易多品種 購買或是測試可以聯繫我取得適當的參數
運行淨值保持在2500美金以上 能更加確保交易帳戶的安全
參數
Magic :
FREE

Классический индикатор фракталов является запаздывающим, т.к. для подтверждения образования фрактала необходимо ждать 2 бара. Если этого избежать, то индикатор будет перерисовывающим, т.е. при обновлении максимума/минимума в течении 2-х баров фрактал будет менять своё положение на более позднее. В данном продукте максимально нивелированы оба этих недостатка, при этом совмещены достоинства обоих подходов! Индикатор показывает фрактал сразу в момент его образования, а в случае его обновления показ
FREE
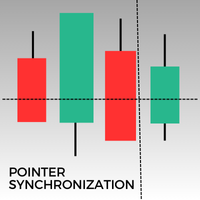
此MetaTrader 5指标可在相同资产的所有打开图表上自动同步指针。无论您是在1分钟图还是日线图上,指针都会自动对齐到所有打开窗口中的相同价格。此功能确保了分析的一致性和快速性,从而增强决策过程。同步多个图表之间的指针,对于希望在不同时间框架内保持价格变动准确概览的交易者来说,这是一个宝贵的工具。
FREE
This indicator is designed to provide all useful information about symbol, account, positions and profit. It is developed for improving trader's money management.
Parameters Calc can be divided to separate blocks. Each block is possible to hide, set its own color and other properties. Block symbol: This block displays information about actual SPREAD, POINT VALUE (in deposit currency for 1 lot), SWAP LONG and SHORT. Show symbol info - display/hide this block Color of symbol info - color of this
FREE
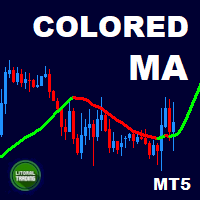
Are you the type who likes to use moving averages and surf the trend? Me Too! that is why I developed this indicator. It is basically a moving average that changes the color according to the trend (up or down). Its appearance can be customized and the price method too. The setup is very simple, no need to explain. If you have any questions or find any errors please contact us! Enjoy!
This is a free indicator, but it took hours to develop. If you want to pay me a coffee, I appreciate a lot <3
FREE

This EA uses two moving averages one slow and one fast, when ever they cross it checks if the RSI value is greater or lesser than 50 depending on the signal given by the Moving averages. After that it checks if the Stochastics lines are going up or down and not in the Over Bought or Over sold zone. so in total it uses an RSI, 2 Moving Averages ,Stochastics and an ATR to try to evade stop hunting.Also has a trailing function to hold the profits if price moves X pips tested on a 5 min time frame
FREE

Copy trades with ease using the MetaTrader5 trade copier - the quickest and easiest way to copy transactions between different MetaTrader 5 accounts! This innovative tool allows you to locally copy trades in any direction and quantity, giving you full control over your investments. Designed to work on both Windows PC and Windows VPS, this program is versatile and adaptable to your trading preferences. Whether you prefer to work from your desktop or a virtual private server, the MetaTrader5 trade
FREE

The initial balance (IB) is a range in which the price spent its first two OPT periods after the opening. In other words, the opening balance is a range of the first hour after the market opened. The opening balance arose from room trading, as room traders observed the various ranges after the market opened.
This indicator allows you to enter the starting and ending hours and minutes of a specific hourly time range so that the trader can set up different IBs according to the market.
Autom
FREE
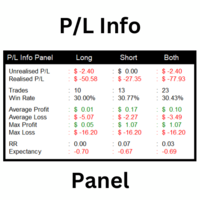
This utility shows various types of information on chart, controlled by many filters and option for each of them. If you want any custom feature or want to remove something from this product for your personal use. Please send me a personal message, I'll be happy to do so for you. Inputs and features explained: BG Color - Background color of the Dashboard
Text Color - Color of text info on the Dashboard
Border Color - Color of Border of the Dashboard Set Color on +/- Text - True/False option
FREE

该指标的开发是为了帮助您作为交易者确定市场方向,在交易中我们有三种类型的走势,即上升趋势、下降趋势和侧向走势,市场走势的侧向走势是大多数交易者陷入困境的地方,因为价格是合并,这仅仅意味着没有方向,对于剥头皮者来说,只有当他们知道如何识别资产类别何时处于这一时期时,这对他们来说才是有利的。
试图开发锄头来识别趋势是这个指标的全部内容,当价格高于绿点时坚持并在连续 2 个点发生后进行买入交易,或者当价格低于红点时我们专注于卖出头寸.
我在这个指标中所做的是避免当市场处于范围内时,当价格不低于红点时不要卖出当价格不高于绿点时不要买入。
对于我的大部分条目,我等待价格高于点,然后在连续第二根蜡烛上我选择趋势的方向。
FREE

An analogue of the Stochastic oscillator based on algorithms of singular spectrum analysis (SSA) SSA is an effective method to handle non-stationary time series with unknown internal structure. It is used for determining the main components (trend, seasonal and wave fluctuations), smoothing and noise reduction. The method allows finding previously unknown series periods and make forecasts on the basis of the detected periodic patterns. Indicator signals are identical to signals of the original i
FREE

The EA is designed to work only with USDCAD - M15. It is neither martingale nor grid, each operation has TP and SL.
EA uses stochastics and pin bars as signals to open positions. It is recommended to test and configure it as you see fit.
Beware that past results are no guarantee of future results, you could lose all the money in your account. Trade very carefully.
Enjoy EA.
FREE

JCAutoStm 简繁塞壬模型 1.Zigzag3浪,大中小三浪代表市场潮流、趋势、涟漪。 2.自动识别当前三浪的走势,命名每一种结构形态。 Zig123下跌3浪5浪7浪:D3/D5/D7,下跌中继形态:DRF1/DRF2/DRF3,底部反转形态:BRP1,BRP2,BRP3,特殊结构下跌5浪后底部反转结构Zig123D5BRP1/2 Zig123上涨3浪5浪7浪:U3/U5/U7,上涨中继形态:URF1/URF2/URF3,顶部反转形态:TRP1,TRP2,TRP3,特殊结构上涨5浪顶部反转结构Zig123U5TRP1/2 3.趋势线绘制,分别以大中小三浪相邻的高低点进行绘制。 绘制的原则是,收敛形态。 4.三浪有效SR,F3,F6,F12,F15,绘制水平线。 MACD背离线
FREE

Harness the Power of Donchian Channels for Trend Trading
The Donchian Channel Indicator may your key to precision trading. With Donchian channels, you'll gain insights into market volatility, breakouts, and overbought/oversold conditions. This winning strategy is named after its developer, Richard Donchian.
How Does the Donchian Strategy Work? The upper band represents the previous period's highest high; The lower band represents the previous period's lowest Low; The centre band refle
FREE

You probably heard about Candlesticks behaviors, which in most of the times could denote and trace Volume behaviors even if you are not watching Volume itself... Well, this indicator will do this. Naked traders love to rely solely on candlesticks patterns and with Candle Zones you can trap special patterns and DRAW THEM on your chart. As simple as that. There are several filters you can tweak in order to achieve the analysis you want. Just give it a try. After several months of testing, we think
FREE

The TRIXe Indicator is the combination of the TRIX indicator (Triple Exponential Moving Average) with the addition of an EMA (Exponential Moving Average) signal. It provides signs of trend continuity and the start of a new trend.
The entry and exit points of operations occur when the indicator curves cross.
It performs better when combined with other indicators.
FREE

ROMAN5 时间突破指标自动绘制日线的支撑和阻力突破箱体。它可帮助用户识别何处进行买入、卖出。当新信号出现时,它可发出提示和声音。它还具有发送邮件功能。您的邮件地址和 SMTP 服务器设置应该在 MetaTrader 5 的 "邮箱" 标栏里的设置窗口里指定。 蓝色向上箭头 = 买。 红色向下箭头 = 卖。 您可以使用一款我的移动止损产品,来自动移动止损,并包括设置盈亏平衡。 ROMAN5 分型移动止损 ROMAN5 抛物线SAR 移动止损 ROMAN5 布林带移动止损 ROMAN5 HeikenAshi 移动止损 ROMAN5 均线移动止损 ROMAN5 高级移动止损 如果您希望尝试 EA, 参见 ROMAN5 时间突破 EA 。 版本 1.2: 发送推送通知至移动终端。
FREE

This indicator draws a vertical line repeatedly at the set time. The number of lines that can be set can be set arbitrarily. In addition, it is possible to set 4 types of lines. It is possible to change different times, colors, line types, etc. The time can be set to any time in minutes.
In the next version, we plan to display the high and low prices within the setting range.
FREE

这是一个组合指标分析趋势、支撑阻力、买卖点。运用了均线MA、布林带、KDJ、CCI、RSI。 主图上下线是布林带上下线,采用的是20周期和2.3标准差可以用来支撑阻力。 中间的是分析趋势的均线,趋势分析是用均线多周期: 为涨趋势,反之为下跌趋势。在同一种颜色,基本说明趋势没有发生变化。 子图是由 KDJ、CCI、RSI三个指标组成,大于70超买,小于30超卖, 智能提示是运用了算法,主要计算布林带, KDJ、CCI、RSI指标
有三个或四个指标超出市场常态就会发出提示行情可能反转。 子图指标运用了很多数据,刚刚开始加载会有点慢,耐心等待就可以 这个指标是主图指标,还要再下我发布的RCD分析,这样就刚刚好组成一套分析 电脑分辨率的文本大小请设置100%,不然字体会不一样
FREE
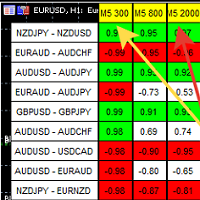
A script showing the correlation for three selected zones at once (TF-bar) In the parameters, select 3 options The data is displayed sorted by the first zone The script also creates a file in which it writes all the data without sorting. In this way, you can expand the number of zones to any number and perform the analysis in exsel
Parameters:
TF_Trade1 =PERIOD_M5; BarsCor1 = 300; TF_Trade2 =PERIOD_M5; BarsCor2 = 800; TF_Trade3 =PERIOD_M5; BarsCor3 = 2000; K = 0.8; WindSize
FREE

ATR Moving Average draws a moving average of the standard Average True Range( ATR ) in the same window.
Settings Name Description ATR period
Set Price per iod for ATR calculation
ATR level Set ATR value for thresholding( only whole number, ignore leading zeros e.g. 0.00089 = 89 ) MA Period Set moving Average Period MA Method Set moving average method( Simple, Exponential, Smoothed and Linear Weighted ) MA Shift
Set moving average shift
Enable Alerts ? Generate Alert when ATR crosses
FREE

很棒的实用工具,您可以实时监控账户的平均数和交易品种的点差 这将知道如何准确地识别数据,例如,能够知道您是否有 Prop Firm 帐户、知道正确的平均数以及点差是否被操纵等,以进行精确的批量计算
杠杆和点差指标的组合。 自动检查交易账户杠杆和点差的工具。 在所有经纪商外汇股票中工作。 有助于监控外汇经纪商在经济新闻公告期间是否改变杠杆和价差。 当前交易品种的实时点差检查。 交易账户实时杠杆检查。 易于理解的设计和快速刷新 ETC
杠杆是外汇市场的一个特殊性,它可以让您通过相对较少的投资赚取大量资金。 术语“杠杆”通常被翻译为杠杆或调平。 许多外汇经纪商提供了拥有非常有趣的杠杆的可能性。 例如,1:100的杠杆是指可以以比投资金额大100倍的金额进行外汇交易。 其结果是,在外汇市场上可以获得比实际投资大得多的利润,但损失的风险也更大。
FREE

Multi Diver EA trades symbols from Marketwatch . The strategy is based on the daily ranges and also on the RSI indicator. Risk management as well as breakeven and trailing stop accompany your positions and protect you from larger losses! You can use an indicator filter to weed out unwanted symbols. EA has been tested in EURUSD, USDCAD, USDJPY, XAUUSD and US30 H1 in the strategy tester and defaulted to these symbols. Please suggest your ideas in discussion. I will implement this as quickly as pos
FREE

The indicator is based on Robert Miner's methodology described in his book "High probability trading strategies" and displays signals along with momentum of 2 timeframes. A Stochastic oscillator is used as a momentum indicator.
The settings speak for themselves period_1 is the current timeframe, 'current' period_2 is indicated - the senior timeframe is 4 or 5 times larger than the current one. For example, if the current one is 5 minutes, then the older one will be 20 minutes The rest of the
FREE

Alert System You use function keys to create horizontal lines for alerts. 1. Allow set horizontal line properties (line color, line style, line width, ...) for alerts. 2. Allow add text to horizotanl line. You can hide or show text when you need. You can change text and its price, but time of text will be set in input named "text_time" (0 is current time, you should test this input with -1, -2, -3 or lower). 3. It has 2 types of alert: above and bellow. You can set key to create them. If price i
FREE

This is a free version of the indicator, the period between the vertical lines is always 30 bars. In the paid version the period can be set by user, so a configuration with many ThreePointsChannel indicators with different periods is possible.
The principle of construction - on top of any number of bars set by the user, a channel is constructed with maximum and minimum lines so that the bars touch the maximum and minimum of the channel at exactly three points. The name of the indicator follows
FREE

Trend Fibonacci is a unique indicator that combines a power of Fibonacci sequences and ranges. Channel Group: Click Here
How to read:
- There are three zones --> red, gold and green
- Red candlestick = downtrend
- Green candlestick = uptrend
- Gold candlestick = no established trend
Inputs: Per = number of bars used for calculations FirstRatio = first Fibonacci ratio (Or use any ratio you want) SecondRatio = second Fibonacci ratio (Or use any ratio you want)
!! IF YOU PURCHASE TH
FREE

Simple Calendar Events is an indicator that will mark important Important Economy Events on your chart. For example, if you are trading something that is USD based, you would like to know when some important events are coming, you can expect some volatility or some different Price action, so you can base your strategy on it. If you trade something that is country based you can also choose that, and it will show you when the event is, so you can be prepared for it. When you hover with the mouse
FREE

Simple Trading Panel is a manual tool for safe trading. Monitored by the mentor and indicators. This panel has many useful settings to take your trading to the next level.
Simple Trading Panel offers features:
Adjustable stop loss, take profit, volume, trailing stop with profit in percent, risk ratio, news filter and much more. Test results Simple Trading Panel does not work in the strategy tester!
Recommend Account type: Hedging, Zero, Micro, Standard, Premium or ECN Brocker with low spr
FREE
This tool is designed to quickly calculate the lot depending on the Stop Loss.
The control is done by hot keys
By default:
1 - Limit order price level
2 - Stop Loss Level
3 - Take Profit Level
Space Bar - Open an order
Escape - Cancel All 9 - Open 2 orders
Market Order
To open a Market order, click (2) and set up Stop Loss with the mouse If you want to put Take Profit - click (3) and set up Take Profit with the mouse
FREE

" Outro " is an expert in automated " multi-symbol " trading that requires the trader to test on the pair of his choice and modify the entries according to his convenience. This Expert Advisor has been designed with non-optimized inputs, and uses a Martingale system for risk management. It is very important to read the blog post before you start. Enter to the private group . Outro uses two main indicators, Relative Strength Index and Stochastic Oscillator , for input decision making
FREE

Developed by Charles Le Beau and featured in Alexander Elder's books, the Chandelier Exit sets a trailing stop-loss based on the Average True Range (ATR). The indicator is designed to keep traders in a trend and prevent an early exit as long as the trend extends. Typically, the Chandelier Exit will be above prices during a downtrend and below prices during an uptrend.
Calculation
The original Chandelier Exit formula consists of three parts: a period high or period low, the Average True
FREE

Candle com coloração de Volume Price Analysis (VPA) segundo as definições da Anna Coulling, é possível configurar períodos de climax e rising, fator de extreme e fator de rising.
Pode-se usar volume real ou volume de ticks. O VPA considera a variação de preço por volume do período, indicando se um movimento está recebendo ignição, está em seu climax ou se já não existe mais interesse.
FREE

Many friends asked me for a simple, non-obtrusive, resource-friendly clock to track the time during their trades. It seems pretty obvious, but it is a must-have for those trading the market manually, waiting for the Market News, or just to visually know what time it is... Trading is an absorbing endeavor! So, here it is... Totally configurable, including Font Type, Font Size and Chart Location: Upper Left/Center/Right OR Lower Left/Center/Right, with a little twist of adjusting the Offset, just
FREE

Many traders use Price Action as entry and exit signal. Since the beginning of chart analysis, traders have found several candlestick patterns that can indicate possible "behaviors" of the market. Candlestick Pattern indicator is an indicator for MetaTrader platform that can detect many of these patterns and show them on screen or to alert traders about them. though they detect slightly different sets of candle patterns. Candlestick Pattern indicator also has a more modern look compared
FREE

Probability emerges to record higher prices when RVi breaks out oscillator historical resistance level. It's strongly encouraged to confirm price breakout with oscillator breakout since they have comparable effects to price breaking support and resistance levels; surely, short trades will have the same perception. As advantage, a lot of times oscillator breakout precedes price breakout as early alert to upcoming event as illustrated by last screenshot. Furthermore, divergence is confirmed in
FREE

Trend View is a simple indicator that shows in a text the trend of the current currency in the timeframe you choose. Inputs are: Color: color of the text. Timeframe: timeframe for calculations. Trend can be: UP: bullish trend. DOWN: bearish trend. ---: trend not defined. You can use this indicator to show the main trend of a bigger timeframe helping you to choose your trades. Note: text is draggable.
FREE

Highly configurable Awesome Oscillator (AO) indicator. Features: Highly customizable alert functions (at levels, crosses, direction changes via email, push, sound, popup) Multi timeframe ability Color customization (at levels, crosses, direction changes) Linear interpolation and histogram mode options Works on strategy tester in multi timeframe mode (at weekend without ticks also) Adjustable Levels Parameters:
AO Timeframe: You can set the current or a higher timeframes for AO. AO Bar Shift:
FREE

This indicator is stand alone version from MP Pivot Levels (All in one) containing Demark's Pivots.
Calculations: PP = X / 4 R1 = X / 2 - LOWprev S1 = X / 2 - HIGHprev Uses: When the pair currency price may change the direction of movement. Possible constraints of support and resistance that creates plateaus for the currency pair prices. Tendency identification by comparing the present prices according to current day's pivot point and also the prior day's pivot points. ___________
FREE

如果您喜欢这个免费工具,请留下 5 星评级! 太感谢了 :) “风险管理助手”EA 集合是一套全面的工具,旨在通过有效管理各种市场条件下的风险来增强交易策略。 该系列由三个关键组件组成:平均、转换和对冲专家顾问,每个组件都针对不同的交易场景提供独特的优势。
该 EA 是市场上标准风险管理策略的发展
https://www.mql5.com/en/blogs/post/756961
1.“平均助手”EA: MT4: https://www.mql5.com/en/market/product/115468 MT5: https://www.mql5.com/en/market/product/115469 2.“切换助手”EA: MT4: https://www.mql5.com/en/market/product/115478 MT5: https://www.mql5.com/en/market/product/115428 3.“对冲助手”EA: MT4: https://www.mql5.com/en/market/product/115466 MT5: https
FREE

This indicator sums up the difference between the sells aggression and the buys aggression that occurred in each Candle, graphically plotting the waves of accumulation of the aggression volumes. Through these waves an exponential average is calculated that indicates the direction of the business flow.
Note: This indicator DOES NOT WORK for Brokers and/or Markets WITHOUT the type of aggression (BUY or SELL). Be sure to try our Professional version with configurable features and alerts: Agr
FREE

I present the well-known Moving Average indicator connected to the ATR indicator.
This indicator is presented as a channel, where the upper and lower lines are equidistant from the main line by the value of the ATR indicator.
The indicator is easy to use. The basic settings of the moving average have been saved, plus the settings for the ATR have been added.
Moving Average Parameters:
MA period Shift MA Method
Moving Average Parameters:
ATR TF - from which timeframe the values are t
FREE

Auto Levels is a technical analysis indicator designed to automatically identify and draw support and resistance levels on price charts. The robot is capable of automatically identifying support and resistance levels based on historical price patterns, eliminating the need for manual analysis. You can set the maximum number of lines that the indicator plots as a parameter
FREE

The indicator shows Jake Bernstein's MAC (Moving Average Channel) System signals ---------------------------------------- System assumes several types of entering in trade, in this indicator only one type implemented - on closing of second trigger bar. It is recommended to start using this indicator together with Jake Bernstein's free lessons https://www.youtube.com/@JakeatMBH/videos Arrow shows signal bar - enter on closing or on opening of the next bar, cross - stop level, dot - minimum profi
FREE

The RFOC Mini Chart was created to project a macro view of the market, which the option to select the timeframe of interest other than the main chart, it is possible to include 2 indicators: 1 - Moving average channel On the mini chart, the moving average will be created based on the prices of the selected time frame for the RFOC Mini Chart. The moving average period must be selected in the indicator settings pannel.
2 - Boillinger Band In the mini chart, a boillinger band will be created base
FREE

T-Wallpaper. This is a very useful wallpaper that comes with trade manager panel. You can choose any wallpaper of your choice. Must add the WallPaper file to your MQL5 Data Folder. Follow this easy steps: Download the WallPaper files from our channel https://www.mql5.com/en/channels/transitbk98 Open MT5 Select files Open Data Folder Open MQL5 Open Files and past the Wallpaper folder Now the wallpaper will display. Wallpaper settings are found on the user input. Trade panel settings are found on
FREE

The EA works with several parameters that can be changed and set as desired. It always uses a stop loss that can be modified, it does not use grid and martingale. EA works ONLY with EURUSD - M15
It is recommended to use it first in a test environment to find the right configuration. Beware that past results are no guarantee of future results. You can lose all your assets. Enjoy the programme.
FREE

A countdown timer for the Volume bar chart generator and Tick chart generator products, which are available for download from the MQL5 Market: Tick chart generator: https://www.mql5.com/en/market/product/29215 Volume bar chart generator: https://www.mql5.com/en/market/product/47197
The counter conveniently displays the number of ticks or transactions (depending on the chart) that need to pass for a new bar to start printing.
The user can set the following indicator inputs.
Volume type
FREE

At first, I got my teeth into Dragon Ultra Expert Advisor. This Lesson is “Awesome”. In fact, It’s probably one of my best trading lessons I have ever written.
It took me at least 2 days of brain power and probably 20 coffees. Please pay it forward, share it with others. Enjoy.
Bruce Lee was arguably the best martial artist of all time, and guess what? He was not born the best martial artist of all time.
He earned that title through dedication and focus…he learned to become a MASTER of
FREE

Convenient tool for measuring the number of points between the prices directly on the chart. Displays in the measurement between points in percentage, points (financial) and time (bars ). Compatible with all graphical timeframes. When fixed on the chart is displayed in all timeframes. Press Ctrl, click the first point, move the mouse and will now display the measurement. Click again and fix. Very fast tool that does not occupy much space. Input Parameters Line Color Line Style Text Color Text Si
FREE
MetaTrader市场提供了一个方便,安全的购买MetaTrader平台应用程序的场所。直接从您的程序端免费下载EA交易和指标的试用版在测试策略中进行测试。
在不同模式下测试应用程序来监视性能和为您想要使用MQL5.community支付系统的产品进行付款。
您错过了交易机会:
- 免费交易应用程序
- 8,000+信号可供复制
- 探索金融市场的经济新闻
注册
登录