适用于MetaTrader 5的免费EA交易和指标 - 24

Did you ever feel irritated by manually adjusting Fibonacci retracement levels? Do you ever want to have a tool that was automatically adjust to certain Fibonacci levels with your trading? Well here is a tool for you: Fast Fibonacci indicator and Grid trader allows you to quickly adjust Fibonacci retracement levels or construct Fibonacci extension grid! You can also quickly setup your grid trading based on these levels - only with few clicks. Adjustable graphics, font sizes and graphics panels m
FREE

Colors generated according to trading volume and market direction.
The analysis is carried out following the direction of the price and volume traded if the traded value exceeds the calculation base the system changes the color to green, informing you that the price direction is strong to buy, if the traded value is less than the calculation base the system changes to red, indicating that the price is strong for sale.
FREE
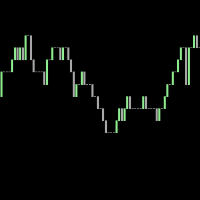
This is a tick indicator which compares the current bid price with the previous bid directly before it, and draws candles based on a comparison of the current ticks. It does not use historical ticks. Everything happens in real time, data moves from right to left, and the newest data arrives at the right. A trend line can be added which points in the direction of the price shifts.
FREE

This indicator's formula is quoted from that [NEW MARKET TIMING TECHNIQUES] by Thomas R. DeMark It consists of setup phase & countdown phase. But not Intersection & TDST. Countdown starts from the first of setup bar. It shows setup count number under the price & countdown number above the price on charts. SETUP: For buy first of setup bar; Close(4 bars ago)> Close(current)&Close(4 bars ago)< Close(previous bar). For sell first of setup bar follows opposite process. From the second bar; Close(4 b
FREE

DoubleMACD DoubleMACD DoubleMACD DoubleMACD DoubleMACD DoubleMACD DoubleMACD DoubleMACD DoubleMACD DoubleMACD DoubleMACD DoubleMACD DoubleMACD DoubleMACD DoubleMACD DoubleMACD DoubleMACD DoubleMACD DoubleMACD DoubleMACD DoubleMACD DoubleMACD DoubleMACD DoubleMACD DoubleMACD DoubleMACD DoubleMACD DoubleMACD DoubleMACD DoubleMACD
FREE

The Wave Splash technical indicator measures the deviation of the price of an instrument from the average values over a specified period of time. It forms divergence patterns with the price chart and generates leading signals that make it possible to timely detect signs of an upcoming correction in the price of an instrument or a reversal with a trend change even at the moment the price updates extreme values. The Wave Splash indicator is effective in an active market.
Settings:
S
FREE

Sharing-Is-Caring Trade Copier
Features Local & Remote copy One tool can act as provider or receiver of trades Co-exist with other positions opened manually or from other expert advisors Can be stopped and restarted at any time without any issues such as deals getting closed mysteriously Copy same lot or adjust according to your balance and leverage Partial close/open Manage max funds to use One provider can copy to unlimited number of receivers One receiver can copy from unlimited number of
FREE
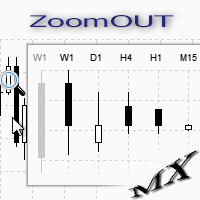
ZoomOUT allows you to have a quick look at a selected bar on a higher timeframe in a pop-up window. After the launch, the indicator works in the background mode occupying no place in the chart and consuming no resources. When activating the indicator by Shift + o (customizable), a pop-up window with a chart displaying bars of higher timeframes is created. To hide a pop-up window, left-click on any clear place on the chart. The indicator is simple and requires no settings.
FREE

Highly configurable Osma indicator.
Features: Highly customizable alert functions (at levels, crosses, direction changes via email, push, sound, popup) Multi timeframe ability Color customization (at levels, crosses, direction changes) Linear interpolation and histogram mode options Works on strategy tester in multi timeframe mode (at weekend without ticks also) Adjustable Levels Parameters:
Osma Timeframe: You can set the lower/higher timeframes for Osma. Osma Bar Shift: Y ou can set th
FREE

The indicator shows Jake Bernstein's MAC (Moving Average Channel) System signals ---------------------------------------- System assumes several types of entering in trade, in this indicator only one type implemented - on closing of second trigger bar. It is recommended to start using this indicator together with Jake Bernstein's free lessons https://www.youtube.com/@JakeatMBH/videos Arrow shows signal bar - enter on closing or on opening of the next bar, cross - stop level, dot - minimum profi
FREE

Positions panel
This is a panel for counting current icon holdings. Convenient traders at any time to view the position and profit and loss situation. Perfect for traders who like to hold multiple orders at the same time. Main functions: Position statistics Total profit Average price calculation TP price calculation ST price calculation Positions valume
FREE

Highly configurable MFI indicator. Features: Highly customizable alert functions (at levels, crosses, direction changes via email, push, sound, popup) Multi timeframe ability Color customization (at levels, crosses, direction changes) Linear interpolation and histogram mode options Works on strategy tester in multi timeframe mode (at weekend without ticks also) Adjustable Levels Parameters:
MFI Timeframe: You can set the current or a higher timeframes for MFI. MFI Bar Shift: you can set th
FREE

Highly configurable Relative Vigor Index (RVI) indicator.
Features: Highly customizable alert functions (at levels, crosses, direction changes via email, push, sound, popup) Multi timeframe ability ( higher and lower timeframes also) Color customization (at levels, crosses, direction changes) Linear interpolation and histogram mode options Works on strategy tester in multi timeframe mode (at weekend without ticks also) Adjustable Levels Parameters:
RVI Timeframe: You can set the lower/highe
FREE
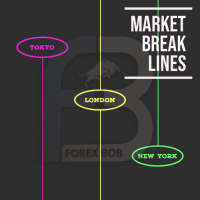
Market Break Lines is an utility tool to create a partition line at market openings/closings of Tokyo/London/NewYork sessions. This will help you to compare the market movements, volatility variations between the different markets.
Inputs: Inputs are simple to feed the time of Tokyo/London/NewYork sessions as per your broker server time Change Color and width of partition lines You can enable or disable any line (Hide/Show).
Please don't forget to support by giving handsome reviews/rating
FREE

This spread indicator displays the actual spread of each candle. It highlights the maximum spread and the minimum spread of the chosen symbol. This indicator is very helpful to see in real time the spread evolution helping to avoid taking a trade when the spread is too high.
Inputs:
Print value in Points: if true displays the spread as a whole number
D isplay minimum and maximum spread of the past N days: select the number of days to consider the maximum and minimum spread
Automatically
FREE

New candlestick alert, the alert appears according to the timeframe it is placed on. The indicator works on any asset, the alert can be silenced at any time, without the need to remove the indicator from the graph. It's great for those who can't keep an eye on the chart all the time. You can use this tool at work, college or anywhere else. It is also possible to receive signals directly on your cell phone by connecting to the metatrader. Aurélio Machado.
FREE

交易实用必备工具指标 波浪自动计算指标,通道趋势交易 完美的趋势-波浪自动计算通道计算 , MT4版本 完美的趋势-波浪自动计算通道计算 , MT5版本 本地跟单复制交易 Easy And Fast Copy , MT4版本 Easy And Fast Copy , MT5版本 本地跟单复制交易 模拟试用 Easy And Fast Copy , MT4 模拟账号运行 Easy And Fast Copy , MT5 模拟账号运行 强烈推荐趋势指标, 波浪的标准自动计算 和 波浪的标准自动计算MT5版本
合作QQ:556024" 合作wechat:556024" 合作email:556024@qq.com" 专业EA指标定制编写.
指标用于显示历史交易路径,方便大家看到本货币对的交易情况.
FREE

Sapphire Strat Maker Alt is an EA builder ( Expert Advisor Builder) . With it you can easily create new strategies and optimize them to find the bests parameters to improve your results at maximum. The objective is to bring the capabilities of MQL5 to everyone, even if you don't know how to code. Check out the Pro Version clicking here - Sapphire Strat Maker .
With this Expert Advisor you can create strategies by combining the indicators provided by the EA. A few of the functionalities a
FREE

TF M5 PAIRS: EURUSD;GBPUSD;USDCAD;
Overview Introducing the SwingOneShot EA , a sophisticated Expert Advisor designed to capitalize on breakout strategies with precision and efficiency. This EA is meticulously crafted to help traders identify and trade breakouts while minimizing the risk of false signals. Leveraging a blend of advanced technical analysis, dynamic risk management, and time-tested trading principles, the SwingOneShot EA is a robust tool for both novice and experienced traders
FREE

Donchian通道(唐奇安通道指标)是用于交易突破的最古老、最简单的技术指标之一。 一般来说,唐奇安通道的宽度越宽,市场波动就越大,而唐奇安通道越窄,市场波动性也就越小 。此外,价格走势可以穿过布林带,但你看不到唐奇安通道的这种特征,因为其波段正在测量特定时期的最高价和最低价。 交易实用必备工具指标 波浪自动计算指标,通道趋势交易 完美的趋势-波浪自动计算通道计算 , MT4版本 完美的趋势-波浪自动计算通道计算 , MT5版本 本地跟单复制交易 Easy And Fast Copy , MT4版本 Easy And Fast Copy , MT5版本 本地跟单复制交易 模拟试用 Easy And Fast Copy , MT4 模拟账号运行 Easy And Fast Copy , MT5 模拟账号运行 唐奇安通道指标计算: 唐奇安上阻力线 - 由过去N天的当日最高价的最大值形成。 唐奇安下支撑线 - 由过去N天的当日最低价的最小值形成。 中心线 - (上线 + 下线)/ 2 唐奇安通道信号 唐奇安通道常用作突破指标。它提供了两种主要类型的突破信号,一个是上阻力线或下支
FREE

Switch Tray 是提供给交易员的常用交易对快捷托盘工具,可置于图表的底部,可自行设置常用交易对。
1、可设置您的常用交易对的快捷切换按钮,默认【EURUSD/GBPUSD/XAUUSD/USDJPY/USDCHF/USDCNH】,/ 斜杠为分隔符,当前所在图表的交易对为蓝色按钮显示。其他为默认颜色,可设置多个交易对需看您的屏幕长度来决定。 2、每个交易对的按钮上还配有 某交易对的已开仓手数。 3、多周期快捷切换按钮,全周期【1M/2M/3M/4M/5M/6M/10M/12M/15M/20M/30M/1H/2H/3H/4H/6H/8H/12H/1D/1W/1MN】。1分钟、5分钟、1小时、4小时分别标有特殊颜色进行呈现。
FREE

This is addition of Effective SV squeeze momentum that add bolliger band and Keltner channel to chart window. Squeeze momentum introduced by “John Carter”, the squeeze indicator for MT5 represents a volatility-based tool. Regardless, we can also consider the squeeze indicator as a momentum indicator, as many traders use it to identify the direction and strength of price moves. In fact, the Tradingview squeeze indicator shows when a financial instrument is willing to change from a trending ma
FREE

指标简介
该指标不仅利用了价格计算,而且融入了成交量进行计算,目前为单边指标,只有出现向上的做多箭头信号。 单独使用该指标效果不显著,需要另外配合趋势类指标使用,然后寻找趋势出现的时间段,用该指标作为入场信号指标,效果类似于均线金叉,但有时候比均线金叉更提前显示信号。 该指标有4条线,根据价格和volume计算的线各自两条,价格计算周期和成交量计算周期均可手动输入设置,如果出现价格均线上穿成交量指标线会出现白色箭头信号。 该指标具有报警功能,当出现白色箭头信号,它能够发送邮件和massages到手机客户端,同时在电脑图表窗口发送Alert警报,因此不用一直盯盘也可以即时获得信号提醒,每次消息提醒重复次数可以手动修改。 它适用于所有时间框架,任何交易品种。 指标的信号如图所示, 我的其他指标和EA可在这儿找到: https://www.mql5.com/zh/users/hzx/seller
FREE

Imagine what results you could achieve in your manual trading if you had a tool that notifies you of a possible price reversal for all the symbols you are interested in at the same time (futures, stocks, forex or cryptocurrency)?
VSA screener is just the right tool. It was created for traders who value their time and make their own trading decisions on opening or closing a position. The software monitors the presence of trading patterns on the preselected tickers under several timeframes (up t
FREE

成功的关键永远是一个好的优化。
该系统有很多变量,在这种情况下,它的简单性是其成功的关键。
系统会寻找不同的 "缺口 "作为入市失败的原因,然后通过一系列移动平均线进行调试,决定是否入市。 这是一个简单但功能强大的系统。
变量如下。
Lot: 定义手数。
TakeProfit: 定义获利点数
Stop Loss:定义了止损的点数。定义止损,单位为点。
这三个变量特别重要,因为它们将决定交易系统的性能和功能。
敏感度。它是交易机器人用来执行销售的差距大小,在这种情况下,数值越小,它将执行更多的行动。
一个数值为负数的缺口将决定买入行动,而一个数值为正数的缺口将决定卖出行动,然而它们将由移动平均线来分析决定是否入市。
在这种情况下,缺口,是市场大变动的标志,出现了不规则的价格情况,在这种情况下,交易机器人会进行分析,并进行对我们有利的交易,以确定我们在这种情况下是否积极进行交易。
时间框架(Thetimeframe)。这是一个预定义的值,用于寻找变量 "敏感 "的差距,因为对于移动平均线来说,这个数字越低,将执行更多的行动。
移动平均线周期
FREE

Что такое RSI? Индикатор RSI (Relative Strength Index, индекс относительной силы) — это индикатор, который измеряет соотношение восходящих и нисходящих движений. Расчет ведётся таким образом, что индекс выражается в диапазоне от 0 до 100. Как понять RSI?
Если значение RSI находится равно 70 и больше, считается, что инструмент находится в состоянии перекупленности (ситуация, когда цены выросли выше, нежели того ожидал рынок). Значение RSI на уровне 30 и ниже считается сигналом о том, что инст
FREE

Chaikin 的波动指标计算最大和最小价格之间的价差。它基于最大和最小之间的幅度来判断波动性。不像 平均真实范围 , Chaikin 的指标没有将跳空考虑在内。 根据 Chaikin 的解释, 在相对较短的时间里交易量增长, 意味着价格即将抵达最低点 (就像证券的恐慌性抛盘), 而在较长的时间周期里波动降低, 意味着价格处于峰值 (比如, 在成熟的牛市条件下)。
FREE

The Expert Advisor tool has been developed for Nasdaq, based on Vortex and pending orders. The stop loss is based on fixed pips. It has been backtested on more than 10-year long M1 data with high quality of modeling. The enclosed screenshots demonstrate the complexity and coverage of the test by Monte Carlo analysis with 200 simulations. T he Expert Advisor passed via Cluster Analysis, Optimization profile, System parameter Permutation. There is no need to set up parameters - all settings are al
FREE

Volume Cross Over is an indicator that measure positive and negative volume flow in a financial instrument, such as a stock, commodity, or index. It is base on the idea of On-Balance Volume developed by Joseph Granville. However instead of trending lines, this indicator shows volume cross over. When the closing price of an asset is higher than the previous closing price, then the Bull volume is greater than zero and Bear volume is negative. It suggests that buying volume is dominating, and
FREE
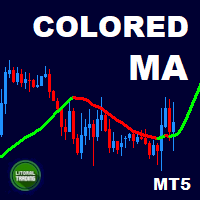
Are you the type who likes to use moving averages and surf the trend? Me Too! that is why I developed this indicator. It is basically a moving average that changes the color according to the trend (up or down). Its appearance can be customized and the price method too. The setup is very simple, no need to explain. If you have any questions or find any errors please contact us! Enjoy!
This is a free indicator, but it took hours to develop. If you want to pay me a coffee, I appreciate a lot <3
FREE

Что такое CCI индикатор? Стандартный Индикатор CCI (Commodity Channel Index) – это осциллятор, который измеряет силу, стоящую за тем или иным движением цены. Он помогает определить, кто находятся у руля: быки или медведи. Как и многие осцилляторы импульса, CCI работает, сравнивая текущую цену с предыдущими показателями, и на основе этого сравнения он решает, насколько сильное движение цены вверх/вниз.
Как рассчитать CCI? Метод расчета стандартного индикатора представляет собой оригинальн
FREE

SPREADEX e' un indicatore per MT4 e MT5 che indica la distanza dell'ASSET dal GP. il GP e' il prezzo del vero valore dell'ASSET sottostante ottenuto per stima. Il GP e' come una calamita, attira il prezzo dell'ASSET con alta probabilita' ed all'interno della stessa giornata di trading. Quindi SPREADEX indica quali sono gli asset piu distanti dal GP al momento in tempo reale. Fornendo un punto di vista al TRADER su quali asset concentrarsi e cercare eventuali segnali di inversione dei prezzi per
FREE

Investment Castle Volatility Index has the following features: 1. This indicator shows the volumes of the current symbol and the market volatility. 2. This indicator is built-in in the Investment Castle EA which works as volatility index for the EA dynamic distance and opposite start. 3. Parameters available for optimization for each pairs. 4. Works with any chart.
FREE

Course Crystal是一種幫助交易者確定市場趨勢方向的指標。 它使用獨特的演算法來分析價格變動,並將結果顯示在圖表上的彩色區域中。 藍色表示買入機會,紅色表示賣出機會。 使用說明 - https://www.mql5.com/en/blogs/post/757800 手動交易系統:
趨勢確定:Course Crystal 指標分析當前和過去的價格資料以確定趨勢的總體方向。 如果大多數數據顯示價格上漲,則該指標會變成藍色。 如果數據顯示價格下跌,則指示器變為紅色。 進入交易的訊號:當指標的顏色從紅色變為藍色時,這可能是買入訊號。 當指標顏色從藍色變成紅色時,可能是賣出訊號。 風險管理:始終為每筆交易設定停損和獲利來管理風險非常重要。 建議將停損設定在高於(買入)或低於(賣出)最後高點或低點的水平。 退出交易:當達到停盈或停損水準或指標向相反方向改變顏色時,交易關閉。 請記住,沒有任何指標是 100% 準確的,將指標與其他技術分析和風險管理工具結合使用始終很重要。 交易愉快!
FREE

The SyntheticaFX Indicator serves as a valuable tool for identifying potential regions of price reversal in the market. It achieves this by scrutinizing how an asset's price has historically reacted to specific levels, enabling it to pinpoint areas where a shift in market direction may be imminent. This indicator is presented in a dedicated window, featuring bars along with a central reference line set at 0.00. These elements collectively convey crucial information about the prevailing market se
FREE

Candle size oscillator is an easy to use tool to figure out candle size from highest to lowest price of each candle. It's a powerful tool for price action analysts specifically for those who works intraday charts and also a perfect tool for short term swing traders. Kindly note that you can also edit the Bullish and Bearish candles with different colors.
#Tags: Candle size, oscillator, price action, price range, high to low, candle ticks _________________________________________________________
FREE

This is a simple EA Can only open ONE trade EVER then MUST be reattached to the chart everytime you want to use it. Designed to help manual traders Has lot sizes and stops / targets in pips. For a buy trade the engulfing bar must close above the previous red bars high Includes Alarm and Phone notifications
Basically if you find a price zone you like and will take a trade if there is an engulfing bar . use this.
FREE

Product Description: Adaptive Y-Axis Scaling is a powerful MT5 indicator designed to enhance your trading experience by providing precise control over the Y-axis (price) scaling of your charts. This innovative tool allows you to customize the price scaling by specifying the number of pips from the visible chart's highs and lows. The calculated price range from this input is then used to set the maximum and minimum prices for the open chart, ensuring an optimized and comprehensive view of market
FREE
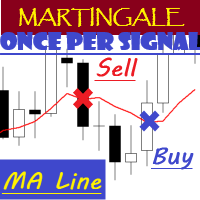
EA "MA Line" with martingale feature
EA will open position once per signal
To see how EA works, please watch the video below. In the video, I perform parameter optimization and do a backtest. The parameters that are optimized are: - MA Period - Stop Loss - Take Profit
For the future, I will try to optimize and test EA, especially the expert advisors in the mql5 community. hopefully it can be useful for colleagues in the mql5 community.
FREE

FREE

EA可以通过搜索并平掉盈利仓位来平掉无利可图的仓位 。
该助手 在所有位置中 寻找 终端中 最 无利可图的位置 。 进一步地,通过搜索剩余的盈利头寸,他计算出当一个或多个头寸的 利润 大于另一个头寸的损失时可以弥补损失的一系列头寸。 如果找到一组此类头寸,顾问就会将其平仓。 一系列位置可以由任何位置组成。 它们的最大数量可以在顾问设置中调整。 您还可以指定搜索的最小损失和平仓的额外利润。 MT4版本
详细描述 如何购买
如何安装
如何获取日志文件 如何测试和优化 Expforex 的所有产品 您可以在策略测试器中测试 Expert Advisor,并在可视化模式下使用我们的 EAPADPRO 工具栏进行交易! 近减加加在图表上的工作原理 认为 您以 1.600 的价格开设买入 #1 仓位; 价格跌至 1.550 ,目前亏损 -50点; 盈亏平衡点(平均价格)= 1.600 ; 如果我们打开 SELL #2、Sell #3 和 Sell #4; EA 交易开始执行主算法。 那么总利润将为+5$; 智能交易系统 (EA) 激活算法,并且
FREE

探索市场极限并抓住每一个机会是ZenithNadir Blueprint策略的精髓。ZenithNadir Blueprint是一种独特的交易策略,专为那些勇敢的投资者设计,他们在市场低谷寻找机会,并在市场巅峰果断回撤。受经典的马丁格尔加倍策略启发,它旨在通过精心规划的入场和退出机制来最大化投资回报。
然而,就像所有需要坚实基础的伟大梦想一样,ZenithNadir Blueprint策略也不例外。它的成功建立在对市场动态的深刻理解和彻底的风险管理之上。每笔交易不仅代表一个精确的机会时刻,还包含谨慎的风险评估。
选择ZenithNadir Blueprint意味着踏上一条非凡之路。投资者需要拥有决心和勇气,同时还需要智慧和策略。我们深知,在追求利润的同时,风险管理是不可或缺的。因此,ZenithNadir Blueprint策略经过深思熟虑地设计,为投资者提供了一个交易计划,使他们能够在市场高涨时享受,而在市场低迷时保持冷静。
总的来说,ZenithNadir Blueprint不仅仅是一种交易策略;它是一种投资哲学。它教导我们在市场波动中找到平衡,并以智慧和耐心拥抱每一
FREE

Fundamentação teórica Rate of Change - taxa de mudança (ROC) O ROC é um oscilador que flutua acima e abaixo de uma linha de zero, medindo a variação percentual de preços ao longo de determinado período. O ROC de 20 períodos mede a variação percentual de preços ao longo de 20 períodos, quanto maior a diferença entre o preço atual e o de 20 períodos atrás, maior o valor do ROC. Quando o indicador está acima de zero, a variação percentual é positiva indicando tendência bullish, se o indicador está
FREE
Equity monitor
This is a simple means change informer. I wrote it for myself, maybe someone will need it...
1. Displays the change in funds for the day. Every day, when the terminal is first launched, it remembers the current funds and monitors changes throughout the day.
2. The first day of the month, well remembers the money and, within months, to monitor changes.
3. Well, it displays the profit of the open position.
To work, you need to create 4 global variables: gvarEqityDay ,
FREE

This indicator is based on Volumes standard indicator, calculates the average of Volumes based on the last N bars set by users, and if the value of the volume is bigger then a set % respect the average a different color will be used. The indicator is shown in a separate indicator window. This version has now a limitation in setting the % about the threshold.
If you are interested to set threshold consider to buy the PRO version ( https://www.mql5.com/en/market/product/35925 ) If you want to use
FREE

About This Indicator: RSI vs SMA Oscillator: A Comprehensive Technical Analysis Tool for Better View of Market Price
The RSI vs SMA Oscillator is a powerful technical analysis tool designed to understanding Market Price Fluctuation for buy or sell signals. This user-friendly Oscillator good for both novice and experienced traders, providing valuable insights into market trends and price movements. Key Features: - RSI Cross Alert: The indicator is based on the Relative Strength Index (RSI), a po
FREE

Backtesting PRO: Make a review of the market based on the available history of your broker. Practice your strategies and verify them in seconds. Remember to maintain excellent risk management, check your days and hours of operation. R emember to start it in the shortest period to operate. Any questions or suggestions can be sent to this email: autoeducacion0110@gmail.com
FREE

Great dashboard for market analytics. Help you to analyze the values of the Moving Average indicator and prices.
Using this dashboard you can: find signals from the Moving Average from all timeframes; find signals from the Moving Average from all symbols; check - how far the Moving Average is from the price; check - the Moving Average value has changed; 2 types of signal.
Modes of operation (switched by a button on the graph): current value of Moving Average; the difference between the cu
FREE

Expert Advisor Description EA TugOfWar will open both buy and sell positions at different times according to the triggered signal, the most positions and in accordance with the market direction that will win and profit. Profit target per war is 1% to 5%. Warmode normal = Longterm strategy Warmode extreme = Shortterm strategy
Parameter Description StartTrade = Time to start trading / open position EndTrade = Time to end trading / open position WarMode = 1 -> Normal, 2 -> Extreme (lots of t
FREE

Price live on the Chart Description: The Real-Time Price Display is a powerful tool for MetaTrader 5 users that provides continuous updates of the current bid (SELL) and ask (BUY) prices directly on your trading chart. This script is ideal for traders who need to stay updated on market prices at a glance. Key Features: Live Price Updates : Displays the latest bid and ask prices for your selected trading symbol in real-time. Customizable Display : Adjust the horizontal and vertical position of th
FREE
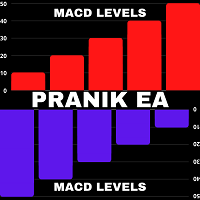
Easy to use EA designed to auto trade. Works in every market condition. It uses reliable levels of MACD indicator combined with unique logic to perform fully automatic trading operations. *For MT4 version please go here! *If you don't like automated system and only need an alert system to help you in trading. Please check this arrow with alert system here!
FEATURES: Dangerous methods like martingale, hedge, grid or scalping are NOT used. Each position has Stop Loss and Take Profit. Positional
FREE

SterlingSniperBot is an advanced trading algorithm meticulously designed for the GBP/USD currency pair, specifically tailored to operate on 4-hour bars and synchronize seamlessly with brokers in the UTC+2 time zone. This sophisticated bot stands out as a precision instrument in the world of forex trading. Key Features: Timeframe Optimization: Operating exclusively on 4-hour bars, SterlingSniperBot focuses on capturing strategic trading opportunities within this specific time frame, aligning with
FREE

Colors generated according to the Height and Depth parameter.
The analysis is carried out following the direction of the price and volume traded if the traded value exceeds the calculation base the system changes the color to green, informing you that the price direction is strong to buy, if the traded value is less than the calculation base the system changes to red, indicating that the price is strong for sale.
FREE

The utility is a checklist where you can write all the rules of your trading system and keep it on the chart in front of your eyes. As a rule is executed, mark it with a tick. To the right of each rule, you can write the "strength" (percentage) of the rule. And if there is a tick next to the rule, then all "forces" are summed up in the "Total" line.
For the convenience of visual perception, you can set the color for displaying the “Total” value.
Panel options: Title - The title of the panel
FREE
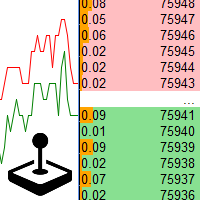
Playback of previously saved data from the order book.
Key features: Historical data navigation Adjusting the playback speed with the "---" and "+++" buttons, as well as with the mouse, you can by scrolling the wheel over the area of these buttons and between them Turning Price Centering On and Off Time display accurate to thousandths of a second Attention: This product also needs a utility to save data: https://www.mql5.com/en/market/product/71642
FREE

Algo Edge EA This EA only SELL download the second EA for BUY and Run it both. -DE40/ Tec100 Self learning EA just set the EA on the Chart and Start no Settings optimization.
AUD/USD, EUR/USD, DE40, US30, Tec100 and much more. Multifunctional Expert Advisor can trade with every Forex Pair or Indize. EA can Trade with every Broker. M1 high, M30 medium, H1 low Risk. Functions: For other Indize example US30: Change the Robot Worktime in Europe to 16:30-21:30.
-inp1_ =Robot Worktime inp_2 and
FREE

At first, I got my teeth into Dragon Ultra Expert Advisor. This Lesson is “Awesome”. In fact, It’s probably one of my best trading lessons I have ever written.
It took me at least 2 days of brain power and probably 20 coffees. Please pay it forward, share it with others. Enjoy.
Bruce Lee was arguably the best martial artist of all time, and guess what? He was not born the best martial artist of all time.
He earned that title through dedication and focus…he learned to become a MASTER of
FREE

Indicador Multiple Regression Indicador faz o plot da Curva de Retorno e dos canais superior e inferior de uma regressão para os preços de fechamento do ativo do gráfico. A Curva de Retorno é a linha central do indicador e representa a região de equilíbrio do preço entre vendedores e compradores. Nesse indicador o usuário escolhe o tipo da regressão podendo ser de 3 tipos: primeiro grau, segundo grau ou terceiro grau. Os plots do indicador são: Linha central – cor padrão preta; Linha superi
FREE

Hyper Force指标最初由David Weis于1984年创建,以波形形式显示符号趋势的强度。
波浪越大,趋势越强。
小浪意味着弱势的趋势或没有趋势的市场。
在波浪中,一个柱线和另一个柱线之间的差异越大,趋势越强。
当一个条形图和另一个条形图之间的距离开始减小时,这意味着该波已经开始失去其趋势。
因此,以强大的力量抓住浪潮并在浪潮减弱时走出去是理想的。
其他指标,例如移动平均线,MACD可以帮助您有力地确认这一趋势。
当一个条形图和另一个条形图之间的距离开始减小时,这意味着该波已经开始失去其趋势。
因此,以强大的力量抓住浪潮并在浪潮减弱时走出去是理想的。
其他指标,例如移动平均线,MACD可以帮助您有力地确认这一趋势。
FREE

Convenient tool for measuring the number of points between the prices directly on the chart. Displays in the measurement between points in percentage, points (financial) and time (bars ). Compatible with all graphical timeframes. When fixed on the chart is displayed in all timeframes. Press Ctrl, click the first point, move the mouse and will now display the measurement. Click again and fix. Very fast tool that does not occupy much space. Input Parameters Line Color Line Style Text Color Text Si
FREE

Indicator of Stowell's Three-Bar Net Line. In this indicator, the number of bars used for determining the lines can be defined in the settings. With the default settings, the indicator draws arrows in the areas of the line breakout. The lines are not displayed on the chart by default. but can be enabled.
Parameters Alerts - enable alerts when arrows appear. Arrows appear on a forming bar and can disappear during bar formation. Therefore, it is recommended to wait for the bar with the arrow to
FREE
SmartSetup Bot Is an advanced trading tool that combines the flexibility of manual configurations with the power of semi-automated features. It automatically generates graphical objects, displaying critical zones such as support and resistance levels, stop loss and take profit areas, and other essential indicators. SmartSetup Bot provides clear and precise visualization of your trading parameters, facilitating informed decision-making. This bot is designed for traders who value manual control bu
FREE

El Trend Detection Index (TDI) es un indicador técnico introducido por M. H. Pee. Se utiliza para detectar cuándo ha comenzado una tendencia y cuándo ha llegado a su fin. El TDI puede usarse como un indicador independiente o combinado con otros; se desempeñará bien en la detección del comienzo de las tendencias.
Los indicadores de tendencia son esenciales para detectar las tendencias de los mercados financieros. Estos indicadores ayudan a determinar la dirección que probablemente siga el acti
FREE

Key Features: Robust Algorithm: Based on John F. Ehlers’ renowned Fisher Transform formula, our indicator excels in pinpointing major price shifts, facilitating more informed trading decisions. Versatile Application: Works seamlessly with any asset, including forex, stocks, commodities, and indices, offering wide-ranging applicability for diverse trading strategies. Customizable Settings: Tailor the indicator to your trading style with adjustable parameters, including the transformation length,
FREE
Reverse TradeCopier for Followers can copy trades from an account that is running Reverse TradeCopier for Source . Features: Copies trades from one source (master) account to multiple following (slave) accounts. Allow investor (read only) password for source (master) account. There are no complicated settings and input parameters, everything is easy. Works with different brokers. Works with different quotes symbols (EURUSD_FX, eurusd_m, etc.). Can copy orders from 4-digit quotes platform to 5-
FREE

The DD_ATR MT5 indicator is a trading tool developed by the Dagangduit Core Team . This indicator is designed to calculate and display the Average True Range (ATR) in real-time, providing traders with essential volatility information to aid in their trading decisions. Key Features: ATR Calculation : Calculates and displays the ATR for the selected timeframe. Multiple Timeframes : Displays ATR values for multiple timeframes (M1, M2, M3), giving traders a comprehensive view of market volatility.
FREE

This Expert Advisor is designed for news trading. This version is the free version for MT5. The amount of news to handle is limited to 5 news in USDPY (0.01 Lot). Please find below the other versions of this expert (The Pro versions have not limitations) : News Advisor MT5 Pro. News Advisor MT4 Pro. News Advisor MT4 Free. The main advantage of this expert is that it’s offering backtesting capabilities (something that is not found in most news expert advisors). This ability gives you the opportun
FREE

As a seller, I have a unique Expert Advisor on the MQL5 Market which I would like to offer. Even though I cannot guarantee success with this product, I can assure that it works and that it will help the consumer pass their Prop Firm challenges. It can be successfully used with 1H time frame and on the GBPCHF currency pairs but it can also be applied to other symbols and time frames.
Moreover, I am offering a free risk management EA as an GIFT with this expert advisor. It will help users detec
FREE
Please, if you like this AE, I would appreciate it if you could rate it with 5 stars ️ ️ ️ ️ ️ THANK YOU!!
Expert Advisor based on the signal generated by two MACDs (Moving Average Convergence Divergence), which can trade on different time frames (M1, M5, M15, H1, H4, etc.) The Expert has the following variables: >>>>>>>>>>>>>>>>>>> Magic number Slippage >>>>>>>>>>>>>>>>>>> Stop Loss (pips) Take Profit (pips) Trailing Stop (pips) Trailing Step (pips) Money management: Lot o
FREE

Transform your way of analyzing the market with our innovative trend and support/resistance indicator!
By combining the robustness of pivot points, the sensitivity of price adjustment, and the reliability of moving averages, our indicator provides a comprehensive and intuitive view of price behavior. Whether to detect emerging trends, track significant price shifts, or map critical support and resistance zones, this tool is your reliable guide amidst market volatility (BMF WIN).
T ested f
FREE
MetaTrader市场是 出售自动交易和技术指标的最好地方。
您只需要以一个有吸引力的设计和良好的描述为MetaTrader平台开发应用程序。我们将为您解释如何在市场发布您的产品将它提供给数以百万计的MetaTrader用户。
您错过了交易机会:
- 免费交易应用程序
- 8,000+信号可供复制
- 探索金融市场的经济新闻
注册
登录