MetaTrader 4용 새 Expert Advisor 및 지표 - 262
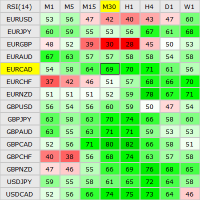
This indicator shows the current RSI values for multiple symbols and multiple timeframes and allows you to switch between timeframes and symbols with one click directly from the matrix. With this indicator, you can analyze large number of symbols across multiple timeframes and detect the strongest trends in just a few seconds.
Features Shows RSI values for multiple symbols and timeframes simultaneously. Colored cells with progressive color intensity depending on the RSI values. Ability to chan

Are you tired of plotting fibonacci retracements or extensions manually? This indicator displays fibonacci retracements or extensions automatically, calculated from two different price points, without human intervention or manual object anchoring. [ Installation Guide | Update Guide | Troubleshooting | FAQ | All Products ] Easy to use Manual anchoring is not needed Perfect for price confluence studies The indicator evaluates if retracements or extensions are needed Once drawn, you can manually

The BuySellArrows is a seemingly simple and very persistent indicator. All traders had come across indicators that contain numerous input parameters that will change Buy and Sell position when you change those parameters value. Many traders asked what parameter's value will be more accurate. So, I decided to make an universal indicator without any input parameters. In this case you will have very stable indicators without any worries that you put some wrong numbers. This indicator will show Buy

Harrow Band is an indicator based on support and resistance values. This indicator provides six bands that indicate the nearest of support or resistance position. With this indicator, it will be easier to see where entry and exit points of a trade are located.
Pairs and Timeframes This indicator can be used in any pairs and timeframes, but it is recommended to use it in XAUUSD H1.
Parameters NumCandle - number of candles used to calculate the support and resistance position. BandColor - colo
FREE

We-Trend MT4 indicator made by the We-Trading team is designed to study supports, resistances and trend filters. We-Trend is the tool that works also as a trend filter on all major trading strategies. We-Trend write for you horizontal lines (supports or resistances) on all timeframes.
UP Trend, Down and FLAT The We-Trend helps to understand the direction of the trend. Red or Green Horizontal lines show supports and resistances Trend comment show the main trend of the current TimeFrame, and oth

This indicator shows the crossing between three moving averages (slower, middle and faster ones). When fast MA crosses up middle MA and middle MA crosses up slow MA, the bullish alert is issued. When fast MA crosses down middle MA and middle MA crosses down slow MA, the bearish alert is issued. Signals to close buy positions are generated if fast MA crosses middle MA downwards, signals to close sell positions are generated if fast MA crosses middle MA upwards.
Inputs Fast MA Setup MAPeriod1 =

Abyss EA is a long-term Expert Advisor using the breakthrough of price levels in its algorithm. The EA sets the buy stop and sell stop orders at certain levels. All trades are accompanied by stop losses exceeding the expected profit several times. Profitable trades are accompanied by a trailing stop triggered when the order reaches a certain profit. All trades are closed on the selected day of week, so there is no sitting out the losses. You are also able to use the auto lot. The EA does not use
FREE

The Supertrend Line indicator shows you the trend using calculation based on the ATR.
How does it work? The Supertrend draws a line following the current trend, this line is the result of calculation made with the ATR. A Line under the candle means a likely bullish trend A Line above the candle means a likely bearish trend
How to trade with CSL indicator Buy when the Supertrend line is below the price, Sell when the Supertrend line is above the price. It is strongly suggested to use this ind
FREE

The Expert Advisor trades during the Asian session according to the CCI, Bollinger Bands indicators. If the price moves in unfavorable direction, an order grid is placed, with a dynamic step depending on the indicator values. The EA features a breakeven function, four position exit filters. Recommended Brokers: Alpari , IC Markets , FortFS Real account signal of the EA: https://www.mql5.com/ru/signals/539949
Recommend deposite: 1500-2000$ per 0.01 lot Recommended ECN broker: IC Markets
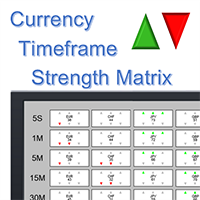
What is it? The Currency TimeFrame Strength Matrix is a simple and comprehensive Forex map that gives a snapshot of what is happening in the Forex market at the very present time. It illustrates the strength and momentum characteristics of each single currency (AUD, CAD, CHF, EUR, GBP, JPY, NZD, USD) with respect to different time frames (5 seconds, 1m, 5m, 15, 30m, 1h, 4h, 1d) independently. The most unique visualization, encompassing multi currency, multi time frame and multi trend analyses al

Biwavelet is an indicator for harmonic forecast of the market based on one-dimensional wavelet transform functions. Wavelet transforms are one of the main tools of digital algorithmic trading. This is due to their ability to analyze and predict processes occurring in two independent basic dimensions - price and time. Wavelets have significant advantages over the Fourier transform, because wavelet transform allows evaluating not only the frequency spectrum of the price signal, but also the time a

This intraday scalper Expert Advisor trades by capturing sharp jumps during a high market volatility. It can work both with market and pending orders. Most of the time, the EA is in standby mode, therefore do not expect fast results immediately. FIFO compliant. Only one market order can be opened on each symbol at a time. No martingale, no grid, no hedging Attention! This EA relies on the movement speed of the quotes, and requires a VPS server for stable operation. The recommended minimum deposi
The AllClosedMT4 utility in the form of an expert. The utility is designed for closing all open positions simultaneously based on the total profit (in the deposit currency) of all open positions. The utility can be attached to any chart with any trading instrument.
Parameters Profit - the total positive profit in the deposit currency, at which all open positions are closed (profit). Stop - the total negative profit in the deposit currency, at which all open positions are closed (loss). The val
FREE

This expert is a tool which helps every trader to see the historical results by magic number or orders' comment.
You can to get source code from here .
Parameters MagicNumber - Here we put the orders' identifier ID we want to analyze. OrdersComm - Here we put the orders' comment we want to analyze.
How use it Add file in "expert" folder. Attach expert on a chart with your settings (MagicNumber or OrdersComm).
FREE

The Percent Pivot indicator is a simple indicator that calculates the main percentage values. The graphical layout makes it very similar to the traditional pivot but its internal computing system is unique and irreplaceable. Every day, the market creates new bullish or bearish rates. This indicator help you to identify possible supports or resistance levels. The main values such as 0.25% and 0.50% are good reference points to use as potential target or reversal levels. This indicator has been de

The indicator builds the ranges of the probable price movement according to the specified timeframe. The range is built starting from the Open level of the specified timeframe and extended to the timeframe's Close, shifting relative to the extremes. The upper boundary is laid from the minimum and moves only downward when the Low is updated. The lower border is laid from the maximum and rises only when the High is updated. When the price approaches the range boundaries, the probability of movemen

The system resembles the Italian flag and is simple for ordinary people to understand. Any trader with any experience will be able to use it. The Italy trading system generates 3 types of market conditions. Green zone - consider only buy trades. Red zone - consider only sell trades. Empty zone - flat, do nothing. Buy signal: Green zone + a blue arrow appears. Close all positions when an opposite signal (arrow) appears. Sell signal: Red zone + a red arrow appears. Close all positions when an oppo
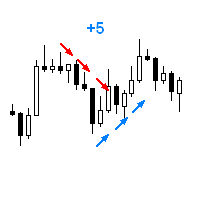
The Expert Advisor opens a trade in the specified direction at the specified time. If the price moves in the profit direction, additional trades are opened after a preset step. Trade are closed by a Stop Loss or upon reaching a target profit. The Expert Advisor trails the stop loss order, and is provided with multiple breakeven and trade closing functions (See the description of the parameters). Test and optimize the EA in the Tester using M1 open prices. The EA parameters can be controlled via

The Broken Level automated Expert Advisor uses strong levels, that stand against the main trend, and opens orders along the trend when those levels are broken. Broken Level enters the market by its own unique algorithm using pending stop orders with predefined stop loss and take profit. This minimizes the slippages when opening trades, and stop loss prevents the unforeseen losses. The order placement point, take profit and stop loss values are calculated by the price change analysis algorithm, w

This Expert Advisor is based on advanced neural networks. The main EA feature is the depth of the neural analysis. Monitoring of my accounts: https://www.mql5.com/en/signals/author/mizrael
Features and operation principles After training, the EA recognizes the ascending, descending and sideways trends . After calculating the neural network, the EA places a market order with a fixed Take Profit and Stop Loss . The EA sets the Take Profit and Stop Loss levels on its own. But Take Profit is alwa

HLC Bar indicator is a market analysis tool. Unlike standard bar chart (Open-High-Low-Close), this indicator shows High-Low-Close prices only. Therefore, trader would focus on key elements of price action. It's very easy to use, no complicated setting, apply to any financial instrument, like Forex, CFD etc. Just open symbol chart, load indicator then enjoy.

The LexusBO indicator is recommended for trading binary options . Signals are generated when the RSI, ADX, CCI indicators cross the customizable levels. The indicator displays signals using "up/down" arrows on the chart. Their values are available in the buffer arrays (buffer with index 0 - "up" arrow, with index 1 - "down" arrow). This makes the indicator easy to use for automated trading through specialized Expert Advisors. The recommended timeframe is M5. The indicator has a built-in counter
FREE

This strategy is based on Bollinger Band to open the first position, if the position moves to the opposite side out of the Hedging Range, then a locking position is opened with an increased volume to help get out of the opposite trend. Real monitoring signal will be published soon. Recommended 0.01 Lot for each 3000$ Balance.
Input Parameters Starting lot size - First open position size Use autolot - Use auto calculation of starting lot size based on balance Balance - Use to calculate auto sta

We are happy to present you the "Info Trader" information indicator. As we are traders ourselves, we create software that we primarily use in our own trading practices. During intraday multicurrency trading we were constantly in need of a "ready to use" info panel. You have probably noticed that it is necessary to make a decision on taking profit on the account with consideration of profit on multiple instruments. To do this, you need to see the whole picture of each trade in detail. “Info Trade

A mathematical multicurrency trading system based on the principle of a neural network. It uses several thousand of the most stable trading algorithms in its work. Before getting into the "А2М1" general database of algorithms, each block of conditions has passed the testing for stability with the identification of certain market dependencies for that block. A network created in such a way allows the EA to automatically select the most optimal variant of response to the market situation from seve

Laguerre SuperTrend Clouds adds an Adaptive Laguerre averaging algorithm and alerts to the widely popular SuperTrend indicator. As the name suggests, Laguerre SuperTrend Clouds (LSC) is a trending indicator which works best in trendy (not choppy) markets. The SuperTrend is an extremely popular indicator for intraday and daily trading, and can be used on any timeframe. Incorporating Laguerre's equation to this can facilitate more robust trend detection and smoother filters. The LSC uses the impro
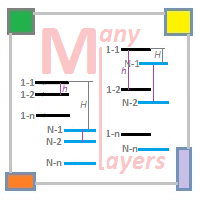
Trading is performed using multiple independent layers - number_of_commercial_layers . Flexible customization system of market entry signal - UNIT_INDICATORS . The use of the Moving Average , RSI and Envelopes indicators allows configuring any parameter of the indicators and enabling/disabling them. Signals are generated based on cumulative analysis of indicators from different timeframes . It is possible to control the equity level - CONTROL_EQUITY . Two danger levels: the first level activate

The EA generates signals about changes in the trend. Signals can be generated using different RSI-based strategies. When a position is opened, it is equipped with a take profit and a stop loss. If the position becomes profitable, a dynamic stop loss based on the specified values (TrailingStep and DistanceStep) is set for it and constantly trailed. This allows you to always close positions in profit.
Parameters Main Settings LotSize = 0.01 - fixed position volume. LotAutoSize = false - enable d
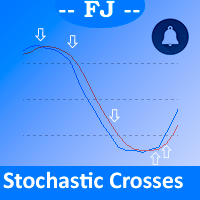
This indicator is intended to solve all kind of lines K and D crosses to generate different alerts when needed, and multicolored K line.
Features You can define an Stochastic as you could do on MetaTrader native Stochastic indicator, all the parameters are copied to get it. You can show all the K and D lines crosses You can select from all the K and D crosses only those that accomplish a minimum angle to filter crosses that aren't made with enough strength You can generate alerts when Oversold

True Choppiness Direction determines if the market is choppy (trading sideways) or if it is trending, as well as the trend direction and strength (green=up, red=down, grey=no trend) . The underlying algorithm is designed to detect trend movements even in the presence of noisy market data, please see screenshots. Trend strength is indicated by taller or shorter red/green fill. Choppiness index is range-bound between -50 (very trendy) and +50 (very choppy). This is a custom algorithm designed by u

Same behavior of https://www.mql5.com/en/market/product/25552 but fixed lot 0.01 The EA waits for a spike according to a specific logic and opens a position in spike direction setting stop loss and take profit. When positions are in profit they are managed with smart trailing mechanism based also on elapsed time from opened position. It works with 5-digit and 4-digit broker. Must be used on the M1 chart. Does not need historical data. It does not use Martingale Grid Hedge
Parameters spikeFilt
FREE

This utility is designed for level trading.
Parameters buy level, sell level - type of the placed order. open price level - price level of the order. open Lot - order volume. Magic - magic number of the order. TakeProfit - take profit of the order in pips, (0.00001) for 4- and 5-digit quotes, (0.001) for 3- and 2-digit quotes. StopLoss - stop loss of the order in pips, (0.00001) for 4- and 5-digit quotes, (0.001) for 3- and 2-digit quotes. repeat open orders as a Limit Order: on, off - enable

Ichimotor EA is a multicurrency, trend based Expert Advisor which works with the intersection of two indicators - Ichimoku cloud and Alligator with customized settings. Input parameters Entry Method Wait for trend : the EA will wait until the trend matches the arrow based on the 2 senkouspan values. Immediate : the EA will take a trade once the arrow appears. SL/TP Method Static: Stop loss and Take Profit from the Values “SL in Points” and “TP in Points”. SenkouSpanA StopLoss is calculated equal
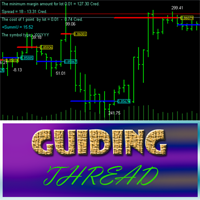
Guiding Thread is based on the standard RSI with a customizable period. The market entry signal is triggered after the indicator crosses a certain level. The event is marked by an appropriate line (blue - going long, red - going short) and the price label having the appropriate color . In other words, if the previous signal was for going short (red line and price label), the next one indicates the upcoming reversal and the necessity to go long (blue line and price label). A trading signal is pre
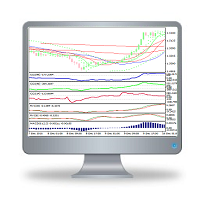
The Ssgy EA generates the main signal based on 10 indicators. The trading strategy has been tested manually and has shown excellent results on a real account, after which it was decided to automate the whole process and entrust the work to a robot. The robot trades only in the direction of the trend, trying to determine its beginning and end. If the trend reverses, the open orders are managed by a double safety grid, allowing you to exit the received drawdown. The recommended minimum deposit is

Hamster Scalping은 스캘핑과 마틴게일 애호가를 위해 두 가지 모드를 사용하는 완전히 자동화된 거래 고문입니다. RSI 표시기와 ATR 필터는 입력으로 사용됩니다.
실제 작업 및 기타 개발 모니터링은 여기에서 찾을 수 있습니다. https://www.mql5.com/en/users/mechanic/seller
일반 권장 사항
좋은 실행과 2-5핍의 확산을 가진 브로커는 매우 빠른 VPS 서버가 필요하며 바람직하게는 핑이 3 이하입니다.
여기에서 최적화된 설정
입력 매개변수
EA는 4자리 및 5자리 따옴표 모두에서 작동합니다. 입력 매개변수에서 5자에 대해 포인트로 값을 표시하면 자동으로 모든 것을 4자로 다시 계산합니다.
선택 전략 - 그리드 알고리즘을 사용자의 선택에 추가할 수 있습니다. 새 주기 - 켜기/끄기. New Cycle이 꺼져 있으면 EA는 시리즈를 닫은 후 새 주기를 열지 않습니다. 거래 매수 - 고문은 매수만 거래할 수 있습니

현재 20% 할인 !
초보자 또는 전문가 트레이더를 위한 최고의 솔루션!
이 대시보드 소프트웨어는 28개의 통화 쌍에서 작동합니다. 2가지 주요 지표(Advanced Currency Strength 28 및 Advanced Currency Impulse)를 기반으로 합니다. 전체 Forex 시장에 대한 훌륭한 개요를 제공합니다. 고급 통화 강도 값, 통화 이동 속도 및 모든(9) 시간대의 28 Forex 쌍에 대한 신호를 보여줍니다. 추세 및/또는 스캘핑 기회를 정확히 파악하기 위해 차트의 단일 지표를 사용하여 전체 시장을 볼 수 있을 때 거래가 어떻게 개선될지 상상해 보십시오!
잠재적인 거래를 식별하고 확인하면서 강력한 통화와 약한 통화를 더욱 쉽게 식별할 수 있도록 이 지표에 기능을 내장했습니다. 이 표시기는 통화의 강세 또는 약세가 증가 또는 감소하는지 여부와 모든 시간대에서 수행되는 방식을 그래픽으로 보여줍니다.
추가된 새로운 기능은 현재 시장 조건 변화에 적

Shark Surfer is a new generation Expert Advisor applying a well-established trend-following trading. The trade period recommended by the developer is H1. The product is good both for scalping, as well as medium- and long-term trading. Shark Surfer always sets take profit and stop loss to its deals. It provides the option to force close all open trades at the specified time before the market closes, which helps avoid unnecessary gaps on Monday. Shark Surfer trades on all symbols and timeframes. I

This is a unique multi-currency trading strategy developed for trading on H1 timeframe, which allows you to determine the global market entry points and obtain the maximum profit for each transaction. The market entry point is calculated using a variety of author equations and algorithms. We recommend using the indicator simultaneously on several trading instruments . A huge advantage of Big Deals System is an information panel in which the user can see the current information on potential entry
ISO Trend Line Pending Expert is a unique professional tool which can turn any selected Trend Line, Support Line and Resistance Line on your chart into a pending order line or Alert line with different trigger methods. With various order types including Price Touch , Price Break Out and Candle Close Break Out . The Order History feature will let you to have a quick access to all other charts which an order has been executed. It’s truly designed to help traders easily trade and manage many charts
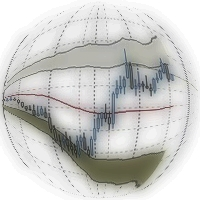
Double Bollinger Bands is a method of following a trend. Two deviation at the time with fill color between them, ideal for traders who like visual style of trading.
Parameters Length - сenter averaging period line length. Deviation 1 - number of standard deviations from the main line 1. Deviation 2 - number of standard deviations from the main line 2. Color - optional.

The Pivot Point indicator automatically calculates and displays the pivot point line and support and resistance levels. Pivot can be calculated according to the Classic, Floor, Fibonacci, Woodie, Camarilla or DeMark formula. It is also possible to select the period for calculating the indicator. A trader can choose from daily, weekly, monthly, or user-defined periods.
Types of pivots Classic Floor Fibonacci Woodie Camarilla DeMark
Main features The indicator shows the current and histor
FREE
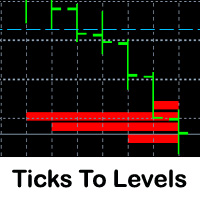
This indicator counts ticks and graphically displays the price levels, on which the greatest number of them was detected. Thus, it sufficiently accurately determines the levels of support and resistance. The indicator will be useful for traders who trade breakout or scalping strategies.
Features Technical analysis provides several ways for finding levels of support and resistance. Ticks to Levels provides another, fairly accurate, way of determining these levels empirically. The criterion for

This EA is based on the classical trend-following system of opening the positions. The EA is based on DYJ TwoMACrossAlarm and ATR and CCI indicator. It uses two moving averages. The EA uses dynamic allocation MA period. The MA1 and MA2 period is the Fibonacci sequence, such as 5.8 or 13.21 or 21.34 or...; EA Entry Rules: Go long when fast MA1 crosses above the slow MA2 and CCI crosses above the zero line; Go short when fast MA1 crosses below the slow MA2 and CCI crosses below the zero line; the

The Fibonacci indicator automatically displays the Fibonacci retracement levels, representing significant support and resistance. The range for calculating the indicator can be taken from the previous day, week, month, year or user-specified session.
Levels 100 % (High) of the range from the previous session. 0 % (Low) of the range from the previous session. 76,4 % of the range from the previous session. 61,8 % of the range from the previous session. 50 % of the range from the previo
FREE

This is an arrow indicator for binary options. It does not redraw, arrows do not disappear. The indicator implements an optional tester for visual monitoring of the number of signal and win rate. Does not require adjustment or fitting. Works on all pairs and gold. The signal appears at the close of a candle. Entry is made on the next bar. Optional alert. For trading with robots, there is a setting for the number of bars in history. If 0, the entire history is used. The EA operation time: 24/5 Wo

The Custom Market Watch ( CMW ) is a professional grade trading application which allows you to operate effortlessly with large number of symbols and multiple open positions simultaneously from one chart. The Custom Market Watch shows the most essential daily technical information for each symbol in combination with very simple and easy to use trading interface where you can monitor the net exposure for each symbol and you can open and close positions with one click. The app is automatically syn
Call/Put Ratio is one of the most well-known indicators of the market sentiment. The indicator has been developed by Martin Zweig. It is based on real volumes of the CBOE option market. As we know, a Call option gives its owner the right to buy the underlying asset at a predetermined price. A Put option gives the right to sell it. Thus, increasing volumes for Call options indicate the increasing demand. The growth of Put option volumes shows that supply starts exceeding demand. If we divide the
Underlying assets with expiration date can change automatically to next date in the chart. Some brokers offer underlying assets with expiration date. For example to March, June, September, or December. This tool switches automatically to the next date. Expert Advisors, indicators, charts, or templates receive automatically the new contract. Automatically supported formats: NameMMMYY (Jp225Mar17) or NameMMYY (SugarMr17). Use as an indicator. Path \MQL4\Indicators.
Example From UsaIndJun17 , Usa

Algo Candle is a very good indicator that permits to see, through the candle color, the strength of the algorithmic study chosen. In input you can choose your favorite algorithmic calculations such as: RSI, Vortex, MACD, Momentum, Stochastic and ATR. The candles are colored based on the levels of the chosen indicator. This indicator eliminates too many oscillators or indicators on your charts and gives you very useful information. Algo Candle is an excellent operating ally, allowing you to get m

MetaTrader 5 version available here: https://www.mql5.com/en/market/product/25794 FFx Pivot SR Suite PRO is a complete suite for support and resistance levels. Support and Resistance are the most used levels in all kinds of trading. Can be used to find reversal trend, to set targets and stop, etc.
The indicator is fully flexible directly from the chart 4 periods to choose for the calculation: 4Hours, Daily, Weekly and Monthly 4 formulas to choose for the calculation: Classic, Camarilla, Fibona

The indicator trades during horizontal channel breakthroughs. It searches for prices exceeding extreme points or bouncing back, monitors night flat and defines targets using customizable Fibo levels with a sound alert, which can be disabled if necessary. The indicator allows you to create a horizontal channel between the necessary extreme points in visual mode quickly and easily. It automatically applies your selected Fibo levels to these extreme points (if the appropriate option is enabled in t

YOU CAN NOW DOWNLOAD FREE VERSIONS OF OUR PAID INDICATORS . IT'S OUR WAY OF GIVING BACK TO THE COMMUNITY ! >>> GO HERE TO DOWNLOAD
Camarilla Pivots Historical plots the historical data of the camarilla pivot point levels on the chart. The Camarilla Pivot levels was originated in 1989 by Nick Scott. The levels are used as primary support and resistance levels by Intraday traders. The levels are calculated with the following formula: R4 = C + RANGE * 1.1/2 R3 = C + RANGE * 1.1/4 R2 = C + RAN
FREE

iMACD in iMA is indicator to change color in iMA if iMACD is upper of zero (up trend) or lower of zero (down trend). It is a useful tool to track when the upside and the downside iMACD on iMA.
You can to get source code from here .
Parameters MA_Periods — Period for iMA. MA_Method — Method for iMA. MACD_FastEMA — Fast EMA for MACD. MACD_SlowEMA — Slow EMA for MACD. MACD_SignalSMA — SMA signal for MACD. MACD_ApliedPrice — Price used for MACD. BarsCount — How many bars will show the line. Reve
FREE

MArket Wave EA is an Expert Adviser which is trend based and trades using multiple moving averages and Bollinger Band . Signals are generated when there is intersection between multiple moving averages and Bollinger Bands.
Input Parameters Distance from the Highest Sell Allowed - If a sell signal comes, price must be above the highest open sell order, plus this distance in points (even higher) Distance from the Lowest Buy Allowed – If a buy signal comes, price must be below the lowest open buy

This indicator is designed for determining the trend direction and price reversal points. This indicator is a heavily modified version of Parabolic SAR. Does not repaint/redraw Calculation on an current candle If the price is above the indicator, trend is ascending. If the price is below the indicator, trend is descending. Trade: If the color and the trend direction changed, open a position and close it by take profit, or hold it until the next trend change. It is also possible to trade rebounds

One of the biggest problems you will face as trader is finding the right system for myself. AMD Exclusive Two can constitute a complete system for you. Don’t follow the arrows, without thinking twice. Trading using a whole system. What we have? Automatic optimization Overbalance (manual, semi-automatic and automatic) Main and additional signals Fibonacci Pivot Linear Regression Channel Mini Tester Early warning system (yellow cloud on the chart) 3D effect
Button On Chart Button [Start] - Star

Moving Band EA is an Expert Adviser which is trend based and trades using the intersection of Moving Averages and Bollinger Bands.
Input Parameters Distance from Highest Sell Allowed : If a Sell signal appears, price must be above the highest open sell order, plus this distance in points (even higher) Distance from the Lowest Buy Allowed : If a Buy Signal appears, price must be below the lowest open buy order, minus this distance in points (even lower) Total Open Sells Allowed : Maximum number

The EA waits for a spike according to a specific logic and opens a position in spike direction setting stop loss and take profit. When positions are in profit they are managed with smart trailing mechanism based also on elapsed time from opened position. It works with 5-digit and 4-digit broker. Must be used on M1 chart. Does not need historical data. It does not use : Martingale. Grid. Hedge.
Parameters spikeFilter - value to decide opening positions takeProfit - take profit in points stopLos

This indicator shows the trend based on two configurable moving averages. A custom calculation shows market volatility in the lower frame. Higher bars mean higher volatility. The chart also shows suggestions for buy, sell or close with the help of arrows. It is possible to set minimum volatility for entry points and to set time filtered alerts. This indicator is useful to judge trends or market volatility, for example to catch good periods for scalping.
Parameters Volatility Period - volatilit

The indicator shows the exact price position in the current market on any symbol. It shows the trend direction on the current chart as well as on the two subsequent higher timeframes at the same time (from top to bottom). For example, you can observe the trend direction on M5 and M15 without leaving the M1 chart. The indicator switches all trend depending on the market conditions preventing you from entering against a trend or allowing you to exit a position in a timely manner. The indicator is

Eliminator EA is a professional and fully automated scalper. Easy to use, proved strategy many years and just focused on GBPCAD. This EA uses some calculated price and time actions with 6 indicators' confirmations. No need for unnecessary EA parameters. The EA sets everything automatically.
Advantages NO Grid, NO Martingale, NO Averaging and high risk strategies. The EA always uses Stop Loss and Trailing. No needs to enter stop loss or take profit manually. Dropdown style Money Management can

Scalper Zoom is a new trading system designed to facilitate the process of Forex trading both for beginners and professionals. The Scalper Zoom indicator uses an adaptive method of operation and analyzes the market using multiple trading algorithms, while selecting the most efficient one for the given currency pair and timeframe. Working with this indicator is very simple. When a red vertical line appears, open a sell order. Close it when a blue vertical line appears. Follow the opposite steps f

The BinaryLuck indicator is a powerful indicator for trading binary options with any expiration times. This indicator will be especially useful for trading short-term binary options with an expiration time of 30-60 seconds. This is a complete ready, self-contained trading system. The indicator predicts the maximum High and minimum Low for the current candle. Then it calculates the path the price has passed on the current candle as a percentage of the predicted High/Low range ( Range of candles )

This indicator combines double bottom and double top reversal chart patterns together with detection of divergences between the price chart and the MACD oscillator.
Features Easily detect strong reversal signals Allows to use double top/bottom and MACD divergence signals combined or independently Get email and/or push notification alerts when a signal is detected Custom colors can be used The indicator is not repainting Can easily be used in an EA (see below)
Inputs ENABLE Double Top - Botto

This indicator combines double bottom and double top reversal chart patterns together with detection of divergences between the price chart and the Momentum oscillator.
Features Easily detect strong reversal signals Allows to use double top/bottom and Momentum divergence signals combined or independently Get email and/or push notification alerts when a signal is detected Custom colors can be used The indicator is not repainting Can easily be used in an EA (see below)
Inputs ENABLE Double Top
NDS grid is a very simple and safe grid Expert Advisor, a scalper that additionally benefits on rebate accounts. During its operation, the EA uses multiple scalping strategies and places an order grid. The EA can detect 4 and 5-digit quotes automatically. It mainly uses hidden stop orders. It tries to adapt to the market and not to hold unprofitable positions for long.
Requirements MetaTrader 4 platform 4 or 5-digit quotes Currency pair - GBPUSD (H1) Leverage - 1:100 or 1:200
Recommendations

This utility device opens an opposite position a specified distance away from an original order (opened by another EA or just by manual trading) which it automatically detects. It can be used to gain back losses on false breakouts for example. Positions opened by the device can have a fixed SL and TP or/and can be protected by a trailing stop . In addition, it has a partial close function and a separate function to set a TP for secondary targets . It also uses a Magic number system , so it can b
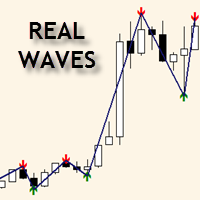
The indicator shows the real waves, based on alternating upper and lower extremums of the price chart, thus displaying the wave structure of the market. When using this indicator, there is no need to manually apply the wave markup for the current timeframe. Relevance of the extremums is determined in the process of their calculation, invalid extremums are not taken into account. Upper extremums are calculated by the bars highs, while lower ones are calculated by the bars lows. Only one bar is co
MetaTrader 마켓은 개발자들이 거래 애플리케이션을 판매할 수 있는 간단하고 편리한 사이트이다.
제품을 게시하고 마켓용 제품 설명을 어떻게 준비하는가를 설명하는 데 도움이 됩니다. 마켓의 모든 애플리케이션은 암호화로 보호되며 구매자의 컴퓨터에서만 실행할 수 있습니다. 불법 복제는 불가능합니다.
트레이딩 기회를 놓치고 있어요:
- 무료 트레이딩 앱
- 복사용 8,000 이상의 시그널
- 금융 시장 개척을 위한 경제 뉴스
등록
로그인
계정이 없으시면, 가입하십시오
MQL5.com 웹사이트에 로그인을 하기 위해 쿠키를 허용하십시오.
브라우저에서 필요한 설정을 활성화하시지 않으면, 로그인할 수 없습니다.