适用于MetaTrader 4的技术指标 - 13
FVG 区域指标是一种强大的工具 ,旨在识别市场中的公允价值缺口 (FVG),突出公允价值和市场价格之间的价格不平衡。这种对缺口的精确识别使交易者能够发现潜在的市场进入点和退出点,从而大大增强他们做出明智交易决策的能力。
FVG 区域指标具有直观且用户友好的界面,可自动扫描图表中的公允价值缺口,并在价格图表上实时标记这些区域。这使交易者能够快速轻松地识别可能预示即将到来的价格调整或趋势延续的潜在价格不平衡。
主要功能包括: 实时缺口检测 :自动识别并标记出现的 FVG。 以点为单位显示缺口大小 :该指标以点为单位显示每个已识别缺口的大小,帮助交易者了解缺口的重要性。 与当前价格的点差 :即时计算并显示当前价格与已识别的公允价值缺口之间的点差。 清晰的可视化: 视觉上不同的 FVG 区域采用颜色编码以便快速参考,帮助交易者专注于关键市场领域。
无论您是经验丰富的交易者还是技术分析新手,FVG 区域指标都能提供对市场价格不平衡的重要见解,帮助您准确而自信地完善交易策略。
参数 缺口参数 缺口填补检测百分比 - 设置将缺口视为已填补的百分比 以点为单位显示缺口 - 启用或禁用以点为

Advanced Reversal Hunter Pro (ARH) is a powerful, innovative volatility-based momentum indicator designed to accurately identify key trend reversals. Developed using a special algorithm that provides a clear construction of the average volatility range, without redrawing its values and does not change them. The indicator adapts to any market volatility and dynamically adjusts the width of the band range, depending on current market conditions. Indicator advantages: Advanced Reversal Hunter Pro
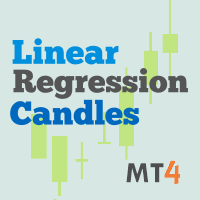
This indicator is the mql version of the Linear Regression Candles indicator. There are many linear regression indicators out there, most of them draw lines or channels, but this one actually draws a chart.This script includes features such as linear regression for open, high, low, and close prices, signal smoothing with simple or exponential moving averages. I welcome your suggestion for improving the indicator.
To increase the loading speed of any indicator:
Reduce the max bars in c
FREE

Current indicator shows the trading sessions for the major financial centres: London New York Tokyo Sydney There are available two types of displaying zones: in sub window below the chart and on the chart. When the subwindow is selected, the sessions are shown in the form of bars. If the sessions are shown on the main chart, they are displayed in the form of lines at the open price of the session that may also act as a support and resistance for further price action during the trading day. The
FREE
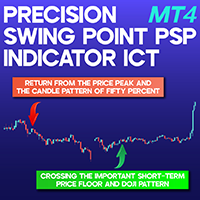
Precision Swing Point Indicator PSP ICT Quarterly Theory MT4 The Precision Swing Point Indicator PSP ICT Quarterly Theory MT4 integrates three key market indices—Dow Jones Index, Nasdaq 100 Index, and S&P 500—alongside three well-established candlestick formations: Doji, 50% body candles, and Shooting Star. This tool is designed to help traders pinpoint both trend continuations and reversals with greater accuracy. Precision Swing Point Indicator Specifications Table Category Pivot Point and Fr
FREE
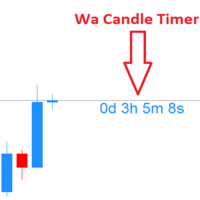
Wa Candle Timer MT4 Wa Candle Timer MT4 是一款强大且易于使用的指标,专为在MT5图表上显示下一根K线形成前的剩余时间而设计。此工具帮助交易者掌握K线关闭时间,从而优化交易执行和决策。 主要功能: 显示当前K线的倒计时。
当K线剩余时间少于5%时自动变色。
支持字体和颜色的完全自定义设置。
提高时间管理能力,使交易更精准。 可自定义设置: 1️⃣ K线倒计时颜色(>5% 剩余时间) – 设置当剩余时间超过5%时的颜色。
2️⃣ K线倒计时颜色(<5% 剩余时间) – 设置当剩余时间少于5%时的颜色。
3️⃣ 字体大小 – 调整倒计时文本的大小,提高可见度。
4️⃣ 字体样式 – 选择您喜欢的字体(例如:"Arial")。 对于依赖精准K线时间的交易者来说,该指标是一个必不可少的工具。使用 Wa Candle Timer MT4 让自己始终领先市场!
FREE

DONCHIAN CHANNEL DC It is a trend indicator developed by “Richard Donchian”, consisting of 3 layers, the upper channel, the lower channel and the middle channel. It is created on the Donchian Channel by plotting the highest and lowest prices reached in the past period on the price chart. It is also used to measure the volatility of the market, as it is an expanding/contracting channel according to the increase/decrease of price volatility. Method 0; Donchian channel indicator drawing. BUY/SELL S
FREE

Wave Reversal Indicator - determines the direction of trend waves and price reversals.
The indicator shows wave movements and trend directions. It gives recommendations where to follow the trader, helps to follow the trading strategy.
It is an addition to an intraday or medium-term strategy.
Almost all parameters are selected for each time frame and are changed automatically, the only parameter for manual adjustment is the wavelength.
Works on various trading instruments and timeframes, recomme
FREE

指示器显示图表上的任何文本和任何图像,也可以输出宏请求的信息。 有三个文本块和一个图像块。 字体选择,大小,颜色,边距和定位可用。 如果你想标记你的屏幕截图或在图形上显示必要的信息,那么 UPD1 Watermark 将是一个非常有用的工具。
设置的说明。
文本设置(3块)。 Text 1, 2, 3 – 输入文本和或宏。 Font Name – 输入字体名称。 如果出现错误,将使用默认字体。 Font Size – 指定字体大小。 Font Color – 指定字体颜色。 Corner – 对象锚角的选择。 Visual Position – 对象在图形前面或后面的位置。 X – 以像素为单位的水平缩进。 Y – 以像素为单位的垂直缩进。
图像设置(1块)。 Image – 选择图像。 Manual - 使用此设置,请在下面输入图像的名称。 Watermark. Money Mandala. Manual Image Name ***.png in Files – 指定PNG文件的名称。 PNG文件应位于 Terminal\MQL4\Files\ Corner – 对象锚
FREE

The Trade by levels indicator is designed to automatically determine the formation of a model for entering the market on the chart of the selected instrument.
Definitions: ⦁ BFl is the bar that formed the level. ⦁ BCL1 and BCL2 bars, confirming the level.
The graphical model: ⦁ levels high\low the bars BFL and BCL1 must match the accuracy to the point ⦁ there can be any number of bars between BFL and BCL1. ⦁ between BCL1 and BCL2 intermediate bars
FREE

Moving Average Trend Alert is a triple MA indicator that helps traders to identify potential market trends based on 3 MAs alignment and crossover.
Moving Average Trend Alert features: Customizable short-term, medium-term, and long-term MAs. Option to filter signals based on a minimum distance between moving averages to avoid premature MAs alignment. Optional Filter of signals with RSI indicator overbought/oversold levels. Optional Filter of signals with ADX indicator. Popup, email, and phone no
FREE

该指标可识别30多种日本烛台图案,并在图表上突出显示它们。这只是价格行为交易者不能没有的那些指标之一。 一夜之间增强您的技术分析 轻松检测日本烛台图案 交易可靠且通用的反转模式 使用延续模式安全跳入已建立的趋势 指示器不重涂并实施警报 该指标实现了一个多时间框架 仪表板 它检测到的模式太多,以至于图表看起来非常混乱,难以阅读。交易者可能需要禁用指标输入中的不良图案,以使图表更具可读性。 它检测1条,2条,3条和多条样式 它检测逆转,持续和弱点模式 模式可以启用或禁用 看涨模式用 蓝色 标记,空头模式用 红色 标记,中性模式用 灰色 标记。
检测到的烛台模式列表 从1到5小节的突破距离(又名线罢工) 法基(又名Hikkake) 反间隙 三名士兵/三只乌鸦 锤子/流星/吊人 吞没 外上/外下 Harami 由上至下 晨星/晚星 踢球者 刺穿/乌云 皮带托 从1到5小条上升三分/下降三分 田木峡 并排间隙 视窗 前进块/下降块 审议 Marubozu 挤压警报(又称主蜡烛) Dojis
设置 PaintBars
使用条形的颜色打开/关闭图案的突出显示。 DisplayLabels

Modified oscillator MACD. A classic indicator that combines a trend indicator with an oscillator to detect entry points. Has a multi-timeframe panel and 3 types of notifications
Benefits:
Works on all instruments and timeseries Trend indicator with oscillator for inputs Multi-period panel on all timeframes Pluggable arrows when signals appear Three types of notifications: push, email, alert
MT5 version -> HERE / Our news -> HERE
How the indicator works:
AW Classic MACD - Indicator of
FREE

Wolfe Waves scanner - It scans all the Symbols and identify the movement of price and it gives confidence in trade. It automatically plots fifth wave breaks out of the channel. According to the theory behind the pattern, a line drawn from the point at the beginning of the first wave and passing through the beginning of the fourth wave predicts a target price for the end of the fifth wave. If a trader properly identifies a Wolfe Wave as it forms, the beginning of the fifth wave represents an op

Order Block Void Indicator MT4 Order Blocks represent critical price zones where institutional traders place significant buy and sell orders. These areas often serve as key support and resistance levels on price charts. The Order Block + Void indicator for MetaTrader 4 autonomously marks these order blocks on the chart. One of its notable features is displaying the percentage of the order block that has been utilized, turning the consumed section gray. This tool highlights bullish order blocks w
FREE
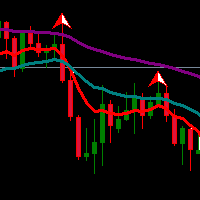
Exponential Moving Average (EMA) is an indicator that often be used by traders. Combination of two or three EMA indicators often applied to determine trend direction. Multiple EMA combined with fractals or oscillator indicator to detect overbought/oversold and divergence point also great to do in trading system.
If you like EMA indicator and want to get better indicator, highly recommended using EMA SuperTrend Strategy Indicator if you want to get better result in here:
https://www.mql5.com/en
FREE

Emergency trend technical indicator is used to analyze price movements in the Forex market. It is included in the so-called arrow indicators. And it is very practical in that it forms arrows in places where buy signals appear, or, conversely, sell signals.
Naturally, do not forget that any indicator is just an assistant, not a magical tool, by the will of which you will become fabulously rich.
Unfortunately, many novice traders forget about this, they see a potential grail in each indicator,

We present you an indicator that not only improves the visual aspect of the chart, but also gives it a lively, dynamic character. Our indicator is a combination of one or more Moving Average (MA) indicators, which constantly change their color, creating an interesting and colorful look.
This product is a graphical solution, so it is difficult to describe what it does in text, it is easier to see by downloading it, besides the product is free. This indicator is suitable for bloggers who want to
FREE

Indicator Seff designed for both beginners and professionals. This indicator generates possible entry points to open BUY and SELL trades and will help you: reduce the number of errors when opennig orders; predict price movement(in absent of significant news); do not rush to close profitable trades prematurely and increase profit; do not rush to enter the market and wait for "easy prey": and increase the profitability of trading. Does not redraw and works by opening bar.
Settings
ALARM- enabl

Trend Arrow Super The indicator not repaint or change its data. A professional, yet very easy to use Forex system. The indicator gives accurate BUY\SELL signals. Trend Arrow Super is very easy to use, you just need to attach it to the chart and follow simple trading recommendations.
Buy signal: Arrow + Histogram in green color, enter immediately on the market to buy. Sell signal: Arrow + Histogram of red color, enter immediately on the market to sell.
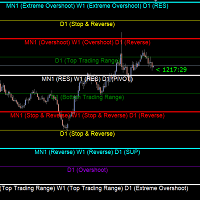
Gold Levels MTF - this is a fine stock technical indicator. The indicator algorithm analyzes the movement of the asset price, displays price levels of support and resistance from all time frames (TF) using the Murray method based on the Gann theory. The indicator indicates overbought and oversold fields, giving an idea of possible reversal points and at the same time giving some idea of the strength of the current trend. Description of levels: (Extreme Overshoot) - these levels are the ultimat
FREE

Simple Fair Value Gap MT4
Unlock the power of fair value gaps with this simple and precise, easy to use indicator designed to identify and visualize market inefficiencies. Simple Fair Value Gap is an mt4 indicator which paints the center of a fair value gap candle with a different color. A Fair Value Gap (FVG) is a three candle formation in which the middle candle does not get completely overlapped by the left and right candle. i.e The difference between the high and low of either left or right
FREE

VWAP and Moving Average A combination of Supertrend and Moving Average to create a converging trade setup Input parameters: signal mode: set it to true if you want to plug it into STAT (Signal Tester and Trader) arrow shift: distance between fast EMA line to arrow on chart turn on moving average signal for converging setup VWAP period MA period MA averaging method MA pricing method upper level limit ( VWAP ) lower level limit ( VWAP ) You can find the best setting for 4 hour EURUSD on this v
FREE

This indicator is an original view on volumes. It is known that volumes show the amount of buyers and sellers for a certain period of time. A candle is used a period of time. Volumes at a candle High show the buyers. Volumes at a candle Low show the sellers. A candle Open shows the Delta. Delta indicates who was dominant on a given candle, buyers or sellers.
Input parameters Distance - distance of the volumes text from High and Low. Font size - text font size. The indicator provides levels that
FREE
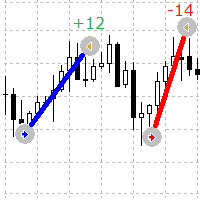
一个简单而有用的指标,可以在图表上直观地查看订单的进入点和退出点
该指标在交易品种上显示当前未结订单和已完成订单
指标参数
Lines Buy color - 指定买单的线条颜色 Lines Sell color - 指定卖单的线条颜色 Lines Width - 设置线宽,适用于实体样式类型 Lines style - 设置线条的样式 Lines positive profit color - 设置正利润文本的颜色 Lines negative profit color - 设置负利润文本的颜色 Lines profit value font type - 设置利润文本的字体类型,您可以设置您计算机上安装的任何一种 Lines profit font size - 设置利润文本的字体大小 Lines profit value angle - 设置利润文本的角度,默认为 0,垂直可以设置 90 Show profit in pips rather on deposit currency - 如果设置为真,指标将以点数显示利润,如果为假,它将以存款货币显示
FREE

Scalping indicator. It takes into account volatility, price movement in the local interval and the direction of the current trend. Recommended timeframe - M5. Advantages: Low volatility when a signal appears ensures minimal movement against an open position. The indicator does not redraw its signals. There are alert signals. It is a great tool for day trading.
Settings: Name Description Period Indicator period Range of each bar in the period (pp.) The maximum size of each candle in the indicato
FREE

Update: For those who want to manually backtest this indicator, check this tool https://www.mql5.com/en/market/product/59248
The indicator will help make your calculation of stop loss easier as it will be visually aiding you in choosing where to put your stoploss level on the chart by calculating the current value of ATR indicator. For those who are unfamiliar with ATR, it is a useful indicator to calculate stoploss for trend following strategy. If volatility is high, ATR stoploss level will be
FREE

该指标分析分形的价格结构并确定市场动态的可能反转点。与其他类型的指标结合使用时非常完美。
好处:
适用于所有仪器和时间序列, 不重绘结果, 指示器元素的可定制颜色, 适用于任何趋势策略, 调整分形的强度。
MT5 version -> HERE / Our news -> HERE
Strategy:
AW Flexible Fractals is an indicator that indicates signals not instantly, but with a delay, due to the structure of the fractal.
To detect a signal in the " Number of candles on each side of the fractal " variable, you can adjust the number of bars on each side from the central point of the fractal. In the default settings, the
FREE

This indicator identifies swing highs and swing lows in the price chart by comparing the Highs and lows of each candle to a specified number of candle before and after it. Once it has identified the swing highs and swing lows, it can use them to determine potential support and resistance levels. A support level is formed when the price drops and bounces back up from a swing low, indicating that there is buying pressure at that level. A resistance level is formed when the price rises and reve
FREE
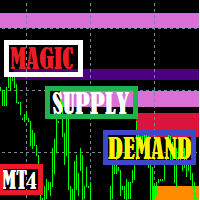
Magic Supply Demand Indicator works on all products and timeframes. It is a new formula, and the very new features are two zone strength functions adjustable by user input! This is a great advantage in trading. When you learn how to use the proprietary features such as the zone strength with min X-factor of price travel away, you will be able to tell whether the zone is strong or not.
The supply and demand zones are used as an alert trigger. You can use popup alert with sound on MetaTra
FREE

该指标测量所选时段内牛市和熊市之间的不平衡,并在两点之间显示一条直线。
如果牛市的成交量大于熊市,则该线变为绿色。 如果熊市成交量更大,则为红色。 直线还显示成交量的百分比差异。
该指标在单独的窗口中显示相同的数据。您还可以看到分割后的成交量。
该指标有两种模式。
为此,左上方有一个按钮、
- 如果不按下,它将测量市场任意点与当前价格之间的不平衡。 - 如果按下按钮,则可以测量市场任意两点之间的平衡。
该指标测量所选时段内牛市和熊市之间的不平衡,并在两点之间显示一条直线。
如果牛市的成交量大于熊市,则该线变为绿色。 如果熊市成交量更大,则为红色。 直线还显示成交量的百分比差异。
该指标在单独的窗口中显示相同的数据。您还可以看到分割后的成交量。
该指标有两种模式。
为此,左上方有一个按钮、
- 如果不按下,它将测量市场任意点与当前价格之间的不平衡。 - 如果按下按钮,则可以测量市场任意两点之间的平衡。
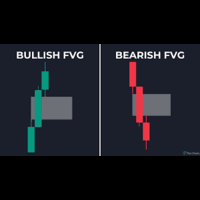
It identifies fair value gaps which are currently valid. Settings: Bullish FVG Color: To set the color of bearish FVGs. Bearish FVG Color: To set the color of bearish FVGs. Minimum Size: For filtering the signals. The restricts a minimum size for the FVG to be considered valid. For custom additions you can reach out to developer here MT5 Version available here
FREE

MA Crossover Arrows is a simple indicator that draws arrows and alerts when two moving averages crossover.
Supported types of moving averages Simple Exponential Smoothed Linear Weighted
Supported Price types Close Open High Low Median Price (HL/2) Typical (HLC/3) Weighted Close (HLCC/4) When the fast moving average crosses above the slow moving average, a green up arrow will appear on the chart. When the fast moving average crosses below the slow moving average, a red down arrow will appear on
FREE

This indicator lets you easily mark the daily open levels on a chart with several possibilities of customization. For many trading strategies, the daily open level is an important level to base trading decisions on. That is why I chose to create this indicator that is designed to assist you with trading these strategies, as well as further optimizing them and getting a general understanding of the markets movements. With this tools help, you can easily take a look at the previous price action ar
FREE

The " YK Find Support And Resistance " indicator is a technical analysis tool used to identify key support and resistance levels on a price chart. Its features and functions are as follows:
1. Displays support and resistance levels using arrow lines and colored bands, with resistance in red and support in green.
2. Can be adjusted to calculate and display results from a specified timeframe using the forced_tf variable. If set to 0, it will use the current timeframe of the chart.
3. Uses the
FREE
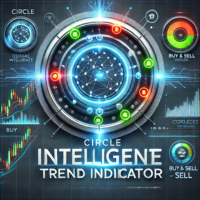
The Circle Intelligent Trend Indicator is a cutting-edge tool designed for MetaTrader 4 users who demand efficiency. This indicator brings the seamless TradingView experience directly to MT4, eliminating the need for templates and simplifying your trading setup.
Its standout feature is the Circle buy and sell signals, which are optimized for multi-timeframe analysis, allowing traders to make informed decisions with confidence. Whether you’re scalping, day trading or swing trading, the Circle I
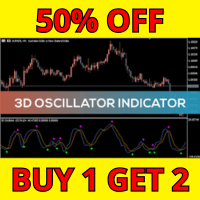
3D 振荡器的七大优势 三维市场视角 “3D 振荡器”这一名称并非巧合。它将三种知名指标(RSI、随机指标和CCI)集成到一个面板中。这种组合提供了市场的三维视角,帮助您发现隐藏趋势并避免陷阱。 可定制设置 通过可调整的参数(如 D1RSIPer、D2StochPer 和 D3tunnelPer),该指标可适应任何交易风格,无论您是激进的短线交易者还是耐心的波段交易者。 信号精确 得益于平滑机制(sigsmooth)和调整因子(hot),3D 振荡器可以滤除市场噪音,提供更可靠的信号,并减少虚假信号。 多时间框架适配 无论是 1 分钟图表还是周线图表,指标都能完美适配不同的时间框架,为各类交易者提供精准洞察。 易于解读 其两条信号线(sig1n 和 sig2n)组成了双重确认系统。当两线交叉时,即表示高概率的买入或卖出机会。 多功能性 适用于所有市场:外汇、股票、加密货币、大宗商品和指数。其计算能力在任何金融资产中都表现出色。 稳定表现 该公式结合了动量原理(RSI)、超买超卖区间(随机指标)和价格趋势分析(CCI)。这使得系统能够检测反转、确认趋势并降低风险。 使用 3D 振荡器交

This indicator is based on Guppy's GMMA Strategy. And shows arrows when GMMA lines cross up or down. To have this indicator and get alerts for Multiple Timeframes and multiple Pairs you can check out the demo of this GMMA Trend Scanner indicator: https://www.mql5.com/en/market/product/38747
About GMMA In Brief:
GMMA attempts to identify trends by combining two groups of moving averages with differing time periods: The long-term EMAs (30, 35, 40, 45, 50, and 60) the behaviors of investors that h
FREE
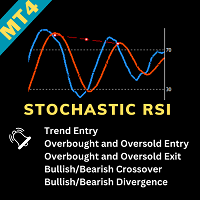
Stochastic RSI Indicator - Master the Art of Timing Elevate your trading game with the "Stochastic RSI Indicator." This powerful tool marries the Stochastic oscillator with the Relative Strength Index (RSI), offering precise insights into market dynamics. It's your key to mastering the art of timing in trading. About the Indicator : The Stochastic RSI Indicator combines two robust indicators - Stochastic and RSI - to provide traders with an exceptional tool for identifying entry and exit points
FREE

This indicator represents a genuine momentum oscillator according to the true definition of "Momentum", and as realised by the techniques of digital filtering. ( Note : download a complete set of true momentum oscillators here ). A scholarly paper on the subject by the current developer can be found here , but in this description we shall borrow only the minimum of conceptual and mathematical framework needed. In the process, we expose some long-held myths about indicators supposedly measurin
FREE

趋势交易指标 – 助力捕捉市场最佳趋势 指标优势 精准的趋势捕捉 :
该指标通过清晰的信号帮助您快速了解市场趋势的变化,无需复杂的分析,让交易决策更加高效。 灵活的参数选择 :
支持自定义计算周期、移动平均方法(如SMA、EMA、LWMA等)以及应用的价格类型(如收盘价、开盘价、最高价等)。无论是短线交易还是长线布局,该指标都能轻松适配。 直观的信号显示 : 蓝色柱状图 提示上升趋势信号。 红色柱状图 提示下降趋势信号。 多场景适用 :
适合外汇、股票、大宗商品等多个市场,满足不同交易者的需求。 使用指南 在您的交易平台中加载该指标。 设置适合您的计算周期(例如:23、50、144、369)。 根据交易策略选择移动平均方法(如SMA、EMA等)以及价格类型(如收盘价、最高价)。 根据图表中的信号柱,及时判断趋势强弱并作出相应的交易决策。 我们期待您的反馈! 该指标旨在为交易者提供简单易用且高效的工具。您的建议是我们不断优化和改进的重要依据!欢迎下载使用并分享您的体验。让我们一起打造更完善的交易工具!
FREE
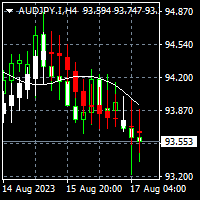
To download MT5 version please click here . - This is the exact conversion from TradingView: "Linear Regression Candles" By "ugurvu". - This is a non-repaint and light processing load indicator - You can message in private chat for further changes you need. This is a sample EA code that operates based on bullish and bearish linear regression candles . #property strict input string EA_Setting= "" ; input int magic_number= 1234 ; input string Risk_Management= "" ; input double fixed_lot_size=
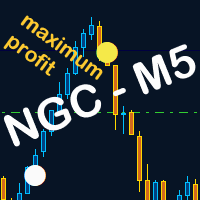
NGC indicator - M5
I recommend the M5 and M15 timeframes and a target profit of 5, 7, 10 pips or an exit at the Murray Math lines.
The indicator provides very accurate signals.
Although it works on any time frame, on the longer time frames the trading signals are much less frequent.
This can be compensated for by trading multiple currency pairs.
NGC - M5 is designed to help traders accurately identify potential trend reversals.
Because the indicator signal is so easy to understand, even i

LEVELSS 指标显示
- 每日看涨和看跌区域。每天从 00:00 至 23:59 都可以看到。 - 周线看涨和看跌区域。每周从周一 0:00 至周五 23:59。 - 从特定时间框架特别计算的通道,显示在所有其他时间框架上。默认情况下,这是 4 小时时间框架,您可以将其更改为您希望交易的任何其他时间框架。它是不间断计算的。
屏幕左上方显示区域和通道是看涨、看跌还是中性。当三个区域都看涨时,当前蜡烛上会出现一个绿点。当三个区域都看跌时,则出现粉红色。 该指标没有任何限制。
LEVELSS 指标显示
- 每日看涨和看跌区域。每天从 00:00 至 23:59 都可以看到。 - 周线看涨和看跌区域。每周从周一 0:00 至周五 23:59。 - 从特定时间框架特别计算的通道,显示在所有其他时间框架上。默认情况下,这是 4 小时时间框架,您可以将其更改为您希望交易的任何其他时间框架。它是不间断计算的。
屏幕左上方显示区域和通道是看涨、看跌还是中性。当三个区域都看涨时,当前蜡烛上会出现一个绿点。当三个区域都看跌时,则出现粉红色。 该指标没有任何限制。

This indicator draws the prior Highs and Lows for multiple timeframes, and can display potential Take Profit and Stop Loss levels. In Rob Smith's # The Strat terms, these are potential entry points, or alternatively potential targets for open positions. I like to use them in both ways. On a lower timeframe, say 5 minutes to get a good entry on a daily or weekly level, and then as a potential target. Very small stops required giving an excellent risk/reward ratio. Please watch the DEMO video

该指标将根据每个蜡烛的上方或下方绘制一个标签 罗伯·史密斯 斯特拉特 随着它们在您的图表上随着时间的推移而发展。
随着价格的变化,蜡烛可以在三种状态之间切换。当蜡烛第一次打开时,如果它完全位于前一根蜡烛的高点和低点内,那么它将以类型 1 开始。随着时间的推移,如果它突破了前一根蜡烛的高点或低点,它将成为类型 1类型 2,如果价格走势波动且无方向,则它可能会突破前一根蜡烛的相反侧,成为类型 3。
蜡烛
每根蜡烛都由其与前一根蜡烛的关系定义。
类型 1 - 内部蜡烛 - 蜡烛完全位于前一根蜡烛的高点和低点之内。内部蜡烛表明市场处于犹豫不决的时刻。
类型 2 - 趋势蜡烛 - 蜡烛在前一根蜡烛的高点或低点上方或下方延伸,但不会同时延伸到两者之上或下方。
类型 3 - 外部蜡烛 - 蜡烛已突破前一根蜡烛的高点和低点。外部蜡烛显示价格正在扩大,在较短的时间范围内产生更高的高点和更低的低点。
设置
显示内部 如果为真,则显示内部蜡烛的蜡烛编号。
显示趋势 如果为真,则显示趋势蜡烛的蜡烛编号。我经常将此设置保留为 false(默认值),因为我发现它会分散 1 类和 3

The indicator displays Renko bars on the chart and uses them to plot the ZigZag - trend lines connecting the local Lows and Highs of the price movement. Renko - specialized display of the price action, in which the graph is displayed not every bar of the time frame, but only under the condition that the price had passed more than the specified number of points. Renko bars are not bound to a time frame, so the indicator can work on any time frame with the same efficiency. This implementation of t
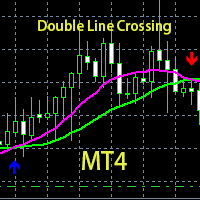
这是基于双均线交叉和箭头标识下单的自定义指标。 当出现蓝色箭头向上时做多单。 当出现红色箭头向下时做空单。 当粉红色线向上穿过绿色线交叉时,粉红色线在上方,绿色线在下方,出现金叉,会出现蓝色箭头。 当粉红色线向下穿过绿色线交叉时,粉红色线在下方,绿色线在上方,出现死叉,会出现红箭头。
这是经典的双线交叉金叉死叉很好的实现,并且用箭头标识出下单点,准确率较高,然后编写出来根据线颜色和箭头很好标识下单方向的指标,无时间,货币对限制。 当前指标最好在30分钟,1小时,4小时上工作,效果较好。 当前指标不建议用在1分钟或5分钟或15分钟或1day以上时间周期,虽然然指标是无限制的,但是效果不太好。 本指标工作平台最好选择点差比较小的交易商。 由于外汇交易是24小时运行,手工下单的话容易受到个人时间和情绪的影响,如果时间不够多的话,建议选择我基于当前指标编写的EA来交易。 基于当前指标编写的EA:https://www.mql5.com/zh/market/product/37133
FREE

使用 The Strat 进行交易时,关注多个时间范围很重要。 该指标将显示每个时间范围内当前蜡烛的每日、每周、每月和每季度状态。 圆圈图标表示该时间范围内的蜡烛目前是内部蜡烛,或 TheStrat 术语中的类型 1。 Inside Day 蜡烛正在巩固价格走势,我们正在寻找该范围的突破。 指向上或下的三角形图标是趋势蜡烛,或 TheStrat 术语中的类型 2。趋势蜡烛可以是看涨或看跌,表明它已经突破了之前的蜡烛范围,现在正朝着一个方向发展。 方形图标是外部蜡烛,或 Strat 术语中的类型 3。这表明两件事,一是价格在该时间范围内的方向未定,并且可能相当震荡,二是在较短的时间范围内,可能存在交易空头反转的好机会。该正方形将是看涨或看跌的颜色,以显示当前获胜的一方。 每个图标使用的颜色都可以根据您的喜好进行配置,文本和图标的大小也是可配置的。
设置
时间范围选择 每小时显示 当为 True 时,显示每小时蜡烛状态。 每日秀 当为 True 时,显示每日蜡烛状态。
每周秀 当为 True 时,显示每周蜡烛状态。 每月显示 当为 True 时,显示每月蜡烛状态。 季刊 当为 True

货币强度计,为您提供当前哪些货币强,哪些货币弱的快速视觉指南。 该仪表测量所有外汇交叉货币对的强度,并对它们进行计算以确定每种货币的整体强度。 我们根据 28 对的趋势计算货币的强度。
.货币强度计是指标的通用名称,用于显示您是在处理强货币还是弱货币。这种基于算法的指标依赖于各种货币对的汇率来提供每种货币的强弱程度。
通过访问我们的 MQL5 博客,您可以下载该指标的免费版本。 购买前试用,不受 Metatrader Tester 限制: 单击此处
1. 文档 所有趋势货币强度文档(说明)和策略详细信息均可在我们 MQL5 博客的这篇文章中找到: 单击此处。
2. 联系方式 如果您有任何问题或需要帮助,请通过私信联系我。
3. 作者 SAYADI ACHREF,金融科技软件工程师,Finansya 创始人。

OneWayTicket indicator is based on CCI indicator. In fact, it analyzes multiple CCIs from several timeframes. There are four Ways of OneWayTicket, read from left to right - 15 min, 30 min, 1 hour and 4 hours. The idea is to enter the market when all four CCIs agree on a trend. A trader chooses which timeframes to monitor. When all four ways of the OneWayTicket are green - Buy . When all four ways of the OneWayTicket are bright red - Sell . Original idea from the author: tageiger, revised for the

KT Bollinger Bands Alert is a modified version of the classic Bollinger Bands added with price touch alerts and visible price tags for each band separately.
Alert Events
When the current price touches the upper Bollinger band. When the current price touches the middle Bollinger band. When the current price touches the lower Bollinger band.
Features Separate alert events for each band. Ability to specify a custom interval between each alert to prevent repetitive and annoying alerts. Added price

测试演示版没有任何意义。你不会通过查看闪烁的数字了解任何信息。这是一个仪表盘。请尝试理解其理念,接下来我会帮助你完成所有内容。
符号必须用逗号(,)分隔,并按照你经纪商的显示格式输入参数,以确保它们能在仪表盘中识别。这些符号将被用于指标分析。
只需点击一次,即可直接从仪表盘打开任何货币对和任何时间周期。
MA Speedometer Dashboard 是一款功能强大的MetaTrader 4 (MT4) 指标,旨在通过动态市场分析增强交易策略。它提供强大的功能,用于识别市场趋势、在横盘市场中交易以及退出平淡市场条件,这一切基于移动平均线的角度。作为特别赠品,客户还会获得一款特别版本的MA Speedometer指标,这是 MA Speedometer Dashboard 的基础。
主要特点:
综合趋势分析:仪表盘使用移动平均线(MA)的角度来检测潜在的市场趋势。交易者可以通过颜色编码信号轻松发现强劲上升或下降趋势的开始: - 绿色:表示强劲上升趋势的开始,提供入场机会。 - 红色:表示强劲下降趋势的开始,也提供了入场机会。 - 黄色:表示横盘或平淡市场,提示潜在的退出点。

As per name Strength, This Indicator is a affordable trading tool because with the help of Popular Developers & Support of M Q L Platform I have programmed this strategy. I tried to input different types and different periods of Calculation regarding Support Resistance, Trends, Trend lines, Currency Strength, Oversold and Overbought Indications for good results. Furthermore, I have also care about Adjustable Settings So Trader can easily get in touch with market in another way also. What
FREE
Color Levels - удобный инструмент для тех, кто использует технический анализ с использованием таких инструментов, как Трендовая линия и Прямоугольник. Имеется возможность настройки двух пустых прямоугольников, трех закрашенных и двух трендовых линий. Настройки индикатора крайне просты и делятся на пронумерованные блоки: С цифрами 1 и 2 вначале - настройки пустых прямоугольников (рамок); С цифрами 3, 4 и 5 - настройки закрашенных прямоугольников; С цифрами 6 и 7 - настройки трендовых линий. Объе
FREE

Introducing the Consecutive Green/Red Candle Alert Indicator for MT4 - Your Trend Spotting Companion! Are you ready to take your trading to the next level? We present the Consecutive Green/Red Candle Alert Indicator, a powerful tool designed to help you spot trends and potential reversals with ease. Whether you're a new trader looking for clarity in the market or an experienced pro seeking additional confirmation, this indicator is your trusted companion. Key Features of the Consecutive Green/Re
FREE

机构级别/银行级别...心理级别/季度理论。
该指标将自动在“000、200、500 和 800”级别绘制,即我所知道的“机构级别”,或者也可以在图表上绘制“000、250、500 和 750”级别。
根据您学习机构级别交易/季度理论的位置,您可能知道它们有不同的名称,本质上核心思想是这些级别在大多数外汇市场中充当强大的支撑和阻力点。
群聊: https://www.mql5.com/en/users/conorstephenson 如有任何问题或购买后需要设置/操作建议,请联系我,谢谢! 主要功能
在当前价格上方和下方的数字“000、200、500 和 800”或“000、250、500 和 750”处绘制支撑和阻力或线条。 警报功能。- 能够使用 MT4 移动应用程序在达到数字时通知。 可自定义的线条类型、颜色和大小。 节省在每个图表上绘制级别的时间! 在机构和四分之一点级别之间快速切换。 强大的视觉支撑和阻力线。 独特的功能,用于搜索和动态调整支撑和阻力点的大小。 最新版本现在包括 S&R 点内的建议交易水平。 建议
与可靠的趋势指标一起使用以确认方向。检查多个时间范围以进一
FREE
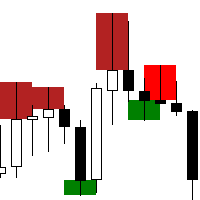
The "Rejection Block" MetaTrader 4 Indicator is a powerful tool designed to assist traders in identifying and visualizing rejection candlestick patterns, commonly referred to as rejection blocks. These patterns play a crucial role in market analysis as they often signify potential reversals or continuations in price movements. Key Features: Rejection Block Detection: The indicator meticulously scans price data to identify instances of rejection candlestick patterns. These patterns typically feat
FREE
介绍绘图指标:释放您在图表上的创造力!
您是否厌倦了在交易图表上进行注释的困扰?是否试图理解自己的分析或有效传达自己的想法?别再犹豫了!我们非常高兴向您推荐绘图指标,这是一款创新的工具,让您只需点击几下鼠标或挥动笔尖,就能轻松地在图表上进行绘图和注释。
我们创新的绘图指标旨在增强您的图表体验,释放您的创造潜力。有了这个强大的工具,您可以轻松表达自己的想法,标记重要水平,突出显示模式,并以前所未有的方式可视化您的交易策略。无论您是经验丰富的交易者、技术分析师还是初学者探索迷人的交易世界,绘图指标都是一个宝贵的资产,将彻底改变您与图表互动的方式。
主要特点:
用户友好界面:我们理解无缝用户体验的重要性。我们直观的界面确保您可以轻松地操作工具,并轻松访问所有功能。告别繁琐的设置,迎接简单性。
精准绘图:绘图指标允许您直接在图表上绘制线条、形状和注释。无论您是使用鼠标还是笔,我们的工具都提供流畅且响应灵敏的绘图体验,确保您的创造力无障碍地流动到图表上。
删除和重绘:犯了个错误或者想重新开始?没问题!我们方便的删除按钮可以轻松删除之前的绘图或注释。通过纠正和完善您的作品,您可以保持
FREE

本指标 基于 Zigzag 基础上... 增加了: 1.增加了箭头指示,使图表更鲜明 2.增加了价格显示,使大家更清楚的看清价格. 3.增加了报警等设置,可以支持邮件发送 原指标特性: 1.基本的波段指标构型. 2.最近的2个ZIGZAG点不具有稳定性,随着行情而改变,(就是网友所说的未来函数) 3.原指标适合分析历史拐点,波段特性,对于价格波动有一定的指导性.
Zigzag的使用方法一 丈量一段行情的起点和终点 (1)用ZigZag标注的折点作为起点和终点之后,行情的走势方向就被确立了(空头趋势); (2)根据道氏理论的逻辑,行情会按照波峰浪谷的锯齿形运行,行情确立之后会走回撤行情,回撤的过程中ZigZag会再次形成折点,就是回撤点; (3)在回撤点选择机会进场,等待行情再次启动,止损可以放到回撤的高点。 一套交易系统基本的框架就建立起来了。 Zigzag的使用方法二 作为画趋势线的连接点 趋势线是很常见的技术指标,在技术分析中被广泛地使用。 但一直以来趋势线在实战中都存在一个BUG,那就是难以保证划线的一致性。 在图表上有很多的高低点,到底该连接哪一个呢?不同的书上画趋势线的方法
FREE

MT5 Version Fibonacci Bollinger Bands MT4 Fibonacci Bollinger Bands is a highly customizable indicator that shows areas of support and resistance. This indicator combines the logic for the Bollinger Bands with the Fibonacci level. Fibonacci Bollinger Bands is the first indicator in the market that allows the user to 100% customize up to 12 Fibonacci levels, the Moving Average type and the price data source to use for the calculations. This flexibility makes the Fibonacci Bollinger Bands easi
FREE

''A professional trader is a greedy trader: he buys at lows and sells at highs with minimal risks and high returns,,
Pips Slayer is developed exactly for such trading approach . It's a universal indicator for tracking reversals and uses price action patterns, discrepancy of custom indicators and a multi-layered formula for identifying reversal structures. The indicator is very easy to use; it only shows arrows where is recommended to buy or sell and recommended take-profit and stop-loss prices
FREE

欢迎使用高级加特利模式识别指标 该指标根据价格结构的 HH 和 LL 以及斐波那契水平检测加特利模式,当满足某些斐波那契水平时,指标将在图表上显示该模式。 MT5版本: WH Advanced Gartley Pattern MT5
**该指标是 组合 的一部分 WH Ultimate Harmonic Patterns MT4 ,其中包括所有模式识别。** 特征 : 用于检测 Gartley 模式的高级算法 准确性 。 非常 快速地 和 低的 资源(对机器要求较低)。 不 落后 也不 重新粉刷 。 风俗 Fib 水平 调整(您可以根据您的首选设置更改斐波那契水平)。 展示 看跌 和 看涨 同时模式(能够显示看跌或看涨设置的多种模式)。 展示 贸易水平 线(带有可调节的停止点以及目标 1 和目标 2)。 适用于任何 象征 和任何 时间范围 。 更多的 特征 未来还会来! 参数:
最大条数 - 选择要回顾的最大条数。 XlegBar深度 - 调整 HH 和 LL 深
FREE

A classical MACD indicator where both the MACD line and the Signal line are displayed as lines. The difference between MACD and Signal line is displayed as a histogram. A user can change the color and thickness of histogram lines. So, histogram lines can be grouped into four different groups: positive ascending, positive descending, negative descending and negative ascending. Multi-currency Dashboard for the indicator is available https://www.mql5.com/en/market/product/72354
FREE

The Multi Pairs Forex Indicator is an advanced trading too l that allows traders to track and analyze the performance of multiple currency pairs in real-time on a single chart. It consolidates data from various Forex pairs, providing an at-a-glance overview of market conditions across different currencies and helps you save time. Useful for various trading styles, including scalping, day trading, and swing trading. Whether you're monitoring major pairs like EUR/USD, GBP/USD, or more exotic pair

The Supertrend Indicator is a popular technical analysis tool designed to assist traders in identifying market trends. The indicator combines the average true range (ATR) with a multiplier to calculate its value. This value is then added to or subtracted from the asset’s closing price to plot the supertrend line. The Supertrend Indicator can help identify trends, manage risk, and confirm market tendencies. The indicator is limited by its lagging nature, is not very flexible, and can send up fal
FREE

The Supertrend draws a line following the current trend.. Green Line under the candle means a likely bullish trend Red Line above the candle means a likely bearish trend
How to trade with SuperTrend indicator Buy when the Supertrend Green line is below the price, Sell when the Supertrend Red line is above the price. It is strongly suggested to use this indicator in a trending market.
Parameters Multiplier - the lower it is and the more sensitive is the line, meaning it will follow the price mo
FREE
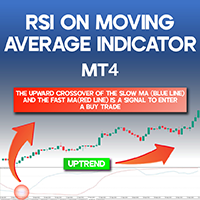
RSI-Based Moving Average Indicator for MT4 Introduction One of the widely used methods for trading in alignment with market trends is leveraging Moving Average Crossovers. The RSI-Based Moving Average Indicator enhances this strategy by integrating the Relative Strength Index (RSI) as an additional confirmation tool.
This indicator generates buy and sell signals by plotting two oscillating lines that move between 0 and 100, helping traders identify potential trade opportunities. RSI-Based Moving
FREE

This indicator is SO SIMPLE… when the green Rise Coming arrow appears, a price drop may be on the way! Plain and easy profits! As you receive more than one 'Rise Coming' text signal in a downtrend, it means momentum is building larger for a bull run. HOW TO USE 1. When the green "Rise Coming" text appears, a price jump may be on the way! This indicator Never Repaints! To get the best setting it's a matter of tweaking the indicator until it gives you the best results. Our recommendation, and what

Introduction This indicator detects volume spread patterns for buy and sell opportunity. The patterns include demand and supply patterns. You might use each pattern for trading. However, these patterns are best used to detect the demand zone (=accumulation area) and supply zone (=distribution area). Demand pattern indicates generally potential buying opportunity. Supply pattern indicates generally potential selling opportunity. These are the underlying patterns rather than direct price action. T
FREE
您知道为什么MetaTrader市场是出售交易策略和技术指标的最佳场所吗?不需要广告或软件保护,没有支付的麻烦。一切都在MetaTrader市场提供。
您错过了交易机会:
- 免费交易应用程序
- 8,000+信号可供复制
- 探索金融市场的经济新闻
注册
登录