适用于MetaTrader 4的技术指标 - 6

MT5 版本 | Trend Monitor VZ指標 | Owl Smart Levels 指標 | Owl Smart Levels策略 | FAQ 艾略特波浪理论是对金融市场过程的解释,它依赖于价格图表上波浪的视觉模型。 Valable ZigZag指标显示市场的波浪结构,可用于做出交易决策。 Valable ZigZag指标更稳定,不像经典的ZigZag指标那样经常改变方向,误导交易者。 这是通过在指标波的构造中使用分形来实现的. Telegram 聊天: @it_trader_chat 新的 Expert Advisor Prop Master - 在您的交易终端中进行测试 https://www.mql5.com/zh/market/product/115375
Valable ZigZag主要是一个趋势指标。 它设定了交易者应该交易的主要方向,但它也可以作为进入市场的指标。 例如。
在H4时间帧图表上安装指标,最后一波的方向将显示趋势的方向。 选择趋势交易方向后,切换到H1时间框架,并在针对所选趋势的最后一个峰值的细分处进入市场(见图2)。
Val
FREE
** NOTE: This indicator uses realtime data. Thus DO NOT download Demo version. If you still need demo version, please refer to free version .
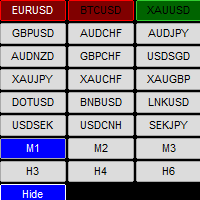
Symbol Chart Changer is an indicator/utility that offers you the option to switch between symbols and timeframes.
You can choose any symbol and timeframe on the same chart with just a few clicks. In addition, this indicator also shows the profit of the symbol through the color of the buttons.
Features: Click buttons on the chart to monitor a
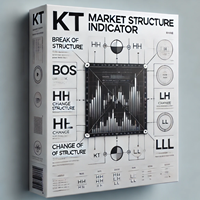
The KT Market Structure intelligently detects and displays Break of Structure (BOS) , Change of Character (CHoCH) , Equal Highs/Lows (EQL) , and various significant swing high/low points using our proprietary algorithm for accurate pattern detection. It also offers advanced pattern analysis by effectively demonstrating the captured profit for each pattern. A fully automated EA based on this indicator is available here: KT Market Structure EA MT4
Features
Accurate Pattern Detection: Our advance

"Ppr PA" is a unique technical indicator created to identify "PPR" patterns on the currency charts of the MT4 trading platform. These patterns can indicate possible reversals or continuation of the trend, providing traders with valuable signals to enter the market.
Features: Automatic PPR Detection: The indicator automatically identifies and marks PPR patterns with arrows on the chart. Visual Signals: Green and red arrows indicate the optimal points for buying and selling, respectively. Ar
FREE

This is Multiple Timeframe of Malaysia SNR Levels and Storyline. The single timeframe version here Features: + Display level on multiple timeframe (higher or lower) + Turn on/off level on timeframe + Alert when price touch level 1. if high > resistance level but close of candle < resistance level , this level become unfresh - Name of level will have "(m)" meaning mitigated if close of candle > resistance level , this level become invalid and can be removed in chart (there is setting for keep

该指标从极值开始构建三周期信号和反转形态 123。信号出现在第二根蜡烛的开口处。 该形态可以通过不同方式(测试点 3、突破等)进行交易。退出通道或突破趋势线是寻找入场点的主要触发因素。 图标根据斐波那契水平着色。黄色图标表示对某一水平的测试,在该水平上信号会被放大。 使用多币种仪表盘,您可以跟踪 123 形态是在哪些货币对上发现的,以及有多少个条形图跟随该形态。 基于分形之字形。可重新绘制。因此,请在博客链接 - 123 Fractal Trading With UPD1 中研究该策略。
输入参数。
Bars Count – 显示历史记录。 Tooltip – 将鼠标悬停在对象上时是否显示工具提示。 Show Semaphore – 启用或禁用信号灯。 Show 123 – 启用或禁用显示 123 模式。
Period 1, 2, 3 - 信号周期。 Period 1, 2, 3 Visual – 启用或禁用单独周期的显示。
Arrow Coeff Period – 用于计算的条数。 Arrow Coeff – 平均烛台值的系

TPA True Price Action indicator reveals the true price action of the market makers through 100% non-repainting signals (except early signals mode) strictly at the close of a candle!
TPA shows entries and re-entries, every time the bulls are definitely stronger than the bears and vice versa. Not to confuse with red/green candles. The shift of power gets confirmed at the earliest stage and is ONE exit strategy of several. There are available now two free parts of the TPA User Guide for our custom
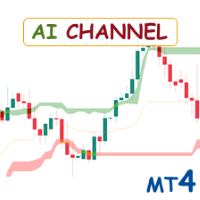
Special offer : ALL TOOLS , just $35 each! New tools will be $30 for the first week or the first 3 purchases ! Trading Tools Channel on MQL5 : Join my MQL5 channel to update the latest news from me AI Channels 指标利用 滚动K均值聚类 ——一种在聚类分析中强大的机器学习技术——实时提供基础价格趋势的见解。该指标根据聚类价格数据创建自适应通道,使交易者能够做出有关趋势方向和市场状况的明智决策。 该指标还包括一个 跟踪止损选项 ,提供了更灵活的风险管理方法。 查看更多MT5版本: AI Channels MT5 查看更多产品: 所有产品 如何使用AI Channels指标 每个通道的极端值为确定趋势方向提供了宝贵的见解: 上通道极端值: 价格突破此水平可能表明上升趋势。 下通道极端值: 价格跌破此水平可能表明下降趋势。 调整 窗口大小 (用于聚类的
FREE

这种用于从无穷远衡量货币强弱的创新指标是长期交易的黄牛和交易者不可或缺的助手。 分析货币强弱的系统早已被世界领先的交易者所熟知并在市场上使用。 没有这种分析,任何套利交易都是不完整的。 我们的指标很容易确定基础货币相对于彼此的强弱。 它显示所有或当前货币对的折线图,允许即时分析和搜索最强的入口点。 该指标直观,允许您快速找到并切换到任何一对,具有可放置在地下室和主图表上的移动面板。 通知货币强度变化的计时器模式使交易者有机会在手机上收到通知。
使用货币功率计无穷大指示器的几种策略:
1. 使用货币强度的线性显示图表搜索交叉点作为新兴趋势的信号 2. 在趋势反转信号出现后,向强势货币方向反弹 3. 使用货币强度发散分析扭转当前趋势 4. 使用其他无限指标向强势货币方向交易
FREE

比特币预测器是一个基于箭头的指标,旨在预测价格反转。 此工具可与 BTC 和其他加密货币一起使用。它也可以与货币一起使用。但是您需要首先检查哪些配对最有效。一些配对和时间框架可以工作得非常好。您可以自由测试并自己查看。 该指标非常易于使用。所有你需要的是按照箭头。该指标可以作为独立系统工作,也可以作为您已经在使用的任何系统的一部分。购买后我将与您分享我的交易建议和奖金指标! 指示信号可以很容易地调整。您可以使指标算法适应任何时间范围,以及加密货币以外的其他货币对。 信号不要重绘!无论您目前拥有何种级别的交易经验,该交易指标都会对您有所帮助。 购买后请联系我!我将与您分享我的交易建议和奖金! 感谢您对我的指标的关注和兴趣!
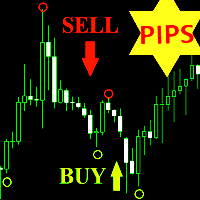
Pips Scalper Indicator - is a forex trading indicator specially designed for traders who are interested in scalping strategy. Scalping is a trading strategy in which a trader attempts to make a positive trade by snippets of small price movements. How to use the indicator? When the indicator draws a green circle on the chart of the currency pair, we open a buy deal and set a short TakeProfit of 20-25 points. In 87% of the signals, the price will go at least 20 pips in the direction of the arrow.

这是免费产品,欢迎您使用以满足您的需求!
我也非常感谢您的积极反馈!非常感谢!
//很棒的交易机器人和指标可在此处找到:https:// www.mql5.com/en/users/def1380/seller
Crypto_Forex 指标:Heiken Ashi Candles for MT4。无需重绘。 - Heiken_Ashi_Candles 与趋势线 MA 指标完美结合,如图所示。 - 指标 Heiken_Ashi_Candles 是非常有用的辅助指标,可以使趋势更加明显。 - 它有助于使烛台图更具可读性,趋势更易于分析。 - 大多数利润是在市场趋势时产生的,因此正确预测趋势是必要的。 - Heikin-Ashi 图表的构造类似于常规烛台图,只是计算每个条的公式不同 - Heikin-Ashi 具有更平滑的外观,因为它本质上是取运动的平均值。 - 绿色蜡烛没有下影线,表示强劲的上升趋势。 - 红色蜡烛没有上影线,表示强劲的下降趋势。 - 蜡烛主体较小,周围有上下影线,表示趋势发生变化或修正。 这是仅在此 MQL5 网站上提供的原创产品。
FREE

Order Block Indicator for ICT and Smart Money Trading in MT4 The Order Block Indicator is an essential tool for traders using ICT (Inner Circle Trader) and Smart Money Concepts on the MetaTrader 4 (MT4) platform. This indicator helps identify crucial price zones where institutional orders are likely to be concentrated, allowing traders to pinpoint potential reversals or high-impact market levels. Bullish order blocks appear in green , while bearish order blocks are displayed in brown . When pric
FREE
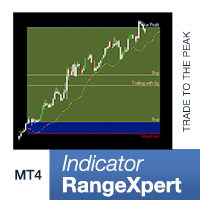
免费指标 - 无限帐户 - 单击此处查看我的所有免费产品
到那个时刻 发现市场上的完美机会 并遵循 强劲趋势 通过突破,这 RangeXpert 指标 提供宝贵的支持。该指标是我专门为 初学者和半专业人士 并提供出色的分析功能,让您准确识别市场机会并优化您的交易策略。RangeXpert 利用多个头寸优势 复杂的利润分配 即使在充满挑战的市场条件下也能表现出更高的适应性和弹性。这 算法 让您找到进入交易的理想时机,提高每个交易者的成功率 范围专家 。
高精度 AUTOTRADING 交易系统(EA)现已推出:
RangeXpert MT4 » https://www.mql5.com/zh/market/product/103455
主要优点 完美的进入区 高度可见的止盈/止损线 直观的颜色、图表和方向指示器 提供所有类型的通知:弹出通知、电子邮件、推送通知和声音警报 兼容所有时间范围和所有资产 为交易者提供的一体化解决方案
建议 时间范围:M1、M5、M15 和 H1 资产:外汇、期货、加密货币
FREE

You’ll love how you can receive alerts to your email and SMS when the candles turn green or red signifying the best buy and sell times in correlation to confirmed uptrends and downtrends. TO USE 1. Buy when green candles appear - this represents an uptrend. 2. Sell when red candles appear - this represents a downtrend. EXTRA FEATURE This indicator NEVER repaints so when a candle closes, that color is final. Also, the blue trend lines in the photos are not included, this is to demonstrate the pri

MACD 日内趋势是通过改编自 Gerald Appel 在 1960 年代创建的原始 MACD 而开发的指标。
通过多年的交易,观察到通过使用斐波那契比例更改 MACD 的参数,我们可以更好地呈现趋势运动的连续性,从而可以更有效地检测价格趋势的开始和结束。
由于其检测价格趋势的效率,还可以非常清楚地识别顶部和底部的背离,从而更好地利用交易机会。
请务必尝试我们具有可配置功能和警报的专业版本: MACD Intraday Trend PRO
特征 适用于任何货币对 在任何时间范围内工作 适用于 Renko 图表
如果您仍有疑问,请通过直接消息与我联系: https://www.mql5.com/zh/users/robsjunqueira/ ----------------------------------------- 如果可能,请留下您的评论和评论,以帮助向社区传播信息。 还可以了解我们的其他指标和专家顾问。 我有几种有用的指标和专家顾问。 如果您有任何建议,请随时提出建议,这样我才能改进产品,使持续改进永无止境。
FREE
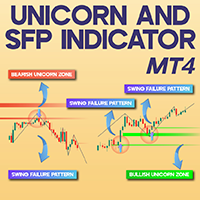
Unicorn + SFP Indicator for MT4 The Unicorn + SFP Indicator is an advanced trading tool integrating liquidity principles with ICT methodology. A Unicorn Zone emerges where a Breaker Block and a Fair Value Gap (FVG) overlap, marking areas with a high probability of price reversal. The Swing Failure Pattern (SFP) occurs when the price falsely breaches a level, indicating potential liquidity grabs and a possible market shift. Features of the Unicorn + SFP Indicator A summary of the indicator's spec
FREE

CONTACT US after purchase to get the Indicator Manual. Limited Period Offer is On! Price will increase after the next 10 purchases. Read the product description carefully before purchasing the product. Due to regulatory restrictions, our service is unavailable in certain countries such as India, Pakistan, and Bangladesh. Quick Overview Indicator Dashboards - Get live signal of 10 trading assets' volatility at a glance. Customizable Symbols – Easily switch between assets from Market Watch us

对于那些总是想了解帐户当前情况的人来说,此信息指示器将很有用。该指标显示诸如利润点数、百分比和货币等数据,以及当前货币对的点差以及柱在当前时间范围内收盘的时间。 MT5版本 - 更多有用的指标
有多种选项可用于在图表上放置信息线: 价格右侧(运行在价格后面); 作为评论(在图表的左上角); 在屏幕的选定角落。 还可以选择信息分隔符: | / 。 \ # 该指标具有内置热键: 键 1 - 退一步显示信息类型(价格、评论或角落的右侧) 关键2——信息显示类型的进步 键 3 - 更改信息行显示的位置 可以在设置中重新分配热键。 该指标易于使用且信息丰富。可以在设置中禁用不必要的信息项目。
设置 替换显示信息的热键(向后) - 后退信息显示类型 用于替换显示信息的热键(前进) - 信息显示类型向前迈进了一步 用于更改外观/角信息字符串类型的热键 - 更改信息行显示的位置 文字颜色 - 文字颜色 盈利颜色 - 有浮动利润时的文字颜色 失色 - 存在浮动损失时的文本颜色 分离器 - 一行中的数据分隔符。可以采用五个值:“|”、“/”、
FREE

FREE UNLIMITED PM: https ://linktr .ee /ARFXAUTOTRADE ?utm_source =linktree_admin_share The Trend Line is an essential tool for traders, whether you're mapping trends or looking for counter-trend opportunities. I’m excited to share my custom Auto Trend Line Indicator, designed to make it easier for you to analyze the market. How to Use the Trend Line: Trend Following: Wait for the trend line to return and touch it, forming a continuation pattern on the candlestick. This is your signal to follow
FREE
Multi-Time-Frame-Multi Currency Signals Dashboard Indicator It is an Advanced multi-utility dashboard which works with full customization of signal settings and graphical interface. It works with Multi Symbols and Multi-Time frames from 1 SINGLE CHART TEMPLATE. It will automatically open the charts where the latest signals had formed- showing the important levels (Entry, Targets, Stop Loss) Many types of sorting methods for the scanner. A robust ENTRY based on TREND OF MULTI-TIME FRAMES ( Com

Introducing the Volume Order Blocks indicator, a game-changing tool designed for traders who demand precision and clarity in their market analysis. This advanced indicator not only identifies order blocks but also integrates crucial volumetric data, allowing you to gauge the strength of these blocks with unparalleled accuracy. MT5 version - https://www.mql5.com/en/market/product/121238/ Key Features of the Volume Order Blocks: Bullish & Bearish Order Blocks: Easily visualize and dif

图表投影指标 图表投影最初是一个小指标,它使用内置的之字形技术指标来预测未来的价格走势(您可以在评论中找到旧算法)
这个想法很简单,过去的价格行为不会转化为未来,但也许如果我们没有过于具体,或者过于笼统,我们可以提取关于可能发生的事情的指导方针。
图表投影的“论文”是这样的: 交易者会查看图表来做出决定,因此,算法也可以查看图表。不读指标值,不读价格,但看图表 寻找某物就是找到一个重复的熟悉模式,并且,为了找到那个熟悉的模式,您需要存储它。
Zig zag 是不够的,需要一种新的算法来做到这一点,并保留有关图表视觉方面的数据,因此需要光学算法。
Chart Projection 配备了 3 种光学算法,用于对价格行为进行低、中和高范围扫描。每个光学器件都会收集与兴趣点图表直接相关的历史数据。
兴趣点是高点或低点,但这不是我们的分析应该停止的地方。每一个高点和低点都有一个领先的势头和一个结果,以及它在整体趋势中的位置。光学算法将其与引导和引导至感兴趣点的时间一起收集。随着价格的发展,来自每个光学器件的数据不断收集,并产生对特定 POI(兴趣点)出现时价格行为的估计。当检测
FREE

一款可以直观识别波段趋势的顶底指标,手工交易最佳选择,不重绘不漂移。 如何免费获得此指标: 了解更多信息 每间隔三天涨价$20元,涨价过程: 79--> 99 --> 119...... 涨到目标价 $ 1000为止。 适应任何新手和量化交易的朋友,可以把信号写入到EA中自由发挥,数组3和数组4,例:3>4为变绿,3<4为变红,如有不懂的请联系我。 参数简介: KQuantity
显示历史K线的数量
InpPeriod_3
指标获取范围参数
Popupalarm
弹窗报警开关
Mailalarm
邮件报警开关
AlarmTimeinterval
每报警一次的间隔时间
Upperhorizontalline
上方水平线参数
Lowerhorizontalline
下方水平线参数
===================分析方法:===================== buy: 指标绿柱在下方水平线下,由红柱变成绿柱确定做buy。 sell:指标红柱在上方水平线上,由绿柱变成红柱确定做sell。

The Missing Edge You Need To Catch Breakouts Like A Pro. Follow a step-by-step system that detects the most powerful breakouts!
Discover market patterns that generate massive rewards based on a proven and tested strategy.
Unlock Your Serious Edge
Important information here www.mql5.com/en/blogs/post/723208
The Reliable Expert Advisor Version
Automate Breakout EDGE signals using "EA Breakout EDGE" Click Here Have access to the game changing strategy that will take your trading to the next l

介绍 Quantum Breakout PRO ,突破性的 MQL5 指标,正在改变您交易突破区域的方式! Quantum Breakout PRO 由拥有超过 13 年交易经验的经验丰富的交易者团队开发,旨在通过其创新和动态的突破区域策略将您的交易之旅推向新的高度。
量子突破指标将为您提供带有 5 个利润目标区域的突破区域的信号箭头,以及基于突破框的止损建议。
它既适合新手交易者,也适合专业交易者。
量子 EA 通道: 点击这里 MT5版本: 点击这里 重要的!购买后请私信我领取安装手册。 建议:
时间范围:M15 货币对:GBPJPY、EURJPY、USDJPY、NZDUSD、XAUUSD 账户类型:ECN、Raw 或 Razor,点差极低 经纪商时间:GMT +3 经纪商:IC Markets、Pepperstone with Raw 和 Razor 的点差最低
规格:
不重漆! 最多 5 个建议利润目标区域 建议止损水平 可定制的盒子。您可以设置自己的 Box Time Start 和 Box Time End。
接触
如果您
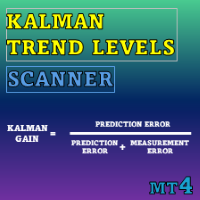
Special offer : ALL TOOLS , just $35 each! New tools will be $30 for the first week or the first 3 purchases ! Trading Tools Channel on MQL5 : Join my MQL5 channel to update the latest news from me Kalman Trend Levels 是一种先进的趋势跟踪指标,利用尖端的卡尔曼滤波技术,为交易者提供强大的分析信号。该工具设计精确且具有适应性,不仅能够识别关键的支撑和阻力区域,还提供全面的市场动量和趋势变化分析方法。 查看 MT5 版本: Kalman Trend Levels MT5 查看更多产品: All Products See more detailed explanation of Kalman Filter logic in this indicator here: Kalman Filter Logic in Trend Detection
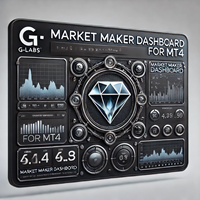
G-Labs Market Maker Dashboard - Exclusive Seasonal Offer Elevate your trading with the original G-Labs Market Maker Dashboard, available for a limited time at just $70 USD. Ideal for starter traders, this dashboard has been enhanced with new features and now includes a comprehensive training video. This indicator is for people trading the market makers method and is the entry level dashboard for that strategy is available for both mt4 and mt5. its a market scanner in real time showing peak

The indicator displays a matrix of indicators across multiple timeframes with a sum total and optional alert. Custom indicators can also be added to the matrix, in a highly configurable way. The alert threshold can be set to say what percentage of indicators need to be in agreement for an alert to happen. The alerts can turned on/off via on chart tick boxes and can be set to notify to mobile or sent to email, in addition to pop-up. The product offers a great way to create an alert when multiple

Dark Sprint is an Indicator for intraday trading. This Indicator is based on Trend Following strategy, also adopting the use of the atr to determine the right volatility. We can enter in good price with this Indicator, in order to follow the strong impulse on the current instrument.
Key benefits
Easily visible sprint lines Intuitive directional arrows Automated adjustment for each timeframe and instrument Easy to use even for beginners Never repaints, never backpaints, Not Lag 100% compatibl

Welcome to our Price Wave Pattern MT4 --(ABCD Pattern)-- The ABCD pattern is a powerful and widely used trading pattern in the world of technical analysis.
It is a harmonic price pattern that traders use to identify potential buy and sell opportunities in the market.
With the ABCD pattern, traders can anticipate potential price movements and make informed decisions on when to enter and exit trades. EA Version : Price Wave EA MT4
MT5 version : Price Wave Pattern MT5
Features :
Automatic
FREE

Was: $249 Now: $149 Market Profile defines a number of day types that can help the trader to determine market behaviour. A key feature is the Value Area, representing the range of price action where 70% of trading took place. Understanding the Value Area can give traders valuable insight into market direction and establish the higher odds trade. It is an excellent addition to any system you may be using. Blahtech Limited presents their Market Profile indicator for the MetaTrader community. In

Ultimate Renko is a full implementation of a robust Renko style charting solution for MT4. It enables creating custom live charts resembling Median Renko , Mean Renko , Turbo Renko , and Better Renko candles as well as Vanilla Renko and Renko with wicks , PointO charts, and many more. This all-in-one package provides all of the signals needed by day traders, scalpers, and even long-term traders. You can apply all of the standard and custom indicators and technical studies as well as templates to
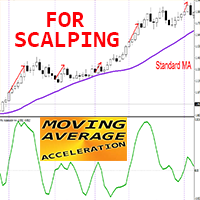
Crypto_Forex 指标移动平均线加速度适用于 MT4,无需重绘。
MA 加速度 - 是剥头皮指标,设计为“MA 速度”指标的辅助工具
- 该指标的计算基于物理方程。它将向您显示移动平均线的加速度。 - 有很多机会使用 MA 加速度升级标准策略。它可以用于 SMA、EMA 和 LWMA。 - MA 加速度是相应移动平均线的二阶导数。 - 指标显示 MA 速度指标改变其值的速度。 - 如果 MA 加速度指标的值 < 0:MA 速度在看跌方向上增加;如果 MA 加速度指标的值 > 0:MA 速度在看涨方向上增加。 - 建议在主要趋势方向的快速剥头皮策略中将 MA 加速度指标与 MA 速度指标一起使用,如果 MA 速度指标的值 < 0:趋势下降;如果 MA 速度指标的值 > 0:趋势上升。 - 上升趋势:一旦 MA 加速度 >0,开启买入剥头皮交易。 - 下降趋势:一旦 MA 加速度 <0,开启卖出剥头皮交易。
参数: 1) Period_V:相应 MA 速度指标的周期。建议值为 3 到 7。 2) Period_ACC:加速周期。建议值为 2 到 12。Period_ACC

The indicator scans for Dinapoli thrust pattern in multiple timeframes for a specific market. Key Features Indicator can be used for all markets It can scan for thrust pattern on W1, D1, H4, H1, M30, M15 and M5 timeframes Ability to choose number of bars required above/below displaced moving average to define thrust Able to move display label on chart by single click Parameters Minimum Bars: Least amount of bars to account for Thrust DMA Period: Moving average period DMA Shift: Number or bars re
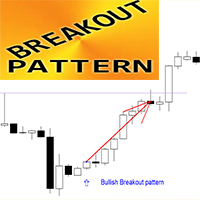
Crypto_Forex 指标“突破模式”适用于 MT4。
- 指标“突破模式”是价格行为交易的非常强大的指标:无需重绘,无延迟。 - 指标检测图表上的突破条组合,也称为“内部 3 条”: - 看涨突破模式 - 图表上的蓝色箭头信号(见图片)。 - 看跌突破模式 - 图表上的红色箭头信号(见图片)。 - 带有 PC、手机和电子邮件警报。 - 指标“突破模式”非常适合与支撑/阻力位结合使用。 .................................................................................................................... // 更多出色的专家顾问和指标可在此处获得: https://www.mql5.com/en/users/def1380/seller 这是仅在此 MQL5 网站上提供的原创产品。
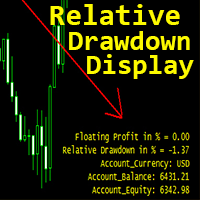
Crypto_Forex 指标“相对回撤显示”适用于 MT4,是实用的交易工具。
对于使用网格交易系统的交易者来说,这是必备指标!!!
- 相对回撤显示指标显示您账户中当前的相对 DD 或浮动利润(以百分比表示)。 - 内置 PC 和移动警报,触发级别可调。 - 指标还显示账户余额和权益。 - 可以将指标值定位在图表的任何角落: 0 - 左上角,1 - 右上角,2 - 左下角,3 - 右下角。还可以设置颜色和字体大小。 - 如果使用相对回撤显示,交易者不再需要任何计算器。 .................................................................................................................... // 更多出色的专家顾问和指标可在此处获得: https://www.mql5.com/en/users/def1380/seller 这是仅在此 MQL5 网站上提供的原创产品。
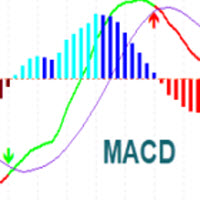
MACD Indicator It has MACD line, Signal line, and Histogram. The Histogram has 4 colors based on Direction Above and Below the Zero Line, showing its movement direction as simple as possible. Allows Show MACD & Signal Line, Show Change In color of MACD Line based on cross of Signal Line. Show Dots at Cross of MacD and Signal Line, Turn on and off Histogram. Enjoy your trading experience, and feel free to share your comments and reviews.
If you are interested in this indicator, you might
FREE

FOLLOW THE LINE GET THE FULL VERSION HERE: https://www.mql5.com/en/market/product/36024 This indicator obeys the popular maxim that: "THE TREND IS YOUR FRIEND" It paints a GREEN line for BUY and also paints a RED line for SELL. It gives alarms and alerts of all kinds. IT DOES NOT REPAINT and can be used for all currency pairs and timeframes. Yes, as easy and simple as that. Even a newbie can use it to make great and reliable trades. NB: For best results, get my other premium indicators for more
FREE

Abiroid Profit Percent Series 1: Arrows Indicator Stochastic Ichimoku with ATR
Get the Scanner for free. For getting Profit Percentages for Multiple Timeframes and Multiple Pairs. And read detailed description about this indicator and all the settings here. And get extra Indicators, Templates and settings for download: https://abiroid.com/product/profit-percent-stoch-ichimoku-with-atr
Watch the tutorial video here: https://youtu.be/C45-9kWPE2Q
About The Strategy:
This strategy has 3 main par
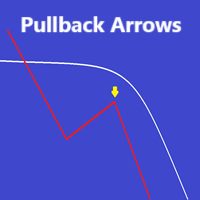
Gāi zhǐbiāo tígōng mǎi rù hé mài chū jiàntóu yǐjí jīyú EMA de yídòng píngjūn xiàn hé tiáo xíng yánsè
yídòng píngjūn xiàn shàngfāng jǐn xiǎnshì mǎi rù jiàntóu, yídòng píngjūn xiàn xiàfāng jǐn xiǎnshì mài chū jiàntóu
jiàntóu jīyú fǎn zhuǎn suànfǎ, yīncǐ shìtú zhǎodào huítiáo diǎn
kěyǐ gēnjù xūyào jīhuó jǐngbào
shìhé rènhé shíjiān fànwéi huò xuǎnzé de gōngjù
gòumǎi qián qǐng xiān jìnxíng yǎnshì cèshì
xiǎngshòu
-----------------------

扫描模式 是尖端工具,旨在以无与伦比的准确性识别看跌趋势旋转和看涨趋势旋转,
使您能够做出明智的交易决策并领先市场一步。 MT5 版本 : WH Sweep Pattern MT5 扫描模式特点:
它使用不同的颜色和样式自动检测并在图表上绘制看跌和看涨趋势旋转。 它会向您发送警报(声音、电子邮件、推送通知)并在您的图表上绘制箭头,这样您就不会错过任何交易信号。 它适用于任何货币对、时间范围和市场状况,为您的交易提供了一个多功能且可靠的工具。 使用可定制的参数根据您的特定交易偏好定制指标。
不要让市场轮动让您措手不及 – 今天使用扫描模式指标增强您的交易策略,您可以轻松发现看跌趋势反转或看涨趋势反转,
无论您是经验丰富的交易者还是新手, 该工具都将提升您的市场分析能力,并帮助您在动态的交易世界中做出明智的决策。
立即下载扫描模式指标并掌控您的交易旅程。
**购买后联系我了解更多细节和华丽**

軟體說明 此指標可以在不同的時間範圍和設定上顯示 1 或 2 個 MACD 指標。 有一個使用 EMA 進行計算的免費版本。 此專業版使用所有 4 種移動平均類型進行計算:簡單、指數、平滑和線性加權。 活動指示器可以發出彈出、聲音、推播或電子郵件警報。 免費版本僅針對零電平交叉警報,如果使用者選擇該選項,則此專業版警報可以設定為零電平交叉或直方圖訊號線交叉。 可以在一個或兩個活動指標上設定警報,即使每個指標的時間範圍和週期不同。 當使用 2 個 MACD 指標時,警報可以分別對每個指標起作用。
主圖表上有一個帶有按鈕的顯示面板,顯示活動指標及其設定。 有一個選項可以隱藏此面板。 使用臨時按鈕,您可以隱藏活動的 MACD 之一
增加了免費版本所沒有的額外功能:分歧。 您可以選擇在兩個 MACD 上顯示背離。 您可以選擇常規背離或隱藏背離,也可以兩者兼有。 您可以選擇在直方圖或訊號線上顯示分歧。 您也可以只在 MACD 子視窗或價格圖表和 MACD 中顯示線條。 在價格圖表上,您也可以顯示背離箭頭。 您可以針對兩種類型的背離分別設定警報。 顏色和線條粗細選項的完全客製化。
設定
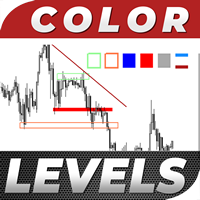
Color Levels is a convenient tool for traders using a Trendline and a Rectangle in their technical analysis. It allows setting two empty rectangles, three filled ones, and two tredlines. The indicator parameters are very simple and divided into numbered blocks: The ones beginning with 1 and 2 - empty rectangle (frame) parameters; 3, 4, and 5 - filled rectangle parameters; 6 and 7 - trendline parameters. Simply click a desired object and it will appear in the upper left corner. Main Adjustable Pa
FREE

"HOW TO TRADE ANY CURRENCY PAIR WITH UNUSUAL PRECISION & PROFITABILITY!" Most traders reset their accounts very quickly. But there are exceptions...BIG EXCEPTIONS! Successful traders "make money" every month. You really only need two things: good indicator for sure and proper money management. Proper money management is a skill that anyone can master. It may sound trite, but first of all you need an indicator like Forex Trend Commander. An indicator that works equally well on all time frames
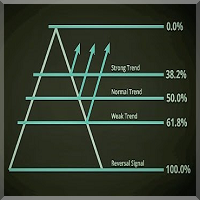
介紹 斐波那契水平專業指標是日常交易的絕佳工具,可作為其他指標的補充,以更好地確認交易設置和市場走向。該指標易於設置,適用於所有貨幣對和時間範圍,推薦使用 M15-W1。
該指標的目的是在圖表上顯示斐波那契水平、日線、上線和下線。作為附加功能,該指標還會在您的圖表上繪製回撤線和擴展線,並告訴您當天的高點、低點、範圍和點差。 Fibonacci Levels Pro 指標使用前一天的高點和低點為您繪製計算線。這是每個交易者必備的工具! 特徵 易於設置,無需複雜的設置 乾淨流暢的圖表線條,易於閱讀 適用於所有貨幣對和時間範圍 斐波那契線的可調顏色設置 可調節儀表板顏色 包含帳戶信息的儀表板 指標參數 UpperFiboColor - 在 123.6 到 400.0 之間設置您想要的上斐波那契水平的顏色 MainFiboColor - 為每日斐波那契水平從高 100.0 到低 0.0 設置所需的顏色 LowerFiboColor - 從 -23.6 到 -500.0 為較低的斐波那契水平設置所需的顏色 主要斐波那契線 - 真/假。在圖表上顯示從高 100.0 到低 0.0 的每日水平 儀
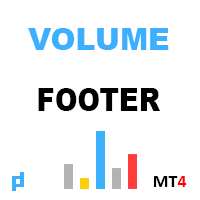
指示器显示垂直体积. 在设置中,有2个系数用于确定高和极值,1个用于确定低音量。 类似的算法也用于指示器 UDP1 Volume Pixel 。 当检测到指定的体积时,直方图以适当的颜色着色。 直方图的宽度会根据比例自动选择。 作为一项规则,价格反应的最大和最小体积。 但有必要使用确认信号。
输入参数 。
基本设置 。 Bars Count - 指标将显示在其上的蜡烛数 。 Calc Bars - 确定体积偏差的平均蜡烛数 。 Low Volume Factor - 我们定义低容量的系数 。 High Volume Factor - 我们定义大体积的系数 。 Extreme Volume Factor - 我们定义极值体积的系数 。
视觉设置 。 Histo Color - 根据蜡烛的体积和方向选择颜色来着色直方图 。 Width Histo (-1 auto) - 规则直方图的厚度 。 Width Color Histo (-1 auto) - 颜色直方图的厚度。 默认情况下,自动选择厚度。
电线杆 。 Draw Polus - 显示两极。 极点被定义为逆分形。 左右的音量
FREE
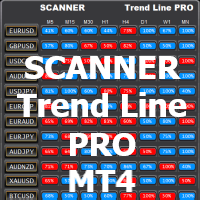
使用趋势线PRO指标并设置由优化器实用程序创建的文件 您可以下载其他程序:这里
扫描仪设计用于接收从M5到MN1的所有对和时间帧上的趋势线PRO指标的新信号
为了使扫描仪工作,您必须有一个指示器。 扫描仪趋势线专业的主要优点是能够使用一个单独的设置文件为每对和时间帧。 您可以在附加扫描仪窗口中自动调整、更改和保存每对的设置。 您还可以使用由特殊趋势线优化器实用程序开发和优化的现成设置文件。 扫描仪允许您仅使用所需的设置,从而加快其工作速度。 扫描仪是手动交易和测试新策略所必需的。 只需在您的计算机或VPS上的任何图表上安装Trend Line PRO SCANNER,它就会通知您一个新的信号,并向您的手机上的移动版Meta Trader发出警告或短信,无论您身在何处。
如何使用扫描仪: https://www.mql5.com/en/blogs/post/749265
1. 在使用之前,加载所需字符的历史记录(按F2) 2. 使用优化器实用程序为您要交易的每对和时间帧优化和保存参数 3. 首先,在图表上安装趋势线PRO指标 4. 之后,将扫描仪添加到相同的图形 (指示
FREE

This is a multi timeframe version of the Supply and Demand indicator . It allows you to analyze a chart using the law of supply and demand on three different timeframes at a time. You will see zones of sales and purchases and determine the most profitable points to open positions. The indicator is based on the principle of market fractality. Supply and demand zones show places where a strong buyer or seller has made the price reverse and change its direction. The indicator has several types of

目前正在进行节日折扣,价格为399美元! 未来价格可能会上涨。请阅读下面的描述!
介绍 Ultimate Dynamic Levels - Ultimate Sniper Dashboard的最佳入场指标! 极低风险的及时进场和高RR!!
在这里找到终极狙击手仪表板。 对于初学者和职业交易者来说,最重要的能力是准确判断市场最可能转向的位置和时间,以及如何安全进入并获利退出。
终极动态水平指标很容易告诉你市场转折的最高可能性在哪里,这样你就可以自信地进入一个极低风险的交易,同时保持你的图表干净和简单,同时赚取美元!
终极动态水平指标有一个独特而强大的算法,可以同时在多个时间框架上找到重要的隐藏水平。它实在是太神奇了,而且永远不会像其他典型的SR指标那样重绘或重新绘制水平线! 终极动态水平指标还在图表的右侧有一个水平强度简介,以显示该水平在最近的历史上是否强劲。一个强大的奖励组合!!!。
终极动态水平指标有3个非常重要的功能。
1. 帮助你进入趋势方向的低风险交易。 2. 2.使你保持在趋势中,只要移动仍在进行。 3. 3.作为追踪止损,保护你的收益,避免把钱留在桌上! 强
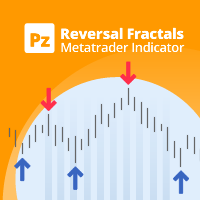
这是我著名的指标反转分形的最新版本,该指标在近十年前首次发布。它检查分形的价格结构以确定市场中可能的反转点,为已经拥有基本或技术估值模型的头寸交易者提供时机。 [ 安装指南 | 更新指南 | 故障排除 | 常见问题 | 所有产品 ] 反转分形可以开始长期趋势 指标不重绘
它实现了各种警报 可定制的颜色和尺寸 该指标是一个反应或滞后信号,因为分形是奇数条柱的形成,中间的柱是最高或最低的,并且当分形中的所有柱关闭时,指标绘制。但是,具有预先存在的方向偏差的交易者会发现该指标非常有用,可以提早进入点。 该指标不是简化的信号指标,也不是完整的交易系统。请不要这样评估或审查它。
输入参数 分形中的条:每个分形中的条数。必须是奇数,例如 3, 5, 7, 9, 11, 13, ...
最大历史柱线:指标加载时要评估的过去柱线的数量。
颜色:自定义箭头和线条的颜色和大小。 警报:启用或禁用各种警报。
支持 我很乐意提供免费产品,但由于我的时间有限,它们没有任何形式的支持。我很抱歉。
作者 Arturo López Pérez,私人投资者和投机者、软件工程师和 Point Zero Tradi

此指标适用于实时图表,不适用于测试器。 PRO Trend Divergence 指标是一款先进的技术分析工具,专注于检测 趋势延续背离 ,这是一种表明当前趋势可能会持续的信号。与传统指标强调趋势反转不同,这款工具帮助交易者识别趋势依然强劲的市场状态,即使在短暂回调或小幅调整时也是如此。 趋势延续背离 出现在价格沿趋势方向移动时(上升趋势中的更高低点或下降趋势中的更低高点),但所选指标却出现背离,确认趋势可能继续。 PRO Trend Divergence 指标使交易者能够自信地跟随趋势,减少过早退出的风险。 特点与优势 多指标支持
支持 MACD、RSI、Stochastic、CCI、Momentum、OBV、VW-MACD、CMF 和 MFI。 图表上的可视信号
显示背离线条,并支持颜色和样式的自定义。 关键枢轴点集成
利用关键的高点和低点来优化信号,减少噪音。 灵活高效
提供信号确认、筛选和时间周期选择的自定义参数。

趋势线图指标是趋势筛选器指标的插件。它用作趋势筛选器(趋势线信号)生成的所有信号的扫描仪。
它是基于趋势筛选器指标的趋势线扫描仪。如果您没有 Trend Screener Pro Indicator ,Trend Line Map Pro 将无法使用。
通过访问我们的 MQL5 博客,您可以下载趋势线图指标的免费版本。购买前试用,不受 Metatrader Tester 限制。 : 点击这里
1. 容易获得的优势 根据货币和时间范围显示买入和卖出信号。 评估自图表中出现箭头以来价格上涨或下跌的点数。 (趋势筛选指标箭头) 显示信号的时序。 获取多时间范围和多货币警报以购买和出售警报。
2. 如何使用趋势线图 如何显示买卖信号仪表板?
如果您有任何问题或需要帮助,请通过私信联系我。
作者 SAYADI ACHREF,金融科技软件工程师,Finansya 创始人。

Volatility Trend System - a trading system that gives signals for entries. The volatility system gives linear and point signals in the direction of the trend, as well as signals to exit it, without redrawing and delays.
The trend indicator monitors the direction of the medium-term trend, shows the direction and its change. The signal indicator is based on changes in volatility and shows market entries.
The indicator is equipped with several types of alerts. Can be applied to various trading ins

趋势振荡器:平稳可靠的市场趋势识别 趋势振荡器是一款先进的 MT4 指标,旨在帮助交易者准确识别趋势方向和潜在的反转点。借助直观的视觉呈现,该指标清晰地显示市场处于上升趋势还是下降趋势,从而简化分析并提高图表的可读性。适用于多种市场和时间框架,提供了极大的灵活性以满足不同的交易需求。 趋势振荡器的主要特性和优势 简化的趋势可视化 :趋势振荡器通过颜色变化的线条图形化地展示趋势运动以指示市场方向。蓝色表示上升趋势,黄色表示下降趋势,提供了即时且清晰的趋势读取。 可靠的反转信号 :通过先进算法,指标会生成代表可能反转点的彩色箭头。绿色箭头表示潜在的买入点,而红色箭头表示潜在的卖出点,帮助交易者识别评估进场或出场的关键区域。 适用于任何市场和时间框架 :趋势振荡器在任何市场和不同的时间框架下都能有效运行,提供了适用于所有交易条件的灵活性和多样性。 用户友好,易于使用 :该指标专为易用性而设计,即使是初学者也可以轻松使用。重要信息直接显示在图表上,使得分析更加轻松和即时。 适用于不同的交易风格 :无论您采用的是剥头皮还是短期交易策略,趋势振荡器都能在不同的市场条件下提供支持,适应不同的交易风格

该指标显示当前交易品种的盈利(亏损)。 您可以自由拖放线条来显示当前的盈利或亏损。
参数 Calculation in money or in points — 以点数或货币计算利润/损失。 Add pending orders to calculate — 在计算中考虑挂单。 Magic Number (0 - all orders on symbol) — 幻数,如果需要评估特定订单。 Offset for first drawing (points from the average price) — 线距第一次开始时的平均价格的偏移量。 Decimal places for calculating the Sum — 显示总和的小数点后的位数。 Decimal places for calculating the Percentage — 显示百分比的小数点后的位数。
Tuning 调音 Color of the profit line — 利润线的颜色。 Color of the loss line — 损失线的颜色。 Line style — 线条样式。 Line
FREE
Special offer : ALL TOOLS , just $35 each! New tools will be $30 for the first week or the first 3 purchases ! Trading Tools Channel on MQL5 : Join my MQL5 channel to update the latest news from me Supply Demand Retest and Break Multi Timeframe ,此工具基于强劲的动量蜡烛绘制供需区,允许您使用 timeframe selector 功能在多个时间框架中识别这些区域。通过重新测试和突破标签,以及可自定义的验证和样式选项,此工具支持有效的交易分析。 查看更多 MT5 版本请访问: Supply Demand Retest and Break MT5 Multi Timeframe 查看更多产品请访问: All Products 主要功能 灵活的时间框架选择: 利用时间框架选择器,根据您的交易需求在不同的时

It identifies the pivot, support, and resistance price levels of the selected timeframe and then draws lines onto the chart. FEATURES: Option to specify the Timeframe Period in the PivotSR calculation. Option to display the PivotSR of the last candle, of every candle, or of the current candle. Options for displaying labels, line thickness, and line color. PivotSR can be interpreted as reversal levels or past price reactions that can be used as the basis for current price analysis. Some traders b
FREE

Fibonacci Sniper MT4 - No Repaint
Features:
- Indicator sends signals and notifications on key Fibonacci Retracement and Fibonacci Extensions Levels
- Once the buy/sell signal is set, targets ( TP1 TP2 TP3 )and stop loss levels are drawn by the indicator.
- Fibonacci Calculations and Custom Patterns are identified by the last 3 or 5 Zig Zag exterum.
- You can easily identify key harmonic patterns like Gartley, Bat, Butterfly and Crab patterns.
Important Settings: - Choose the Zig Zag Set
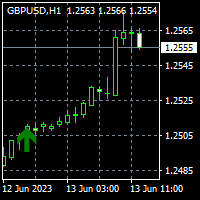
To get access to MT5 version please click here . This is the exact conversion from TradingView: "UT Bot Alerts" by "QuantNomad". The screenshot shows 95% similar results from tradingview and Metatrader when tested on ICMarkets on both platforms. It should be 100%. However I realized there are small difference between quotes even if brokers are the same. This is strange... I think the indicator logic is very data dependent. I have done quite a lot of conversions from tradingview and do not see an

The latest version of Indicator is fully integrated into an all-in-one package, including: Fair Value Gaps (FVG). See more => How to trade with FVG Implied Fair Value Gap (IFVG). See more => How to trade with IFVG OrderBlock (OB). See more => How to trade with OrderBlock The options in the settings section are relatively easy to navigate, and you can even use them right away upon activation without encountering difficulties when using the default configuration. The indicator utilizes an al

完整的外汇市场视图仪表板指示器
这是一个自定义指标,旨在让交易者全面了解市场上正在发生的事情。 它使用实时数据访问市场并显示成功交易所需的每一点信息。
安装:
在将此指标附加到您的窗口图表之前,请转到您的 MT4 的市场观察面板并隐藏所有您不需要或交易的货币对,并将其余货币对留在那里。 原因是 FFMV 仪表板将显示出现在 MT4 市场观察中的所有货币对。 它最多可以显示 30 个或更少的货币对。 如果它超过您 MT4 的市场观察中的那个,它会模糊和毁坏 FFMV 仪表盘上的字体和图像! 它不会正确显示。
用法:
单人交易
对于篮子交易(见截图如何)
也可用于多单交易
确认从您自己的交易系统等收到的信号的有效性。
成分:
时间范围:从 M1 到 MN1 当前蜡烛状态(买入/卖出
趋势:币种整体走势
影响:货币变动的幅度/波动性,见下文:
建立:货币正在建立
好:货币越来越严重
高:币值值得关注
强:要考虑方向
非常强:这种货币近乎完美
优秀:

如果你象这个项目一样,就有5个饥饿审查。 这项指标采用了既定价格的公开、高、低价和关闭价格
可以对特定时间区加以调整。 许多机构和专业人士都认为这些是重要的。
贸易商可以为你了解他们可能更进一步的地点,
积极。 现有期间为: 前一日。 前一星期。 曾任Month。 曾任。 前一年。 或: 目前日。 目前周。 目前 Month。 目前配额。 今年。
FREE

Fair Value Gap (FVG) Indicator for MetaTrader 4 – Download and Guide Introduction Traders rely on a variety of tools and strategies to discover profitable investment opportunities. Among these, the Fair Value Gap (FVG) indicator in MetaTrader 4 stands out as a highly effective tool. An FVG represents a price gap within the market structure where supply and demand are not balanced. These gaps emerge during sharp price movements. In simple terms, when three candlesticks form, the gap between the f
FREE

Supply Demand Zone Pro Indicator works with all products and timeframes. It is using a new calculation method, and now you can select the desired zone on any timeframe! Strongest Zones are already enabled by default This is a great advantage in trading.This indicator has a built in backtester enabled by default, just move the chart.
Supply and Demand ?
Supply is a price zone where sellers outnumbered buyers and drove the price lower. Demand is a price zone where buyers outnumbers sellers and dr
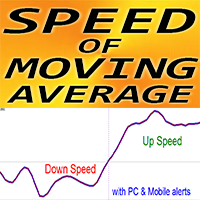
Crypto_Forex 指标“MA Speed”适用于 MT4,无需重绘。
移动平均线速度 - 是一种独特的趋势指标。
- 该指标的计算基于物理方程。 - 速度是移动平均线的一阶导数。 - MA 速度指标显示 MA 本身改变方向的速度。 - 有很多机会使用 MA Speed 升级标准策略。适用于 SMA、EMA、SMMA 和 LWMA。 - 建议在趋势策略中使用 MA Speed,如果指标值 < 0:趋势下降;如果指标值 > 0:趋势上升。 - 时间范围 - 任意;交易对 - 任意。 - 指标具有内置移动和 PC 警报。
参数(设置非常简单): 1) 速度周期。建议值为 3 到 7。速度周期较低时,指标的灵敏度增加,反之亦然。 2) MA 周期(将计算此 MA 的速度)。 3) MA 方法:SMA、EMA、SMMA、LWMA。 4) MA 应用价格(7 个选项)。
// 出色的交易机器人和指标可在此处获取: https://www.mql5.com/en/users/def1380/seller 这是仅在此 MQL5 网站上提供的原创产品。
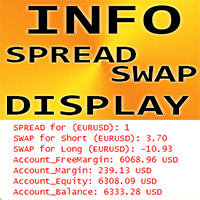
外汇指标“INFO 价差掉期显示”适用于 MT4,交易辅助工具。
- INFO 价差掉期显示指标显示其所附外汇对的当前价差和掉期。 - 它还显示账户余额、净值和保证金。 - 可以将指标值定位在图表的任何角落: 0 - 左上角,1 - 右上角,2 - 左下角,3 - 右下角。 - 也可以设置颜色和字体大小。 .................................................................................................................... // 更多出色的专家顾问和指标可在此处获得: https://www.mql5.com/en/users/def1380/seller 这是仅在此 MQL5 网站上提供的原创产品。

Renko, Heiken Ashi, Ticks Bar, Range Bar. Easy switching, easy setup, all in one window. Place the Custom Chart indicator and view Renko, Heiken Ashi, Tick bar, Range bar charts in real time at real chart. Position the offline chart window so that the indicator control panel is visible. Switch the chart mode by click of a button. Connect to the output chart any indicator, expert advisor without any restrictions. No, it doesn't work in the tester. Yes, you can use an

The indicator identifies divergence by analyzing the slopes of lines connecting price and MACD histogram peaks or troughs. Bullish Divergence (Convergence): Occurs when the lines connecting MACD troughs and corresponding price troughs have opposite slopes and are converging. Bearish Divergence: Occurs when the lines connecting MACD peaks and corresponding price peaks have opposite slopes and are diverging. When a divergence signal is detected, the indicator marks the chart with dots at the pric
MetaTrader市场是 出售自动交易和技术指标的最好地方。
您只需要以一个有吸引力的设计和良好的描述为MetaTrader平台开发应用程序。我们将为您解释如何在市场发布您的产品将它提供给数以百万计的MetaTrader用户。
您错过了交易机会:
- 免费交易应用程序
- 8,000+信号可供复制
- 探索金融市场的经济新闻
注册
登录