Indicadores técnicos para MetaTrader 4 - 13
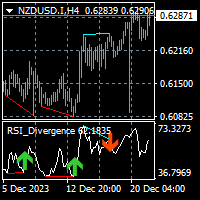
The indicator shows/alerts divergences of RSI indicator. note: You can check the free EA here that utilizes this indicator. repaint and lag issue Divergence indicators are usually repaint and lagging in their nature. You may have experienced in trading when you see a divergence on chart but the divergence continues further or just disappear. pivots_period input The smaller this value is the more and faster signals are generated. The greater this value you will have less and late signals. displa
FREE

Super trend is one of the best trend indicators in metatrader 4 (MT4). Triple SuperTrend indicator is an indicator that consist of three super trend indicator that can be aranged. This indicator is built by mql4 language and doesn't provided by MT4 platform. Highly recommended using EMA SuperTrend Strategy Indicator if you want to get better result in here:
https://www.mql5.com/en/market/product/91664
This indicator is easy to use, power full and has many benefits, there are: Using three indic
FREE
The indicator highlights the value in "over Sold" and "over Bought" zones. in addition, arrow indicates the return of the value from the extreme zone. Indicator can be easily customized by the user including change of colors, with, levels and arrows. Combination with other market signals and analysis is necessary and provides more stable results. Alert is also available for user.
FREE

Full Stochastic - is Stochastic Oscillator which displays all three essential lines: %K Slow K %D Standard Stochastic Oscillators displays only Slow K and %D.
Why it is important to analyze all three lines in SO? Standard SO users must choose if they want to use fast or slow SO. In case of fast SO traders set the slowing parameter typically to 1 or 2, or if they want to use slow SO, they set the slowing parameter usually to 3 or more. With Full Stochastic you can have both!
Full Stochastic Par
FREE

PinBar Hunter – Smart Pin Bar Indicator with Built-in Control Panel and Signal Filters PinBar Hunter is a powerful tool for technical traders that automatically detects classic Pin Bar patterns (reversal candles) on the chart.
It’s designed for price action strategies, candlestick analysis, and trading around key support/resistance levels. Indicator Features: Detects classic Pin Bars (reversal candlestick patterns)
Works on any timeframe and instrument
Suitable for trend-following an

Overview Inspired by Tradingview’s falconCoin, The Market Cipher indicator is a momentum oscillator used to detect overbought/oversold conditions and potential trend reversals. Traders can also use it to spot divergences between price action and momentum for early entry or exit signals. Configuration Guide Core Indicator Settings The indicator calculates momentum using a short-term and a longer-term average. Momentum is plotted as a wave oscillating between overbought and oversold thresholds. Ov
FREE

MT4 Candlestick Pattern Alert Indicator: Stay Ahead of Trading Opportunities Overview The MT4 Candlestick Pattern Alert Indicator is a robust tool designed to empower traders by detecting candlestick patterns and delivering timely alerts through notifications, emails, and pop-up alerts. This invaluable tool saves traders precious time, allowing focused analysis on patterns and potential profitable trades. Importance of Candlestick Patterns Candlestick patterns are pivotal in technical analysis,
FREE

El indicador analiza la estructura de precios de los fractales e identifica posibles puntos de inversión de la dinámica del mercado. Perfecto cuando se usa en combinación con otros tipos de indicadores.
Ventajas:
Funciona en todos los instrumentos y series temporales, No vuelve a dibujar sus resultados, Colores personalizables de los elementos indicadores, Funciona bien con cualquier estrategia de tendencias Ajustando la fuerza de los fractales. MT5 version -> HERE / Our news -> HERE
Strateg
FREE

本指标 基于 Zigzag 基础上... 增加了: 1.增加了箭头指示,使图表更鲜明 2.增加了价格显示,使大家更清楚的看清价格. 3.增加了报警等设置,可以支持邮件发送 原指标特性: 1.基本的波段指标构型. 2.最近的2个ZIGZAG点不具有稳定性,随着行情而改变,(就是网友所说的未来函数) 3.原指标适合分析历史拐点,波段特性,对于价格波动有一定的指导性.
Zigzag的使用方法一 丈量一段行情的起点和终点 (1)用ZigZag标注的折点作为起点和终点之后,行情的走势方向就被确立了(空头趋势); (2)根据道氏理论的逻辑,行情会按照波峰浪谷的锯齿形运行,行情确立之后会走回撤行情,回撤的过程中ZigZag会再次形成折点,就是回撤点; (3)在回撤点选择机会进场,等待行情再次启动,止损可以放到回撤的高点。 一套交易系统基本的框架就建立起来了。 Zigzag的使用方法二 作为画趋势线的连接点 趋势线是很常见的技术指标,在技术分析中被广泛地使用。 但一直以来趋势线在实战中都存在一个BUG,那就是难以保证划线的一致性。 在图表上有很多的高低点,到底该连接哪一个呢?不同的书上画趋势线的方法
FREE

This indicator is SO SIMPLE… when the green Rise Coming arrow appears, a price drop may be on the way! Plain and easy profits! As you receive more than one 'Rise Coming' text signal in a downtrend, it means momentum is building larger for a bull run. HOW TO USE 1. When the green "Rise Coming" text appears, a price jump may be on the way! This indicator Never Repaints! To get the best setting it's a matter of tweaking the indicator until it gives you the best results. Our recommendation, and what
Precision Trading with Advanced Market Analysis! Gain an edge in forex trading with a comprehensive analysis suite that helps you categorize volatility, estimate swing lengths, and make data-driven decisions based on historical market behavior. Key Features: Advanced Swing Detection
Customize sensitivity to price movements by defining minimum bars and price shifts required for a new swing.
Tailor it to your trading style for precise trend identification. Volatility Analysis
FREE

Este indicador de marco de tiempo múltiple y símbolo múltiple identifica formaciones superiores / inferiores dobles o triples o una ruptura del escote siguiente (superior / inferior confirmada). Ofrece filtros RSI, pin bar, envolvente, pinzas, estrella matutina / vespertina, así como opciones de filtro de divergencia MACD, Awesome (AO) o RSI que permiten filtrar solo las configuraciones más fuertes. El indicador también se puede utilizar en modo de gráfico único. Lea más sobre esta opción
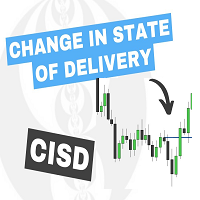
The Change In State Of Delivery (CISD) indicator detects and displays Change in State Of Delivery, a concept related to market structures.
Users can choose between two different CISD detection methods. Various filtering options are also included to filter out less significant CISDs.
USAGE Figure 2 A Change in State of Delivery (CISD) is a concept closely related to market structures, where price breaks a level of interest, confirming trends and their continuations from the resulting

Bitcoin 999 - is a trend indicator that automatically analyzes the market and provides information about the trend and each of its changes, as well as giving signals for entering trades without redrawing! The indicator uses each candle, analyzing them separately. referring to different impulses - up or down impulse. Exact entry points into transactions for currencies, crypto, metals, stocks, indices!
Main functions: Accurate entry signals WITHOUT REPAINTING! Once a signal appears, it remains
FREE

El indicador muestra cualquier texto e imagen en el gráfico, y también puede mostrar información solicitada por macros. Hay tres bloques de texto y un bloque para imágenes. Se puede seleccionar la fuente, el tamaño, el color, la sangría y la posición. Si desea marcar sus capturas de pantalla o mostrar la información requerida en un gráfico, UPD1 Watermark será una herramienta muy útil.
Descripción de los ajustes.
Ajustes de texto (3 bloques). Text 1, 2, 3 – introducir texto y, o macro. Font N
FREE
Magic Supply Demand Indicator works on all products and timeframes. It is a new formula, and the very new features are two zone strength functions adjustable by user input! This is a great advantage in trading. When you learn how to use the proprietary features such as the zone strength with min X-factor of price travel away, you will be able to tell whether the zone is strong or not.
The supply and demand zones are used as an alert trigger. You can use popup alert with sound on MetaTra
FREE

L'indicatore Go Trend è un indicatore personalizzato per MetaTrader 4 (MT4) basato su una logica di ZigZag con tre livelli di periodi diversi.
Questo indicatore è progettato per identificare i punti di inversione del prezzo (massimi e minimi) su diversi timeframe, aiutando i trader a individuare potenziali trend e punti di ingresso/uscita nel mercato.
Funzionalità Principali Identificazione dei Punti di Inversione (ZigZag) L'indicatore utilizza una logica di ZigZag per tracciare linee che coll
FREE

Are you tired of drawing trendlines every time you're analyzing charts? Or perhaps you would like more consistency in your technical analysis. Then this is for you. This indicator will draw trend lines automatically when dropped on a chart. How it works Works similar to standard deviation channel found on mt4 and mt5. It has 2 parameters: 1. Starting Bar 2. Number of bars for calculation The starting bar is the bar which drawing of the trend lines will begin, while the number of bars for c
FREE
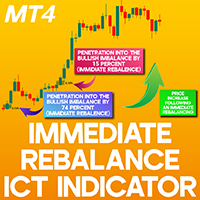
Immediate Rebalance ICT Indicator for MT4 The Immediate Rebalance Indicator for MetaTrader 4 is built to identify and emphasize instant price equilibrium levels. In ICT trading strategies, price balance is a crucial factor, and imbalances arise when a sequence of three candles leaves a gap between the wicks of the first and third candles, indicating a disruption in supply and demand dynamics. When the third candle promptly fills this gap by making contact with the wick of the first candle, it cr
FREE
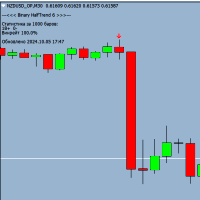
Binary HalfTrend 6 es un poderoso indicador de tendencias diseñado para el comercio de opciones binarias, que proporciona señales precisas de compra y venta. La fecha de vencimiento es de solo 1 vela, puede operar en cualquier período de tiempo. El indicador Binary HalfTrend 6 analiza las tendencias del mercado y genera señales confiables en forma de flechas en el gráfico para realizar operaciones rentables. Antes de usarlo en operaciones reales, recomiendo probarlo en una cuenta de demostració
FREE

The Missing Edge You Need To Catch Breakouts Like A Pro. Follow a step-by-step system that detects the most powerful breakouts!
Discover market patterns that generate massive rewards based on a proven and tested strategy.
Unlock Your Serious Edge
Important information here www.mql5.com/en/blogs/post/723208
The Reliable Expert Advisor Version
Automate Breakout EDGE signals using "EA Breakout EDGE" Click Here Have access to the game changing strategy that will take your trading to the next l

¡Compra Trend Swing y podrías obtener otro indicador llamado Análisis de Mercado GRATIS como BONO! Contáctanos en privado para obtener tus instrucciones privadas y tu BONO. PROMO: $49 durante 48 horas para celebrar el lanzamiento oficial. El precio siguiente será de $89. (termina el jueves 11 a las 23:59, hora E.T). Trend Swing es un indicador profesional desarrollado desde cero por nuestro equipo interno. Este indicador es muy sofisticado porque puedes ver los niveles de precio de entrad

Break It Down is based on the Directional Movement Index and tells the trader when a market trend probably maxed out and ready to fall back. This pattern is more predictable when we apply this system only when the market is rallying but within a trading range. Because traders Sell off in fear the market often moves faster when declining! When this happens, good moves can occur. As traders are no longer interested in the trend, the volume will decline and the price will usually fall back on itsel
FREE
Super Trend is one of the most popular custom indicators that it doesn't provided in metatrader 4 (MT4) platform. Rainbow SuperTrend has some advantages, there are can display the trend direction and stop loss line based on Average True Range (ATR). This indicator is good to used for trailing stop trading style, because when the price direction is trending the stop loss point can adjust based on supertrend line. It is the high recommended to using this indicator combined with oscillator indicat
FREE
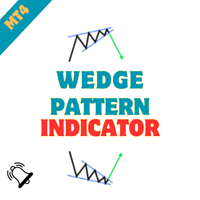
Wedge Chart Pattern Indicator - Unleash the Power of Wedge Patterns in Your Trading Embark on a journey of precision trading with the "Wedge Chart Pattern Indicator." Crafted for MetaTrader, this advanced tool is your ultimate companion for identifying wedge chart patterns, empowering you to make informed and strategic trading decisions. Whether you're a seasoned trader or just starting, this indicator simplifies the process of spotting wedge patterns, providing you with a valuable edge in the m
FREE
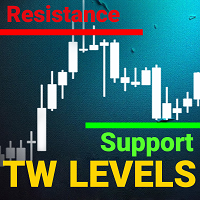
support resistance levels indicator mt4:
Esta herramienta es un indicador de múltiples marcos temporales que identifica y traza líneas de soporte y resistencia, así como niveles de Fibonacci, en un gráfico con la misma precisión que el ojo humano. Los niveles de soporte y resistencia TW para forex tienen un algoritmo complejo que escanea el gráfico para identificar niveles anteriores de estabilización del precio y rebotes, registrando el número de toques.
¿Está cansado de dibujar manualment

Indicador que muestra la hora de los principales mercados comerciales del mundo. Asimismo, muestra la sesión actual. Es muy sencillo de utilizar. Apenas ocupa espacio en el gráfico. Se puede utilizar junto con asesores y otros paneles, tales como VirtualTradePad . Versión con representación analógica del reloj en el gráfico.
Otras características: En los parámetros de entrada de las opciones se dispone de: Mostrar/Ocultar pistas al poner encima el cursor, así como la lengua de las pistas Engl
FREE

This indicator is an original view on volumes. It is known that volumes show the amount of buyers and sellers for a certain period of time. A candle is used a period of time. Volumes at a candle High show the buyers. Volumes at a candle Low show the sellers. A candle Open shows the Delta. Delta indicates who was dominant on a given candle, buyers or sellers.
Input parameters Distance - distance of the volumes text from High and Low. Font size - text font size. The indicator provides levels that
FREE
This is a combine that combines the ATR, Candle Timer, Watermark indicators and a tool for working with graphical objects, which allows you to reduce the time for marking charts. Functionality: Levels and proteins with price tags; drawing strictly horizontal levels; continuous zigzag manually; expansion / truncation of lines, wrinkles; quick change of colors and fonts and shapes; Filling/removing the filling of vessels, triangles, ellipses; dragging by 1 (first) point and auto alignment of the h
FREE

An imbalance bar or candle, also called a fair value gap (FVG) or inefficiency, shows strong buying or selling in the market or weak buying or selling that causes prices to move quickly with high momentum. This is why it's an important part of price action analysis. Our indicator offers three main benefits: Clear Design: The imbalance bar is built into the candle with a simple, clean look that makes it easy for traders to spot while keeping the chart tidy. Easy to Use: A hotkey lets traders quic
FREE

Recommended on M15 and higher timeframes
Sends alerts and notifications when the zone is create
Sends alerts and notifications if zones are retested
You will see the trading zones and identify the most profitable points to open positions. The indicator marks the supply and demand zones.
With this show you will now make profitable trades that will set the trends.
Shows all support and resistance zones.
Can work in all time zones.
No need to mess with complicated settings, all settings are
FREE

ADX Channel is an indicator that plots the channel depending on the values of the ADX (Average Directional Movement Index) indicator. The resulting channel is a little similar to the Envelopes, but its lines depend on the market volatility. The sell trade is usually executed fast when the price touches and bounces from the upper line of the channel, buy - from the lower. It is recommended to trade when there is no significant news. The recommended timeframes: M5 - H1. The indicator is not design
FREE

The Heikin Ashi indicator is our version of the Heikin Ashi chart. Unlike competitor products, this indicator offers extensive options for calculating Heikin Ashi candles. In addition, it can be displayed as a classic or smoothed version.
The indicator can calculate Heikin Ashi with moving average by four methods: SMA - Simple Moving Average SMMA - Smoothed Moving Average EMA - Exponential Moving Average LWMA - Linear Weighted Moving Average
Main features The indicator shows Heikin As
FREE

Important notice! This indicator does not automatically select waves. This is your job.
Features: calculate risk calculate position size mark Elliott waves mark Fibonacci levels change object parameters
Input parameters: Keyboard shortcuts - enable/disable keyboard shortcuts External capital - fill in if you do not keep all your capital in broker account. The risk will be calculated from the sum of the broker account and external capital. Select object after create - if true, then every create
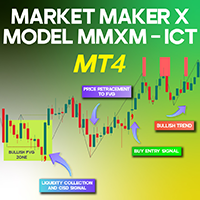
Market Maker X Model MMXM ICT MT4 The Market Maker X Model (MMXM) Indicator is a strategic tool designed to detect key price movement areas. It automatically identifies Fair Value Gaps (FVGs) from higher timeframes and plots them on the chart. Additionally, it marks Buy-Side Liquidity (BSL) and Sell-Side Liquidity (SSL) within these zones using dashed lines. When the price moves beyond these dashed lines and liquidity is absorbed, the indicator signals a Change of Character (CHoCH) or CISD , vis
FREE
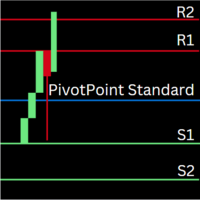
Pivot Point Indicator for MetaTrader 4 (MT4) Overview The Pivot Point Indicator calculates daily, weekly, and monthly pivot points and plots key support and resistance levels on your charts. This indicator helps traders identify potential reversal points and key areas of interest for price action, making it a valuable tool for both short-term and long-term trading strategies. Key Features Daily, Weekly, and Monthly Pivot Points : Easily switch between daily, weekly, and monthly pivot points by a
FREE

A forex pivot point strategy could very well be a trader’s best friend as far as identifying levels to develop a bias, place stops and identify potential profit targets for a trade. Pivot points have been a go-to for traders for decades. The basis of pivot points is such that price will often move relative to a previous limit, and unless an outside force causes the price to do so, price should stop near a prior extreme. Pivot point trading strategies vary which makes it a versatile tool for
FREE

BreakEven PRO line– Encuentra tu punto de equilibrio visualmente en cada operación ¿Te has preguntado cuál es el precio exacto donde tus operaciones abiertas se equilibran y no hay ganancia ni pérdida?
BreakEven PRO line es un indicador visual diseñado para traders que gestionan múltiples posiciones. Muestra automáticamente una línea horizontal en el gráfico con el precio promedio de breakeven (punto de equilibrio) para tus órdenes BUY y SELL , y lo etiqueta con el valor exacto en tiempo real. I
FREE
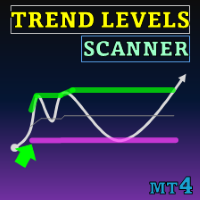
Special offer : ALL TOOLS , just $35 each! New tools will be $30 for the first week or the first 3 purchases ! Trading Tools Channel on MQL5 : Join my MQL5 channel to update the latest news from me El indicador Niveles de Tendencia (Trend Levels) está meticulosamente diseñado para identificar niveles de tendencia críticos — Alto, Medio y Bajo — durante los movimientos del mercado. Con cálculos en tiempo real basados en los valores más altos, más bajos y de nivel medio a lo largo de

Time Session OPEN-HIGH-LOW-CLOSE This Indicator Will Draw Lines Of OHLC Levels Of Time Session Defined By User. It Will Plot Floating Lines On Current Day Chart. Time Session Can Of Current Day Or Previous Day. You Can Plot Multiple Session Lines By Giving Unique ID To Each Session. It Can Even Show Historical Levels Of Time Session Selected By User On Chart To Do Backdating Test. You Can Write Text To Describe The Lines.
FREE
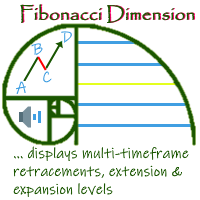
'Fibonacci Dimension' indicator allows display of preset or user-defined multi-timeframe Fibonacci levels. It automatically takes the previous high and low for two user-defined timeframes and calculates their Fibonacci retracement levels. It also considers the retraced level to draw the expansions on every change of price. A complete visual dimension in multiple timeframes allows deriving profitable strategies for execution. Enhanced functionality to view and customize the default Fibonacci Rang
FREE

Market Heartbeat in your hand! Introduction The Market Heartbeat indicator with a special enhanced algorithm (volume, money flow, cycle of market and a secret value) is a very repetitive trend finder with a high success rate . Interestingly, this Winner indicator indicates that the trend has changed its direction or the end of a trend retracement or even appears at the range market. The Market Heartbeat can use in scalping trading or trend trading. It finds immediately with alarm, notification a
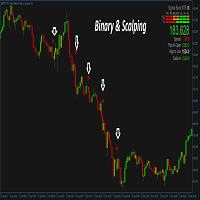
This is a trend following system for Binary options traders and forex scalpers. It is carefully crafted and recognizes periods of strong trends in the market and gives the trader the advantage and opportunity of riding with the momentum. It works on all timeframes and currency pairs especially high liquidity pairs. Avoid news events 15mins before and after. Always have your money management script or system in place. Tested on Deriv synthetics as well, please check screenshots. MT5 version can b
Overview
Discover a powerful yet simple indicator to identify market trends effectively! Awesome Moving Average (AWMA) is designed to detect bullish or bearish trends by analyzing price breakouts beyond the moving average line. Basically, the way this indicator works is similar to the Moving Average indicator available on the MetaTrader platform. As we know, the Moving Average indicator tends to be difficult to use when the market is in a sideways condition because it often gives false breakou
FREE

Trend Plus Trendplus Indicator Time Frame: Suitable for any time frame. Purpose: Trend Prediction. Blue and red candle indicate the buy and sell call respectively. Buy: When the blue candle is formed buy call is initiated. close the buy trades when the next red candle will formed. Sell: When the Red candle is formed Sell call is initiated. close the Sell trades when the next blue candle will formed. Happy trade!!
FREE

Flow Trend Flow trend is designed to detect the market trend with special calculation and a combination of Bolinger band and statistical moving period
to detect the market trend without frequency change and fault.
This indicator is designed with simple parameters to use fast and easy and helpful tools to trade in a pure direction and set your SL/TP with this indicator cloud system.
FREE
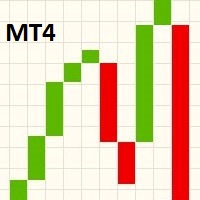
Este indicador muestra el gráfico de ruptura de línea en la ventana principal del gráfico. Para ver el gráfico de ruptura de línea separadamente, cambie la vista del gráfico principal para la muestra en forma de la línea, luego cambie el color de la línea por «None» (no hay) en las propiedades del gráfico que se abren con el botón F8. Al usar el scrolling, escalamiento o al cambiar el símbolo/período del gráfico, el indicador cambiará el tamaño de los bloques en el siguiente tick para que quepan
FREE
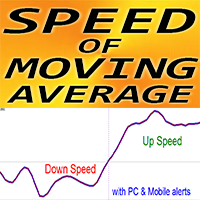
Indicador Crypto_Forex "MA Speed" para MT4, sin repintado.
VELOCIDAD de la media móvil: es un indicador de tendencia único.
- El cálculo de este indicador se basa en ecuaciones de la física. - La velocidad es la primera derivada de la media móvil. - El indicador MA Speed muestra la rapidez con la que la propia MA cambia su dirección. - Hay muchas oportunidades para mejorar incluso las estrategias estándar con MA Speed. Es adecuado para SMA, EMA, SMMA y LWMA. - Se recomienda utilizar MA Spee

Este indicador de panel de divergencia de múltiples marcos de tiempo y múltiples símbolos envía una alerta cuando se han identificado una o dos divergencias diferentes en varios marcos de tiempo y no en divergencias individuales. Se puede utilizar con todos los marcos de tiempo desde M5 hasta MN. Es posible habilitar la media móvil o el filtro de tendencia RSI para filtrar solo las configuraciones más fuertes. Combinado con sus propias reglas y técnicas, este indicador le permitirá crear (o mejo

Peak Trough Analysis is the great tool to detect peaks and troughs in your chart. Peak Trough Analysis tool can use three different peaks and troughs detection algorithm. The three algorithm include the orignal Fractals Indicator by Bill Williams, the Modified Fractals indicator and ZigZag indicator. You can use this peak and trough analysis tool to detect the price pattern made up from Equilibrium Fractal-Wave process. For further usage, there are good guide line on how to use this peak trough
FREE

Use the indicator only in retest zones The newly formed zone should be used for scalping only New zones are repainted or recalculated When supports and resistances are violated, they are deleted as they no longer function. Recommended on M30 and higher timeframes You will see the trading zones and identify the most profitable points to open positions. The indicator marks the supply and demand zones. With this show you will now make profitable trades that will set the trends. Shows all support a
FREE

No Repaint Bext es un sistema de trading completo. Indica cuándo abrir y cerrar operaciones, así como la dirección de la operación. Cada vez que aparece una flecha verde, debes abrir una operación de compra. Cerramos todas las operaciones de compra cuando aparece una flecha roja. De la misma manera, cada vez que aparece una flecha roja, abrimos operaciones de venta y las cerramos todas cuando aparece una flecha verde. Para operar, utilizamos el marco temporal M5. Se puede operar en cualquier par

Round Numbers Levels indicator for MT4 Round Numbers indicator is a simple but useful indicator to draw 00 and 50 price levels in your chart.
These levels act as supports and resistances, and therefore should be taken into account when trading.
These levels can be used as profit targets or entry points.
Inputs of the indicator are:
TGridColor00: color to be used for xx00 levels GridStyle00: line style to be used for xx00 levels GridWidth00: line width to be used for xx00 levels GridColor50:
FREE

El indicador muestra dos pares diferentes en un gráfico, diseñado para simplificar la información mostrada.
Capaz de trabajar con casi todos los instrumentos disponibles en el terminal (no sólo pares de divisas, sino también metales y materias primas). Característica de utilizar un método de correlación visual para cualquier par de divisas. Subsímbolo. El par de divisas se muestra en la pantalla con velas de colores. Este es el mismo par correlacionado. Reflejo. Moneda auxiliar. El indicador
FREE
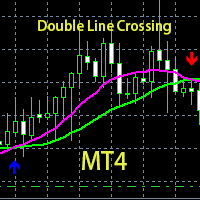
his is a custom indicator based on double-average crossing and arrow marking.
Make multiple lists when blue arrows appear up.
Make a blank list when the red arrow appears down.
When the pink line crosses the green line upwards, the pink line is above, the green line is below, the golden fork appears, and the blue arrow appears.
When the pink line crosses down through the green line, the pink line is below, the green line is above, a dead fork appears, and a red arrow appears.
This is a good
FREE

The Signal Strength Meter is a Multi-Currency, Dual Timeframe Interactive Indicator, which calculates the strength of buy and sell signals, and displays a score for each symbol on a display board. Get a 7-Day Free Trial Version: Click Here (Full Access to The Indicator for 7 Days) Check Video Below For Complete Demonstration, and User Manual here . Key Features:
Allows you to see multiple currency signals from one chart Analyses the signals from more than a dozen classic indicators Identif

We provide indicators tailored to better meet your trading requirements. >> MT Magical <<
MT Supply Demand :
It is an indicator created to find supply and demand, which will be important support and resistance levels for the price. Supply Zone is a zone where the price has reached, it is often resisted. In other words, when the price reaches this zone, there will be more selling power to push the price back down.
Demand Zone is a zone where the price has reached, it is ofte
FREE

Introducción del medidor de precisión:
Accuracy Meter es una herramienta poderosa para determinar el% de victorias de las estrategias, para mostrarle todos los puntos de entrada y salida de operaciones como ese probador de estrategia de meta trader, puede tener un probador de estrategia simple como indicador en el gráfico, adjuntarlo en diferentes pares y marcos de tiempo y descubrir el porcentaje de precisión de su estrategia, cambie el stop loss y el riesgo para recompensar el factor y vea có
FREE
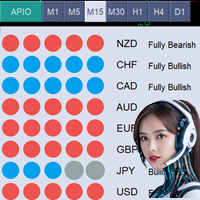
El precio actual del producto es de 49$ por tiempo limitado. El próximo precio será de 99$. Indicador Todo en Uno (APIO) El indicador Todo en Uno (APIO) es una poderosa herramienta diseñada para evaluar la fortaleza de las principales divisas, como USD, EUR, GBP y otras. Analizando los movimientos y direcciones de varios pares de divisas en marcos temporales seleccionados, APIO proporciona a los traders una comprensión clara de la fuerza de las monedas y las oportunidades comerciales potenciale
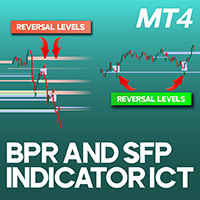
BPR and SFP Indicator for ICT Trading on MT4 The BPR + SFP Indicator integrates two highly effective trading concepts: Breakout and Retest (BPR) and Swing Failure Pattern (SFP) . This combination enables traders to assess market strength and pinpoint optimal entry opportunities with greater accuracy. By analyzing price action and market reactions at significant levels, this indicator helps identify swing failures, breakouts, confirmations, and retracements. It offers clear visual alerts through
FREE

Introduction to the Candle Time Indicator The Candle Time Indicator for MetaTrader 4 (MT4), helps users know how much time on a candlestick is remaining. This is a simple but incredibly powerful and useful tool. To download the Dagangduit CandleTime.mq4 indicator, check the bottom of this post. It’s one of the best forex time indicators in its category. The function of the indicator will not change, even if you change the name of the indicator. The candlestick countdown timer will tell you how m
FREE

Current indicator shows the trading sessions for the major financial centres: London New York Tokyo Sydney There are available two types of displaying zones: in sub window below the chart and on the chart. When the subwindow is selected, the sessions are shown in the form of bars. If the sessions are shown on the main chart, they are displayed in the form of lines at the open price of the session that may also act as a support and resistance for further price action during the trading day. The
FREE
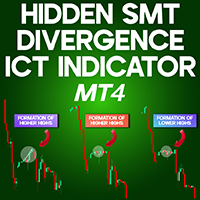
Hidden SMT Divergence Indicator for MT4 The Hidden SMT Divergence Indicator is a powerful analytical tool designed to detect divergences between three different trading instruments. Based on the Smart Money Trading (SMT) concept, this indicator helps traders identify potential price imbalances and liquidity shifts.
By marking divergences directly on the chart, it provides a visual representation of market inefficiencies, enabling traders to better understand institutional trading behavior. Hid
FREE

El comportamiento de los diferentes pares de divisas está interconectado. El indicador Visual Correlation le permite mostrar diferentes instrumentos en 1 gráfico mientras mantiene la escala. Puede definir correlación positiva, negativa o sin correlación.
Algunos instrumentos comienzan a moverse antes que otros. Dichos momentos se pueden determinar superponiendo gráficos.
Para mostrar un instrumento en un gráfico, ingrese su nombre en el campo Symbol . Version for MT5 https://www.mql5.com/es/
FREE
El indicador Market Steps está diseñado y construido sobre la base de las correlaciones de tiempo/precio de Gann y optimizado por las reglas específicas de Price Action para el mercado de divisas. Utiliza los conceptos de flujo de órdenes del mercado para predecir las zonas de precios potenciales para un alto volumen de órdenes.
El Indicador de Niveles puede ser usado para operar por sí mismo o como una combinación para filtrar señales erróneas de otras Estrategias/Indicadores. Todo operador
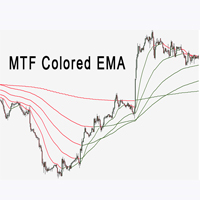
El indicador Multi Time Frame EMA es de gran ayuda para determinar la dirección de la tendencia. Puede ser una excelente adición a su estrategia existente o una nueva base. Los humanos podemos tomar mejores decisiones cuando vemos mejor visualmente. Así que lo diseñamos para mostrar diferentes colores para las tendencias alcistas y bajistas. Cualquiera puede personalizar esto de la manera que mejor funcione para ellos. Podemos configurar el indicador Ema para todos los marcos de tiempo en un grá
FREE

Indicator for Scalping with Signal Arrows
Three-Level Sensitivity Setting
This indicator rapidly identifies changes in price direction and provides signals for opening positions.
Signals trigger instantly on the current candle.
It includes built-in audio and visual alerts for trend changes.
It can send notifications to your phone or email.
It works on all timeframes, across all currency pairs, metals, indices, and cryptocurrencies.
It can be used for binary options trading.
Key Featur
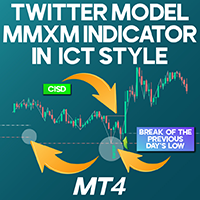
Twitter Model MMXM Indicator in ICT style for MT4
The Twitter Model MMXM Indicator is a MetaTrader 4 (MT4) tool inspired by Inner Circle Trader (ICT) and Smart Money Concepts. It’s engineered to detect daily high/low points over a 24-hour cycle and issues trading alerts based on liquidity grabs, Fair Value Gaps (FVG), and CISD setups.
It also visually marks the New York session's start with a grey horizontal line. «Indicator Installation & User Guide»
MT4 Indicator Installation | Twitter Mod
FREE
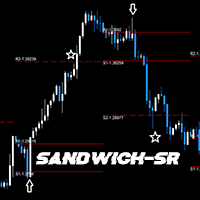
GENERAL DESCRIPTION
Simple SR Projection based on selected instrument's historical data. Best used in conjunction with current market sentiment, and fundamental analysis. Currently limited to selected pairs due to of historical data to project accurate levels.
Generally, for support and resistance, 2 levels are drawn, respectively. The inner levels (R1,S1) project the highs and lows during the opening stages of selected time frame. The outer levels, represent the targets to reach during the clo
FREE

Check my p a id tools they work perfect please r ate Here is an Upgraded version with Bonus Ea in case of purchase it costs 30$ only and you get Ea as Bonus: https://www.mql5.com/en/market/product/96835 This indicator is experimetal, it shows TMA channel arrows with Volatility filter built in to avoid lagging. Try to experiment with it, search for better conditions of use. It is possible to adjust different timeframes for TMA and for Volatility filter Same time on the current chart, so it ma
FREE
El Mercado MetaTrader es una plataforma única y sin análogos en la venta de robots e indicadores técnicos para traders.
Las instrucciones de usuario MQL5.community le darán información sobre otras posibilidades que están al alcance de los traders sólo en nuestro caso: como la copia de señales comerciales, el encargo de programas para freelance, cuentas y cálculos automáticos a través del sistema de pago, el alquiler de la potencia de cálculo de la MQL5 Cloud Network.
Está perdiendo oportunidades comerciales:
- Aplicaciones de trading gratuitas
- 8 000+ señales para copiar
- Noticias económicas para analizar los mercados financieros
Registro
Entrada
Si no tiene cuenta de usuario, regístrese
Para iniciar sesión y usar el sitio web MQL5.com es necesario permitir el uso de Сookies.
Por favor, active este ajuste en su navegador, de lo contrario, no podrá iniciar sesión.