适用于MetaTrader 4的技术指标 - 129
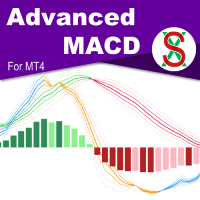
MACD ( M oving A verage C onvergence/ D ivergence) is a widely used indicator in technical analysis. What makes the MACD such a valuable tool for technical analysis is that it effectively combines two indicators into one. It can help to identify trends and measure momentum simultaneously. SX Advanced MACD for MT5 is available here . SX Advanced MACD indicator takes this concept further by plotting two distinct MACD indicators on a single chart, facilitating clear visual correlation between each
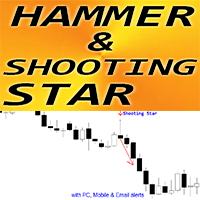
MT4 外汇指标“锤子和射击之星模式”
指标“锤子和射击之星模式”是价格行为交易的非常强大的指标:无需重绘,无延迟; 指标检测图表上的看涨锤子和看跌射击之星模式: 看涨锤子 - 图表上的蓝色箭头信号(见图片) 看跌射击之星 - 图表上的红色箭头信号(见图片) 包括 PC、移动和电子邮件警报 指标“锤子和射击之星模式”非常适合与支撑/阻力位结合使用 ................................................................................................................... // 更多出色的专家顾问和指标可在此处获得: https://www.mql5.com/en/users/def1380/seller 它是仅在此 MQL5 网站上提供的原创产品。

揭示交易见解与自动锚定VWAP: 自动锚定VWAP 是您在交易世界中的指导伙伴。这些指标能够精准地定位市场关键转折点,并使用VWAP线在您的图表上进行标记。这对于采用锚定VWAP策略的交易者来说是一个改变游戏规则的工具。 它如何工作? 识别高点: 如果当前蜡烛的最高价格低于前一蜡烛的最高价格, 并且前一高点高于之前的高点, 我们就识别出了一个峰值。 这个重要的点位于这三根蜡烛的中间位置。 识别低点: 如果当前蜡烛的最低价格高于前一蜡烛的最低价格, 并且前一低点低于之前的低点, 我们就发现了一个底部。 这个底部的中心是我们的关注点。 绘制锚定VWAP: 每个顶部和底部都对应一个VWAP线。但有一个限制:由于指标的计算需求,图表上一次只能显示8条线。 随着更多的线条出现,旧线条让位给新线条。如果一个新的锚定VWAP线关闭,它将再次为旧的锚定VWAP线打开路径。 您有权掌控!根据您的节奏调整“时间框架”设置。请记住,在确认峰值或低谷之前,等待您选择的时间框架的蜡烛关闭。需要三根蜡烛来确认它们,我们会指向中间的那一根。 为了更平稳地交易,保持“当前时间框架”设置。如果您喜欢历史分析,请选择“更
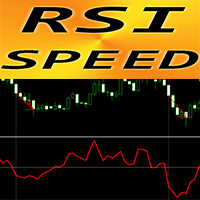
MT4 外汇指标“RSI SPEED”——出色的预测工具!
该指标的计算基于物理方程。RSI SPEED 是 RSI 本身的一阶导数 RSI SPEED 适合在主要趋势方向上进行剥头皮交易 将其与合适的趋势指标结合使用,例如 HTF MA(如图所示) RSI SPEED 指标显示 RSI 本身改变方向的速度 - 它非常敏感 建议将 RSI SPEED 指标用于动量交易策略,如果 RSI SPEED 指标的值 < 0:价格动量下降;如果 RSI SPEED 指标的值 > 0:价格动量上升 指标具有内置的移动和 PC 警报 // 更多出色的专家顾问和指标可在此处获得: https://www.mql5.com/en/users/def1380/seller
它是仅在此 MQL5 网站上提供的原创产品。

This is a combination of multiple oscillators into a single divergence system that creates the impression of a more reliable divergence indicator. It is multi-currency based and works best on 15 minutes timeframe and above. Every time a signal is generated, it shows an alert to the user. It is more ideal if combined with other price action indicators or trading systems.

Hidden Gap by MMD Hidden Gap by MMD is a unique indicator that detects hidden gaps between three consecutive candles. This observation isn't my own, but in the MMD methodology, it has its application alongside other original indicators. You can apply this indicator to the chart multiple times and set the interval from which you want to see the hidden gaps. You can show or hide these gaps as needed. For example, you can view the chart at an M5 interval and see hidden gaps from an M15 chart, etc.

MOST 指标是其他平台上非常流行的指标,尤其是股票和指数。基础是移动平均线和高低位。对于股票和指数,使用百分比输入 2,对于外汇工具,使用 1 - 1.5 可能是合适的。您可以对每种乐器进行自己的调整。它是一个易于使用、简单明了的指标。多见于1小时图和日线图。目前我只针对MT4平台进行编辑,如果有MT5平台的需求,我会在以后发布。 MOST 指标是其他平台上非常流行的指标,尤其是股票和指数。基础是移动平均线和高低位。对于股票和指数,使用百分比输入 2,对于外汇工具,使用 1 - 1.5 可能是合适的。您可以对每种乐器进行自己的调整。它是一个易于使用、简单明了的指标。多见于1小时图和日线图。目前我只针对MT4平台进行编辑,如果有MT5平台的需求,我会在以后发布。
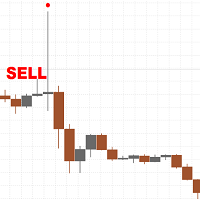
There are only a limited number of copies left, priced at 390 USD . After that, the price will be raised to 450 USD. I develop honest Indicators and know what can work in the market in the long term and what cannot. The classic and most powerful price action pattern is called the pin bar. This pattern works well after the release of fundamental news on M15, M30 and H1 timeframes, but can also be used on other timeframes such as M5 or D1. By default, the settings are set for the H1 timeframe,

Hey traders, it's easy for you to find when to buy or sell signals. Can be used for all forex pairs including gold. How to use this indicator on the M30 or H1 timeframe, for a buy signal, wait until an up arrow appears and for a sell signal, wait for a down arrow, place a stop loss 5-10 points below the arrow. Better trading time on the London and New York sessions and avoid trading when there is news. Happy Trading
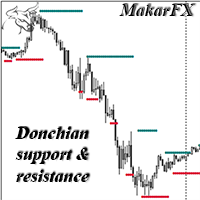
Support and resistance level indicator based on the Donchian channel. The most famous example of trading through the Donchian channel is an experiment with a group of turtles, who earned one hundred and twenty-five million dollars in five years. This indicator can be used as a standalone tool, as well as an additional confirmation. There is MTF, NRP. There are color and thickness settings.

This is a dashboard indicator that displays the auto-calculated risk lot, with the given risk percentage & risk points (Stop Loss) and others. The main function of this indicator is to help you calculate your exact scalping risk lots and swing risk lots. Also it displays the active trades of each pair you've executed with the following: type of trade, lot size, symbol, & equity(+/-). Also displays the bar counter set in every 5-minute bar timer. (whichever time frame you're active, the bar time

Простой и удобный индикатор, указывающий зоны стандартных индикаторов в различных таймфреймах, при необходимости можете в настройках изменить параметры RSI- Relative strength index. Стрелка вверх- если сигнальная линия ниже уровня 300, стрелка вниз- если сигнальная линия выше уровня 70 STOCH- Stochastic. Стрелка вверх- если сигнальная линия ниже уровня 20, стрелка вниз- если сигнальная линия выше уровня 80 ENVELOPE - Envelopes. Стрелка вверх- если свеча открылась ниже красной линии индика

This indicator shows when user set sessions are active and returns various tools + metrics using the closing price within active sessions as an input. Users have the option to change up to 4 session times.
The indicator will increasingly lack accuracy when the chart timeframe is higher than 1 hour.
Settings
Sessions
Enable Session: Allows to enable or disable all associated elements with a specific user set session.
Session Time: Opening and closing times of the user set session
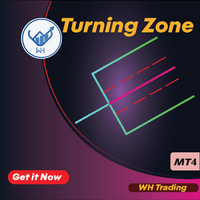
介绍:
“Turning Zone”是一种复杂且创新的 MT4 指标,旨在为交易者提供强大的工具来检测金融市场中潜在的趋势逆转。通过利用干草叉分析的永恒概念,转向区域指标可以识别市场情绪可能发生变化的关键反转区域,为交易者提供宝贵的见解,以做出明智的决策。 MT5 版本 : WH Turning Zone MT5
相关产品 : WH Trend Continuation MT4
主要特征:
干草叉分析. 逆转概率. 视觉清晰度. 定制选项. 实时警报.
如何使用 :
选项 1:等待价格到达转向区域并使用您自己的入场规则、止损和目标上方/下方区域。
选项 2:等待我的入场规则形成(以红色/蓝色箭头指示)止损,并且目标出现在图表上。
利用转向区指标释放精确趋势反转检测的潜力并提升您的交易策略。通过利用干草叉分析的力量,体验交易决策的新水平的信心和准确性。立即下载 MT4 的转向区域指标,在瞬息万变的金融市场世界中获得竞争优势。

This is a dashboard indicator that displays the Average Level of each selected currency pairs that filters and gives us a signal for overbought (>=90%) or if price at extreme peak above 90, and/or oversold (<=10%) or if price at extreme peak below 10.
The calculation is using Relative Strength Index default periods (2 & 9) applied to three different higher time frames H4,D1,&W1.
This won't change or altered even if you change symbol or switch to lower time frames or even in monthly and y

The Donchian Scanner Signals Indicator with is a powerful tool designed for traders operating in the financial market using the Metatrader 4 platform. This indicator combines the popular Donchian Channels strategy with advanced signalization and real-time alert features, providing a clear view of potential entry and exit points in a financial asset. Key Features: Donchian Channels Visualization: The indicator graphically displays Donchian Channels on the price chart. These channels are formed us
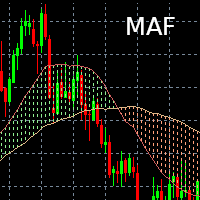
Indicateur Moving Average Filling Affiche deux moyennes mobiles (une courte et une longue) dont la durée et le type (Simple, exponentielle) est paramétrable. L'espace entre les deux moyennes mobiles est alors colorié (rempli) :
- Vert si courte > longue
- Rouge si courte < longue Il est possible de changer les couleurs selon les préférences de chacun / chacune.
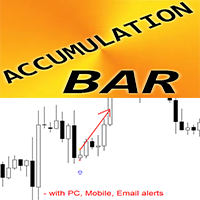
MT4 外汇指标累积条形图
“累积条形图”指标是针对价格行为交易的非常强大的突破重点指标
指标在 1 条柱状图期间检测窄区域内的价格累积并显示:突破方向、挂单和 SL 位置 看涨累积条形图 - 图表上的蓝色箭头信号(见图片) 看跌累积条形图 - 图表上的红色箭头信号(见图片) 无需重绘;无延迟;高 R/R 比率(回报/风险); 指标具有可调灵敏度参数 包括 PC、移动和电子邮件警报 “累积条形图”指标适合与支撑/阻力位结合使用 ................................................................................................................... // 更多出色的专家顾问和指标可在此处获得: https://www.mql5.com/en/users/def1380/seller 这是仅在此 MQL5 网站上提供的原创产品。
Please feel free to contact me if you need any further information.
Please let me know if you have any questions.
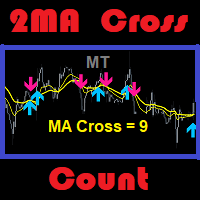
I hope the above is useful to you. MT 2ma Cross Count : is a moving average with 2 lines crossing but the strategy is to focus on the desired number of history bars and count signals that occur. Suitable for traders specialize in martingale strategy or traders specialize in technical ... etc. Traders with the ability to do fundamental analysis have an advantage. Because it will ma
RSI Trend Lines Indicator - Identify Optimal Buying and Selling Opportunities Introduction :
The RSI Trend Lines Indicator is a powerful tool designed to assist traders in identifying optimal buying and selling opportunities based on the Relative Strength Index (RSI) oscillator. This advanced indicator draws trend lines on the RSI chart using multiple points, providing valuable insights into potential market trends and reversals. By leveraging the RSI Trend Lines Indicator, traders can enhance

Perfect for one minutes high trading and scalping. This indicator is very effective for trading on one minutes, in the hour. A combination of moving averages and STOCHASTICS calculation to produce a very convincing signal every hour. Blue colour signals a buy opportunity. Follow the X signs for possible buy points. The Blue average line serves as possible trend direction and support. Red colour signals a sell opportunity. Follow the X signs for possible sell points. The Red average line serves a
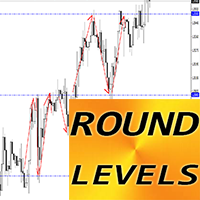
MT4 的外汇指标“回合水平”
“回合水平”指标是考虑支撑/阻力的交易者必须有的辅助指标 价格非常尊重回合水平 - 价格经常从回合水平反弹 对 H4、D1 时间范围使用 1000 点步骤 对于 H1 及更低的时间范围使用 500 点步骤(对于日内交易) 回合水平也适合分配止盈(在回合水平之前)和止损(在回合水平之后) 这些水平非常强劲,尤其是在价格横向横盘和持平期间 ............................................................................................................. // 这里提供更多优秀的 EA 交易和指标: https://www.mql5.com/en/users/def1380/seller 它是仅在该 MQL5 网站上提供的原创产品。

欢迎来到使用 FxBears 超级交易指标的高级交易世界。 这一创新工具专为 MT4 平台设计,结合了艾略特波浪、供需区域和内部指标的强大功能,为交易者提供高质量的信号,以做出明智的交易决策。 FxBears Super 拥有超过 90% 的成功率记录,为您的交易策略带来了新的精确度和盈利水平。 科西嘉岛没有重画,也没有重画。
艾略特波浪分析: FxBears Super 利用艾略特波浪的预测潜力,识别市场周期和趋势。 通过分析特征五浪脉冲和三浪调整形态,准确提取潜在的转折点和延续形态。
供需区: 认识到供需区域的重要性,FxBears Super 在图表上精确指出了关键支撑位和阻力位。 这些市场情绪发生变化的区域为潜在的价格逆转和突破提供了宝贵的见解。
内部指标: FxBears Super 集成了一套内部指标,进一步提高其准确性:
**RSI(相对强弱指数):衡量超买和超卖状况,有助于发现潜在的趋势逆转。
**移动平均线:识别短期和长期趋势,而交叉线则提供潜在进入和退出点的信号。
**MACD(移动

"该指标基于Bystra模式理论检测入场点,并提供放置限价单的入场值,带有目标和止损水平。这使您能够计算您的风险百分比。 注意事项: 该指标具有允许在专家顾问(EAs)中使用的缓冲区。 在使用此产品时,务必进行良好的资金管理。 当您更改时间框架时, 指标将保存在上次会话中使用的模板。 如果您需要一本书来学习这种方法,请在购买后与我们联系并分享您的评论。 参数: 使用系统视觉效果 - 启用/禁用此产品的视觉主题。 相对速度 - 启用/禁用仅在最后一波的快速运动中检测模式。 显示最后一根蜡烛计时器 - 启用/禁用蜡烛计时器。 蜡烛计时器颜色 - 蜡烛计时器文本的颜色。 多头模式颜色 - 多头模式的颜色。 空头模式颜色 - 空头模式的颜色。 发送警报 - 启用/禁用警报。 发送通知 - 启用/禁用移动平台的推送通知。 发送电子邮件 - 启用/禁用电子邮件警报。 显示目标 - 启用/禁用在图表上显示目标。 历史条数 - 最大历史条数。" 如果您有更多问题或需要进一步帮助,请随时问我!

Market Profile Heat indicator — is a classic Market Profile implementation that can show the price density over time, outlining the most important price levels, value area, and control value of a given trading session.
This indicator can be attached to timeframes between M1 and D1 and will show the Market Profile for daily, weekly, monthly, or even intraday sessions. Lower timeframes offer higher precision. Higher timeframes are recommended for better visibility. It is also possible to use a f

Rapid Trend is a technical analysis indicator that determines the direction and strength of a trend, and also signals a trend change. Allows you to determine the current trend. With the help of its algorithm, you can quickly understand what kind of trend is currently developing in the market. Rapid Trend can be used along with oscillators as filters. Setting up the Rapid Trend forex indicator allows you to receive more accurate signals for opening positions. Uses only one parameter for settings.

Fibo Star指标旨在在交易图表上以星形图案绘制斐波那契扇形。 这些斐波那契扇形是用于分析价格走势的有力工具,可以提供有关潜在支撑和阻力水平的见解。此指标配备了一个用户友好的控制面板,旨在简化绘制和配置扇形的过程,从而节省时间和精力。 使用说明: 此指标仅适用于手动使用。为了有效地使用它,请按照以下步骤操作: 辨认出您希望基于其绘制斐波那契扇形的高点和低点。 将紫色线放在这些高点和低点上。 一旦价格与这些线条交互,观察指标如何作为动态支撑和阻力水平运作。 参数: Use_System_Theme: 此参数允许您选择首选主题,以使指标的外观与您交易平台的整体样式相匹配。 Levels_Color: 选择您要为斐波那契扇形的水平使用的颜色。 Levels_Style: 定义斐波那契扇形水平的样式,根据您的喜好调整外观。 Levels_Width: 调整斐波那契扇形水平的宽度,以增强在图表上的可见性。 Levels_Ray: 启用或禁用从斐波那契扇形水平延伸的射线的显示。 Lvl0 - Lvl8: 为每个水平指定比例值。这些值在确定斐波那契扇形的角度和位置时起着关键作用。 Star_Co

“Currency Strength Indicator” 是一个功能强大的工具,旨在为交易员提供有关外汇市场中各种货币相对强度的信息。通过根据其相应的时间框架计算和绘制每种货币的力度,该指标为交易员提供了识别潜在交易机会的机会,尤其是在观察到显著的背离或交叉时。 指标的关键特点: 1. 货币强度计算: 该指标根据其指定的时间框架计算每种货币的强度。此计算涉及在指定的时间段内对一种货币相对于其他货币篮子的表现进行评估。这有助于交易员了解货币的相对强弱。 2. 收缩和背离: 当两种货币的力度之间出现收缩或背离运动时,这可能表明潜在的交易机会。例如,如果一种货币显著增强,而另一种货币在减弱,这可能表明潜在的入场点。 3. 穿越零水平: 该指标还识别了货币强度穿越零水平的情况。上穿零水平可能表明强势趋势,而下穿零水平可能意味着弱势趋势。这些交叉可以作为交易决策的额外确认。 4. 可自定义的显示: 交易员可以选择在其图表上显示哪些货币强度。该指标允许启用或禁用特定货币的强度显示,如 USD、EUR、GBP、AUD、NZD、JPY、CHF 和 CAD。 5. 强度时间框架: “Strength

The Wamek Support and Resistant (WSR) Indicator is a remarkable tool that stands out in the world of technical analysis. It sets itself apart by cleverly combining price action and leading indicators to delineate support and resistance levels with a high degree of accuracy. Its unique feature is its adaptability; users can fine-tune the indicator by adjusting input parameters, enabling them to create customized support and resistance levels that suit their trading strategies. Notably, one of WSR

用于检测强势价格行动模式的技术指标:Pin Bar、Inside Bar 和 Outside Bar 介绍: 在技术分析领域,价格行动模式是潜在市场走势的重要指标。我们开发了一款先进的技术指标,可以在图表上简化强势价格行动模式的识别。我们的指标专门用于检测三种基本模式:Pin Bar、Inside Bar 和 Outside Bar。 检测到的关键模式: Pin Bar: Pin Bar 模式是单根蜡烛图形成,表示市场趋势可能发生反转。它的特点是小的实体和长的上引线或下引线。看涨的 Pin Bar 表示可能的看涨反转,而看跌的 Pin Bar 暗示看跌反转。 Inside Bar: Inside Bar 模式是指单根蜡烛的整个价格范围都在前一根蜡烛的价格范围之内。该模式表明市场暂时整理或无决策,通常会在两个方向中的一个发生突破之前出现。 Outside Bar: Outside Bar 模式,也称为“吞没”模式,出现在一根蜡烛的范围完全包围前一根蜡烛的范围时。看涨的 Outside Bar 可能预示看涨反转,而看跌的 Outside Bar 可能表明看跌反转。 指标功能: 我们的指标

基于数字学的MetaTrader支持和阻力指标 简介: 通过我们的基于数字学的MetaTrader支持和阻力指标,解锁技术分析的新维度。这个独特的工具利用数字学的力量,在您的图表上识别关键的支持和阻力水平,为您提供有关潜在价格变动的有价值见解。 关键概念: 交易中的数字学: 数字学是对数字及其在我们生活中的意义的神秘研究。将数字学原理应用于交易,涉及到识别具有象征意义的特定数字,并使用它们来预测可能吸引买入或卖出活动的价格水平。 指标功能: 我们的指标利用数字学的隐藏模式,在您的图表上绘制支持和阻力水平。这些水平是从在金融市场中具有显著意义的关键数字中获得的。 学习的首选步骤: 了解数字学:在使用该指标之前,花些时间了解数字学的基础知识及其在交易中的相关性。了解重要数字、它们的含义以及它们与金融市场的关系。 指标安装:首先,在您的MetaTrader平台上安装基于数字学的支持和阻力指标。按照用户指南中提供的安装说明操作。 选择时间框架:打开您喜欢的交易工具的图表,选择您想要分析的时间框架。该指标适用于不同的时间框架,可以用于识别短期和长期交易的数字学水平。 调整指标参数:根据您的交易偏

Binary Lines is a technical analysis indicator for currencies, commodities, cryptocurrencies, stocks, indices and any financial instruments. Can be used for binary options or Forex scalping. Shows entry and exit points at fixed intervals and provides traders the necessary information about the results of possible transactions. Entry points are formed at the very beginning of the candle, in the direction of the MA line, duration
trades in bars can be adjusted manually and adjusted to any financi

随机横盘检测器 - 是交易中高效的辅助工具! 我建议您使用这个出色的 MT4 指标来升级您的交易方法。
指标在图表上显示价格平坦区域。 它具有“平坦”参数 - 负责平坦的检测灵敏度。 随机平坦检测器可用于价格行为入场确认、背离或超卖/超买信号 您可以将其用于趋势跟踪系统来检测横盘并避免在那里进行交易。 您可以使用它进行逆转倒卖 - 交易来自平盘的逆转 有很多机会使用随机平坦检测器代替标准随机检测器 ............................................................................................................. // 这里提供更多优秀的 EA 交易和指标: https://www.mql5.com/en/users/def1380/seller 它是仅在该 MQL5 网站上提供的原创产品。

This indicator is based on the classical indicator Stochastic and will be helpful for those who love and know how to use not a visual but digital representation of the indicator. All TimeFrames RSI MT4 indicator shows values from each timeframe. You will be able to change the main input parameters for each RSI for every TF. Example for M1: sTF1_____ = "M1"; kPeriod1 = 5; dPeriod1 = 3; Slowing1 = 3; stMethod1 = MODE_SMA; Price_Field1 = MODE_MAIN; stMode1 = 0;
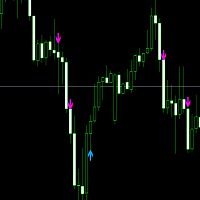
This offer is limited to a temporary period. Entry signal :follow the blue arrow for a buy trade and the Pink for a sell. Buy Trade: When the blue arrow appears, you wait until the candle completely finishes. Then you enter into a Buy Trade as soon as the next candle appears. Now wait until you hit TP1 from the Buy Goals box, then close the trade with a profit. Sell Trade: When the Pink arrow appears, you wait until the candle completely finishes Then you enter into a Buy Trade as soon as the

Drop Trend is a trend indicator for the MetaTrader 4 trading platform. This indicator allows you to find the most probable trend reversal points. You will not find this indicator anywhere else. A simple but effective system for determining the forex trend. From the screenshots you can see for yourself the accuracy of this tool. Works on all currency pairs, stocks, raw materials, cryptocurrencies.
Are you tired of the constant ups and downs? Do not become a victim of unstable market movements,
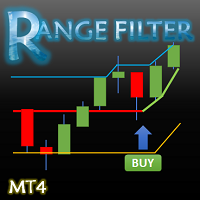
This indicator converted from 5 min Buy and Sell Range Filter - guikroth version on TradingView Popularity of the Range Filter
The Range Filter is a very popular and effective indicator in its own right, with adjustments to the few simple settings it is possible to use the Range Filter for helping filter price movement, whether helping to determine trend direction or ranges, to timing breakout or even reversal entries. Its practical versatility makes it ideal for integrating it's signals into

Introducing the "Magic Trades" for MetaTrader 4 – your ultimate tool for precision trading in dynamic markets. This innovative indicator revolutionizes the way you perceive market trends by harnessing the power of advanced analysis to detect subtle changes in character, paving the way for optimal trading opportunities.
The Magic Trades Indicator is designed to empower traders with insightful entry points and well-defined risk management levels. Through its sophisticated algorithm, this indica

The indicator determines the best moments for entering the market.
It is written on the basis of well-known indicators such as Alligator and CC I. For fine-tuning, it contains all the parameters of parents. The indicator works on all timeframes.
The basic setting of the indicator is performed by changing the values of two parameters "Precision" and "CCI Period". All other parameters can be left unchanged.

A technical indicator that calculates its readings on trading volumes. In the form of a histogram, it shows the accumulation of the strength of the movement of the trading instrument. It has independent calculation systems for bullish and bearish directions. Works on any trading instruments and time frames. Can complement any trading system.
The indicator does not redraw its values, the signals appear on the current candle.
It is easy to use and does not load the chart, does not require additi
Please feel free to contact me if you need any further information.
Please let me know if you have any questions.
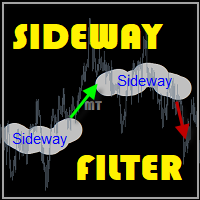
I hope the above is useful to you. MT Sideway Filter : It is an indicator that is built to find many sideways, when a sideway is formed, the graph will jump out into a trend. After that, you can continue to strategy your trading. It's an opportunity to make good profits. indicator for trade by yourself
TRADE: Forex TIME FRAME: All Time Frame SYMBOL PAIR: All Symbol
SETTINGS

The " Global Trend Pro Lines " indicator is one of the most important indicators designed to display trading volumes based on the sniper strategy. This indicator provides convenience for daily, medium-term, and long-term traders. The main advantages of the indicator are as follows: Suitable for the sniper strategy: The "Global Trend Pro Lines" indicator is suitable for the sniper strategy and allows traders to identify the best entry and exit points for trading. Displays volumes: The indicator
DYJ PeakAndTrough 指标是一个先进的加权平方均线(SQWMA)交易系统。 它包含未来趋势线和趋势角度以及每个波峰波谷的角度显示.
在SQWMA最高点的末端,有一个向下的趋势, 在SQWMA的底部,有上升的趋势。 指标信号可以使用设置模拟交易量的开仓平仓历史统计,让你对信号概率有更详细的了解。
请下载在评论区的XAUUSD参数模板文件( Link )
参数
InpMAPeriod = 25 -- 加权平方平均线周期
InpMAMethod= MODE_SMA -- 加权平方均线方法
InpAppledPrice = PRICE _ CLOSE -- 加权平方均线应用价格模式
InpWaveAmplitudeSize = 10-波型的宽度(它是以蜡烛数量为单位) InpWaveAmplitudeSize = 2 -- 波幅的大小。它是点差的倍数 InpMinBarOfSignal = 100 -相邻两个波型之间的距离(它是以蜡烛数量为单位)

If you are a Price Action Trader this indicator will help you so much Every trader must have it ! I'm a trader so i know what you need ! Message me if you wanna see the video you should send me message
don't worry i will help you to learn how to use my indicators
i also have other indicators, please watch them stay tuned i also have other useful indicators and Experts Telegram ID: @forex_ex4
#forex #priceaction #indicator #mt4 #mt5 #trade #trader

Alright. This indicator works on MT4 and is very easy to use. When you receive a signal from it, you wait for that candle with the signal to close and you enter your trade at the beginning of the next new candle. A red arrow means sell and a green arrow means buy. All arrows comes with Popup Alert like for easy identification of trade signal. Are you okay with that?
100% non repaint
Work All Major currency Pair,
1 minute time frame 1 minute expire

Homemade Indicator using specific price action system to find suitables buys and sell ideas. *It is very easy to use *Ideal on 5mn timeframe (where i personnally use it)
*It does NOT repaint *It works on every timeframes
*There are a lot of setups of buys and sell everyday *The loss are VERY smalls compared to profits
*It works very well on volatile markets
More ideas to come soon : -Possibilities of changing setups
-Take profits spot -Alerts -etc...

Buy Sell Scalper - a signal Forex indicator for scalping. It indicates possible price reversal points to the trader. A red dot indicates downward price reversal points, while blue dots indicate upward price reversal points. Recommended currency pairs are EURUSD, GBPUSD, XAUUSD, USDCHF, USDJPY, USDCAD, AUDUSD, EURGBP, EURAUD, EURCHF. Recommended timeframes are M5, M30, H1. The signals from this indicator are also used in the operation of an automated robot: https://www.mql5.com/en/market/product
Discover Prozones Intraday MT4: Elevate Your Trading Success with Precision Are you tired of sifting through market noise in search of profitable trades? Look no further than Prozones Intraday MT4 – your ultimate solution for consistent trading success in the fast-paced world of intraday trading. Crafted with advanced algorithms and years of market expertise, this indicator empowers traders of all levels to make informed decisions with confidence. Key Features: Pinpoint Precision in Trend Analys

Discover Prozones IntraWeek MT4: Elevate Your Trading Success with Precision Are you tired of sifting through market noise in search of profitable trades? Look no further than Prozones IntraWeek MT4 – your ultimate solution for consistent trading success in the fast-paced world of intraday trading. Crafted with advanced algorithms and years of market expertise, this indicator empowers traders of all levels to make informed decisions with confidence. Key Features: Pinpoint Precision in Trend Anal
The KT MTF Order Blocks automatically plots the institutional order blocks by using a unique blend of price action with comprehensive multi-timeframe analysis. This advanced approach reveals the area of price reversal, originating from significant buy and sell orders strategically placed by major market players.
Features
Algorithmic Precision: A refined and distinctive order block algorithm meticulously crafted to precisely identify the most pivotal order blocks, often triggering price reve

The SuperTrend AI indicator is a novel take on bridging the gap between the K-means clustering machine learning method & technical indicators. In this case, we apply K-Means clustering to the famous SuperTrend indicator. USAGE Users can interpret the SuperTrend AI trailing stop similarly to the regular SuperTrend indicator. Using higher minimum/maximum factors will return longer-term signals. (image 1) The displayed performance metrics displayed on each signal allow for a deeper interpretat

This indicator will give you entries as result of scalping strategy that will be applied on 14 symbols in same time and you are able to be notified with this entries
Note : This indicator for scalping on 5 minutes timeframe only .
How to use it :
1-Open chart and adjust settings (edit symbols names as your platform names , activate the alert system if you need it . 2-Wait for any signal you have it from this scanner you will have it as alert and as notification and you will see it on bo

This indicator gives you the signal of real cross on stochastic indicator. This indicator is easy to attach to an ea. This indicator will work best on All time frames. Arrow appears depending on many algorithms that study the cross parameters.
Indicator properties Use_System_Visuals: enable/disable visual styles. Stochastic_K_Period. Stochastic_D_Period. Stochastic_Slowing. Use_Notifications: enable/disable Push Notifications. Use_Alert: enable/disable Alerts. Use_E_Mail: enable/disable Email

推出“ON Trade VSA” - 您的终极VSA分析工具! 通过我们的前沿指标“ON Trade VSA”,解锁量价分析(VSA)的强大功能。VSA是交易员用来衡量市场强度、识别趋势并做出明智决策的强大方法。让我们深入了解使“ON Trade VSA”成为您交易武器库中不可或缺的工具的关键功能: 多彩的成交量蜡烛图 :通过我们独特的功能,根据成交量蜡烛的平均移动赋予不同的颜色,您可以洞察市场动态,快速发现市场情绪的变化。 强劲趋势检测 :我们的指标不仅仅停留在基本层面。它准确地识别并绘制图表上的最强趋势,为您提供清晰的市场方向图景。 成交量-区间乘数 :通过绘制成交量乘以区间,揭示隐藏的模式。通过分析成交量与价格范围之间的关系,您将能够了解市场波动性和潜在的突破点。 波动性洞察 :通过我们的波动性趋势线来可视化市场波动性。这些线条帮助您解读市场动态,有助于及时做出交易决策。 行动提醒 :通过实时提醒始终掌握交易动态。“ON Trade VSA”在重要市场事件发生时通知您,确保您不会错过任何交易机会。 通过“ON Trade VSA”提升您的交易策略,体验最佳VSA分析。无论您是经验
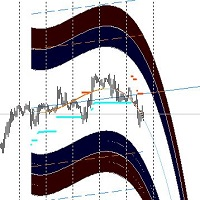
The forex market, like nature, moves in cycles — oscillating between peaks and troughs, bullish runs and bearish retreats. But what if you had a compass to chart these cycles and anticipate every turn? Austin Market Levels Indicator is crafted to be that compass, designed meticulously to decode market cycles and pinpoint profit opportunities.
---
Mastering Market Cycles
The secret to consistent forex trading success often lies in understanding the underlying patterns. Austin Market

The Cyber Trend indicator analyzes the price action and if there is a temporary weakness in the trend, you can notice it from the indicator readings, as in the case of a pronounced change in trend direction. Entering the market is not difficult, but staying in it is much more difficult. Keeping up with the trend will become much easier with the Cyber Trend indicator! This indicator allows you to analyze historical data and, based on them, display instructions to the trader for further actions.

The Trends Trg indicator determines the prevailing trend. They help to analyze the market at the selected time interval. Easy to set up and works on all pairs and all time frames. Trend indicators make it possible to classify the direction of price movement by determining its strength. Solving this problem helps investors enter the market on time and get a good return.
It is extremely important for any trader to correctly determine the direction and strength of the trend movement. Unfortunate

The indicator provides a superior alternative to price action analysis. It enables the identification of normalized patterns, which are then transformed into a graphical representation to forecast future steps within a time series. In the top-left corner, you'll find information regarding the expected prediction accuracy, determined through a complex MSQE calculation. You have the flexibility to adjust the time window, making it easy to validate the indicator's performance. Additionally, you can

In the ever-evolving world of Forex trading, understanding the different trading sessions is paramount to making informed trading decisions. Each trading session brings its own unique characteristics, opportunities, and challenges, and recognizing these can greatly enhance your trading strategies. Whether you're a novice or a seasoned trader, the Forex market's three main trading sessions – Asian, London, and New York – are crucial milestones that dictate market behavior and potential trade set

The "REVERSAL" indicator is a pointer indicator without redrawing and delay. The "REVERSAL" indicator shows the best trend entry points on the chart. It is better to use it in tandem with other trend indicators as a filter. The indicator shows good results on all timeframes. The signal is generated after the candle closes and appears as blue and red arrows. If you reduce the amplitude, then you can trade in the style of scalping

This product is a part of ON Trade Waves Patterns Harmonic Elliot Wolfe
you can test free version on EURJPY from this link Wolf Waves Indicator
探索 Wolf Waves - 您的终极交易工具! 您是否正在寻找一种强大的工具,能够轻松地在任何时间框架上识别 Wolf Waves?不用再找了!我们的 Wolf Waves 指标可以轻松完成这项任务。以下是为您呈现它的理由: 主要特点: 自动检测: 我们的 Wolf Waves 指标使用复杂的算法自动查找关键点并在您的图表上绘制相应的线条。不再需要手动搜索模式。 用户友好: 无论您是专业交易员还是对 Wolf Waves 还不熟悉,我们的指标都非常易于使用。 精准性: 它非常精确,降低了虚假信号的数量,提高了您的信心。 信息丰富: 该指标不仅限于模式检测。它还提供入场点、止损水平和利润目标等重要交易信息,帮助您做出明智的交易决策。 适用于 EA: 如果您进行自动化交易,此指标可以无缝集成
“信號直方圖剝頭皮”指標是一種以直方圖和信號形式呈現的通用指標,無需重繪或滯後。 “信號直方圖剝頭皮”指標在圖表上顯示趨勢上的最佳入場點。 最好將其與其他趨勢指標結合使用作為過濾器。 該指標在 M5 時間範圍內顯示出良好的結果。該信號在蠟燭收盤後生成,並以綠色和紅色圓圈的形式出現。 “信號直方圖剝頭皮”指標旨在以純粹的形式進行剝頭皮交易,並使用過濾器進行日內交易。 屏幕截圖顯示了持倉進入點和退出點的示例。 當使用“信號直方圖剝頭皮”指標進行交易時,您將始終獲利,因為該指標算法包含獨特的剝頭皮策略 “信號直方圖剝頭皮”指標是一種以直方圖和信號形式呈現的通用指標,無需重繪或滯後。 “信號直方圖剝頭皮”指標在圖表上顯示趨勢上的最佳入場點。 最好將其與其他趨勢指標結合使用作為過濾器。 該指標在 M5 時間範圍內顯示出良好的結果。該信號在蠟燭收盤後生成,並以綠色和紅色圓圈的形式出現。 “信號直方圖剝頭皮”指標旨在以純粹的形式進行剝頭皮交易,並使用過濾器進行日內交易。 屏幕截圖顯示了持倉進入點和退出點的示例。 當使用“信號直方圖剝頭皮”指標進行交易時,您將始終獲利,因為該指標算法包含獨特的剝

介绍 Heracles 指标。该指标使交易变得简单,无需进行分析。它会自动识别积累区域、入场点,并提供明确的止盈水平。
Heracles 指标会在价格达到买入或卖出入场点时提醒您,并显示信号箭头,同时建议三个止盈水平。
它适用于新手和专业交易员。
支持渠道: 点击这里 MT5 版本: 点击这里
建议:
时间框架:M5 和 M15 货币对:任何货币对 账户类型:ECN、Raw 或 Razor,具有非常低的点差 建议止损:50 点或高/低区域 建议止盈水平:25 点、50 点和75 点
规格: 1/ 自动绘制积累区域 2/ 自动建议买入/卖出入场点 3/ 高精度建议三个止盈水平 4/ 面向初学者的用户界面 5/ 包括提醒通知
联系: 如果您有任何问题或需要帮助,请随时通过私信与我联系。

Attraverso l'indicatore Savius Zone potrai finalmente: Definire delle zone oggettive da attenzionare Ridurre la discrezionalità Filtrare i tuoi pattern operativi Avvalerti di un metodo comprovato Qui di seguito alcune funzioni dell'indicatore Savius Zone: Zone Buy & Sell L’indicatore fornisce delle zone buy e sell ogni giorno dopo l’apertura del mercato cash sui seguenti mercati: DAX, S&P500, Nasdaq, Russel2000, Dow Jones
Occasioni giornaliere Savius Zone fornisce occasioni di trading tutti i
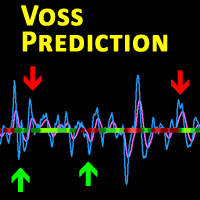
Description This is a modified version of the popular Voss Predictive Filter - A peek into the future by Dr. John Ehlers. It contains 2 lines - V-Line (blue) and F-Line (red), a trend indication and BUY/SELL signals.
Usage Buy Green dots indicate an up trend. Open a BUY position if the V-Line crosses the F-Line from below and an up trend is signaled (green dots) Close BUY position if V-Lines falls beneath F-Line again Sell Red dots indicate a down trend Open a sell position if V-Line fall

The KT Buy Sell Volume is a powerful tool traders use to gauge the strength and weakness of price movements. In the whirlwind of the Forex market, traders aim to identify and ride the waves of a bullish or bearish trend that exudes strength and potential. However, recognizing these trends necessitates a method, metric, or indicator to quantify their strength. One crucial factor that traders examine for this purpose is volume. Volume refers to the number of shares or contracts traded in a securit
KT Momentum Histogram provides traders with a visualization of the momentum of a particular asset, which helps determine the strength and potential direction of a market trend. The indicator calculates and operates based on momentum in trading.
What Exactly is a Momentum Histogram
Momentum is the rate of acceleration of an asset's price or volume. In other words, it measures the speed at which the price of an asset is moving in a particular direction over a specific period of time. Positive

This is the Full Version, to get the free version please contact me.
The free version works on “AUDNZD” and “XAUUSD” charts.
All symbols and time frames scanner
Head and Shoulder
One of the most popular Price Action patterns is the Head and Shoulders pattern. The pattern has three local tops that resemble the left shoulder, head, and right shoulder. The head and shoulders chart pattern appears in all kinds of markets, including Forex, cryptocurrency, commodities, stocks, and bonds. The
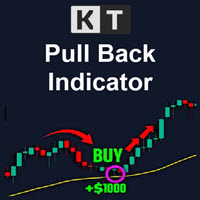
The KT Pull Back Arrows shows the pull back arrows using the RSI (Relative Strength Index) to identify suitable pull-back entry areas within the overbought and oversold zones. The indicator effectively pinpoints favorable moments for initiating pull-back trades by leveraging these RSI thresholds. Trend trading is often considered the most profitable strategy in the Forex market. It is the equivalent of riding the wave, going with the flow, and capitalizing on market momentum. However, timing is
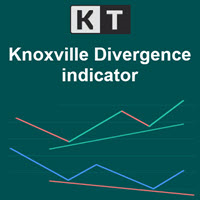
The KT Knoxville Divergence is a powerful tool that reveals unique price divergences in a financial instrument by employing a carefully crafted combination of the Relative Strength Index (RSI) and a momentum oscillator. This indicator effectively captures subtle variations in market dynamics and assists traders in identifying potentially profitable trading opportunities with greater precision. Knoxville Divergences is a type of divergence in trading developed by Rob Booker. Divergence in tradin
MetaTrader市场是一个简单方便的网站,在这里开发者可以出售自己的交易应用程序。
我们将帮助您发布您的产品,并向您解释如何为市场准备您的产品描述。市场上所有的应用程序都是加密保护并且只能在买家的电脑上运行。非法拷贝是不可能的。
您错过了交易机会:
- 免费交易应用程序
- 8,000+信号可供复制
- 探索金融市场的经济新闻
注册
登录