适用于MetaTrader 4的新技术指标 - 2
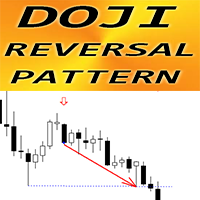
适用于 MT4 的外汇指标“十字星反转模式”
指标“十字星反转模式”是纯粹的价格行为交易:无重绘,无延迟; 指标检测图表上的十字星反转模式,其中十字星蜡烛位于模式中间,最后一根蜡烛是突破蜡烛: 看涨十字星反转模式 - 图表上的蓝色箭头信号(见图片) 看跌十字星反转模式 - 图表上的红色箭头信号(见图片) 包括 PC、移动和电子邮件警报 指标“十字星反转模式”适合与支撑/阻力位结合使用: https://www.mql5.com/en/market/product/100903
// 更多出色的专家顾问和指标可在此处获得: https://www.mql5.com/en/users/def1380/seller // 也欢迎您加入有利可图、稳定可靠的信号 https://www.mql5.com/en/signals/1887493 它是仅在此 MQL5 网站上提供的原创产品。
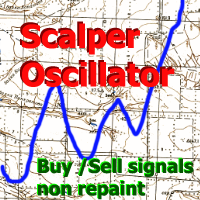
An analytical tool designed for carrying out trading transactions.
The indicator analyzes momentum volatility and volumes to identify potential signals.
Contains a trend detection system that filters out market noise.
The indicator algorithm generates signals when specified levels are crossed within trend frames.
Possibilities
Works on any time frames and trading instruments (forex, cryptocurrencies, metals, stocks, indices.) Simple visual reading of information without loading a chart T

-AUDUSD M15 - Every time there is any crossing of the RED lines , it means sell. - Every time there is any crossing of the GREEN lines , it indicates buy.
Discover the Future of Trading with Our Exclusive Indicator! In the dynamic world of financial markets, precision and the ability to anticipate movements are crucial for success. With this in mind, we have developed an exclusive indicator that combines cutting-edge technology with a sophisticated approach to offer you an indispensable to

MT4 外汇指标 HTF Ichimoku
Ichimoku 指标是最强大的趋势指标之一。HTF 表示 - 更高时间框架
此指标非常适合趋势交易者以及与价格行动条目的组合。 HTF Ichimoku 指标允许您将更高时间框架的 Ichimoku 附加到您当前的图表。 上升趋势 - 红线高于蓝线(并且两条线都在云层之上)/ 下降趋势 - 红线低于蓝线(并且两条线都在云层之下) 仅当价格突破 Ichimoku 云层顶部边界时才开买单 仅当价格突破 Ichimoku 云层底部边界时才开卖单 HTF Ichimoku 指标提供捕捉大趋势的机会
// 更多出色的专家顾问和指标可在此处获得: https://www.mql5.com/en/users/def1380/seller // 也欢迎您加入盈利、稳定和可靠的信号 https://www.mql5.com/en/signals/1887493 这是仅在此 MQL5 网站上提供的原创产品。

Heiken Ashi Histo Filter - 是一款出色且高效的辅助交易工具!
使用先进的新计算方法 - 参数“计算价格”有 10 个选项 非常适合与价格行为模式结合使用 绿色直方图 - 寻找看涨入场 洋红色直方图 - 寻找看跌入场 使用此指标,有很多机会升级标准策略 指标内置移动、PC 和电子邮件警报 ------------------------------------------------------------------------------------------------------------------- // 更多出色的专家顾问和指标可在此处获得: https://www.mql5.com/en/users/def1380/seller // 也欢迎您加入有利可图、稳定可靠的信号 https://www.mql5.com/en/signals/1887493 这是仅在此 MQL5 网站上提供的原创产品。

外汇指标 INSIDE Bar 模式适用于 MT4
指标“INSIDE Bar”是价格行为交易的非常强大的指标 指标检测图表上的 INSIDE Bar 模式: 看涨 INSIDE Bar - 图表上的蓝色箭头信号(见图片) 看跌 INSIDE Bar - 图表上的红色箭头信号(见图片) 无需重绘;无延迟;高 R/R 比率(回报/风险) 包括 PC、移动和电子邮件警报 指标“INSIDE Bar Pattern”非常适合与支撑/阻力位结合使用: https://www.mql5.com/en/market/product/100903
// 更多出色的专家顾问和指标可在此处获得: https://www.mql5.com/en/users/def1380/seller // 也欢迎您加入有利可图、稳定可靠的信号 https://www.mql5.com/en/signals/1887493 这是仅在此 MQL5 网站上提供的原创产品。

Indicatorul Vega
Indicatorul este creat pentru M1.
Semnale rare și sigure.
Succes!
Dacă indicatorul nu este afișat, citiți comentariul meu în secțiunea de comentarii pentru a afla cum să faceți acest lucru.
Verificați mai întâi indicatorul sau expertul pe un cont DEMO, înainte de a-l cumpăra! Analizați-l bine!
Închiriați-l pentru o perioadă mai scurtă de timp. Pentru a vedea cum funcționează și dacă funcționează pe computer.
Presentation of the "Color Range Indicator" The "Color Range Indicator" is a powerful technical analysis tool designed for the MT4 platform, perfect for traders who want a clear and immediate view of market trends. This indicator draws a colored line based on the current trend, making it easier to interpret price movements. Indicator Description: Green line : Indicates an uptrend. Use this signal to consider buying opportunities. Red line : Indicates a downtrend. Use this signal to consider sell

Our new indicator is an important part of the Smart Money Concepts (SMC) system
It uses a modern market vision and fast calculation methods. As a result, the trader has a complete picture of the trade at every moment in time, which makes the process of obtaining results easier and faster.
Our new indicator displays the following important patterns:
Order Blocks. Imbalance – Fair Value Gap (FVG). Break Of Structures (BoS). Change of character (CHoCH). Equal highs & lows. Premium , Equili

The Accumulation/Distribution (AD) Technical Indicator is a tool used in technical analysis to determine whether an asset is being accumulated (bought) or distributed (sold) in the market. Key Characteristics of the AD Indicator: Purpose: The AD indicator is used to assess the balance between buying (accumulation) and selling (distribution) of an asset. This helps traders and investors evaluate the strength of the current trend and potential reversals. Interpretation: Rising Indicator: When the

The principle of this indicator is very simple: detecting the candlestick pattern in H1 timeframe, then monitoring the return point of graph by using the pullback of High-Low of H1 Candlestick and finally predicting BUY and SELL signal with arrows, alerts and notifications. The parameters are fixed and automatically calculated on each time frame. Example:
If you install indicator on XAUUSD, timeframe H1: the indicator will detect the reversal, pullback, price action on this timeframe (for exa
FREE

Moving Pivot Average The pivot indicator compares the selected period with its counterpart from the previous period. The indicator uses very flexible algorithm for pivot value calculating. It allows you to allocate in days a certain time intervals (custom bars) and calculate the average pivot value based on High, Low and Close prices of these bars. How many custom bars will be taken into account is determined by the "Days" setting. The pivot line can be considered an average trend line and us
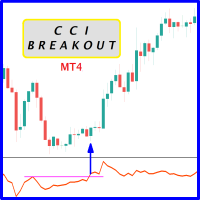
Probability emerges to record higher prices when CCi oscillator breaks out oscillator historical resistance level when exhibit overbought values. Since, oscillator breakout of support and resistance have similar effect as price breaks support and resistance levels, therefore, its highly advised to confirm price breakout with oscillator breakout; certainly, will have the same output in short trades. Concept is based on find swing levels which based on number of bars by each side of peak or trough
FREE
Semnal M1 fără pierderi A
Indicatorul este creat pentru M1.
Semnalele sunt relativ rare, dar de bună calitate.
Succes!
Note Dacă indicatorul nu este afișat, citiți comentariul meu în secțiunea de comentarii pentru a afla cum să faceți acest lucru.
IMPORTANT! Verificați mai întâi indicatorul sau expertul pe un cont DEMO, înainte de a-l cumpăra! Analizați-l bine!
Închiriați-l pentru o perioadă mai scurtă de timp. Pentru a vedea cum funcționează și dacă funcționează pe computer.

Săgețile giganților
Bun venit.
Indicatorul Arrows of Giants funcționează foarte bine pe M15, M30, H1 și H4.
Poate fi experimentat și pe M5.
Succes!
Dacă indicatorul nu este afișat, citiți comentariul meu în secțiunea de comentarii pentru a afla cum să faceți acest lucru.
Verificați mai întâi indicatorul sau expertul pe un cont DEMO, înainte de a-l cumpăra! Analizați-l bine!
Închiriați-l pentru o perioadă mai scurtă de timp. Pentru a vedea cum funcționează și dacă funcționează

Features:
Get OB/OS Levels from Golden MA Levels Wait for Buy/Sell Start Level Cross Optional: Should price cross Mid Level in earlier bars Optional: Crossing bar High/Medium Volume Optional: MA Stacked to check up/down trend for current TF Optional: NRTR higher timeframes aligned Check
Detailed blog post explained: https://www.mql5.com/en/blogs/post/758457
Levels with Buffers available here: Golden MA Levels Indicator: https://www.mql5.com/en/market/product/119515 Note: Arrows/Scanner do
FREE

Predator Indicator - M5
Bun venit.
Predator Indicator - M5 este creat pentru intervalul de timp M5, după cum sugerează și numele.
Este un indicator scalping.
Videoclipul arată că a funcționat foarte bine pe EURUSD M5 și nu revopsește.
Succes!
Dacă indicatorul nu este afișat, citiți comentariul meu în secțiunea de comentarii pentru a afla cum să faceți acest lucru.
Verificați mai întâi indicatorul sau expertul pe un cont DEMO, înainte de a-l cumpăra! Analizați-l bine!
Închiriaț
This indicator is a classic indicator of technical analysis - MACD. Unlike the classic MACD indicator, the presented indicator is calculated as follows: - the first smoothing signal is one of the standard methods used to create moving averages. - secondary smoothing method used in MAMA/FAMA indicators. - calculation of the difference between MAMA/FAMA values.
The indicator gives signals about a change in trend direction, as well as signals about weakening or strengthening of the trend. The ind
FREE
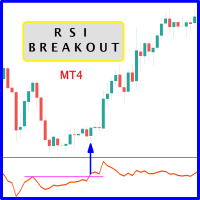
When prices breakout resistance levels are combined with Relative Strength Index "RSI" oscillator breaks out its historical resistance levels then probability emerges to record farther prices. It's strongly encouraged to confirm price breakout with oscillator breakout since they have comparable effects to price breaking support and resistance levels; surely, short trades will have the same perception. Concept is based on find swing levels which based on number of bars by each side to confi
FREE
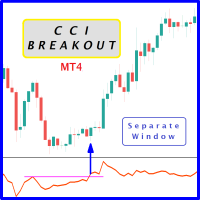
Probability emerges to record higher prices when Commodity Channel Index breaks out oscillator historical resistance level when exhibit overbought values. Since, oscillator breakout of support and resistance have similar effect as price breaks support and resistance levels, therefore, its highly advised to confirm price breakout with oscillator breakout; certainly, will have the same output in short trades. Concept is based on find swing levels which based on number of bars by each side of peak
FREE
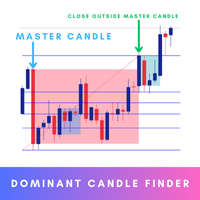
Dominant Candle Finder is a significant candlestick on a price chart that stands out due to its size, volume, or price movement compared to surrounding candles. It often indicates strong buying or selling pressure and can be used to identify potential reversal points, breakouts, or continuations in the market. Dominant candles can serve as key indicators for traders to make informed decisions, providing insights into market sentiment and potential future price movements. MT5 Version - https:

When prices breakout resistance levels are combined with Larry Williams' Percentage Range "WPR" oscillator breaks out its historical resistance levels then probability emerges to record farther prices. It's strongly encouraged to confirm price breakout with oscillator breakout since they have comparable effects to price breaking support and resistance levels; surely, short trades will have the same perception. Concept is based on find swing levels which based on number of bars by each side
FREE

When prices breakout resistance levels are combined with Larry Williams' Percent Range oscillator "WPR" breaks out its historical resistance levels then higher chances emerges to record farther prices. It's strongly encouraged to confirm price breakout with oscillator breakout since they have comparable effects to price breaking support and resistance levels; certainly short trades will have the same perception. Concept is based on find swing levels which based on number of bars by each side to
FREE
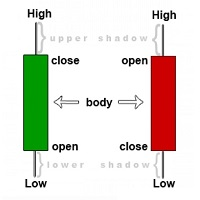
The indicator searches for candles on the price chart that are larger than those specified in the settings and marks them on the chart.
You can choose two types of candle size measurement (Units of Calculation): Points and Percentages. Points - size calculation will be in points. (for a five-digit quote point = 0.00001 and similarly for others)
Percentages - the candle size will be calculated as a percentage. You can also choose between which values to measure (Between Levels):
High/L
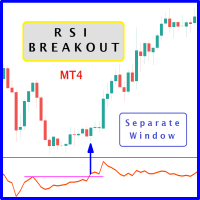
When prices breakout resistance levels are combined with Relative Strength Index oscillator "RSI" breaks out its historical resistance levels then higher chances emerges to record farther prices. It's strongly encouraged to confirm price breakout with oscillator breakout since they have comparable effects to price breaking support and resistance levels; certainly short trades will have the same perception. Concept is based on find swing levels which based on number of bars by each side to confir
FREE
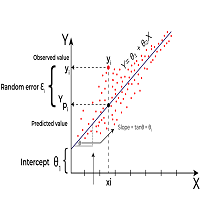
Linear Regression is a statistical method used to model the relationship between two or more variables. The primary goal of Linear Regression is to predict the value of one variable (called the dependent variable or outcome variable) based on the value of one or more other variables (called independent variables or explanatory variables) Linear Regression can be applied to technical analysis, and it is indeed one of the tools used by traders and analysts to make predictions and identify trends i
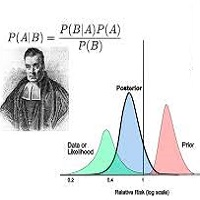
Bayesian methods can be effectively applied to predict price trends in financial markets, including Forex, stocks, and commodities. Here’s how Bayesian techniques can be used for trend prediction: 1. Bayesian Linear Regression Bayesian linear regression can be used to model the relationship between time and price. This method allows for the incorporation of prior beliefs about the trend and updates the trend as new data comes in. Example: Suppose you want to predict the price trend of a curren

Advance Currency Meter is a currency meter that detects strong market trends. This indicator is good for scalping, intraday trading and swing trading. The indicator will detect short term to long term market trends. This will give you good insight which currencies are best to trade as of the moment.
Note : Kindly contact me before you make any purchases. Works well with my MACD Currency Strength Meter
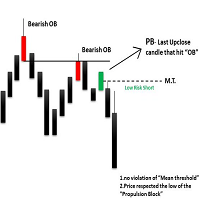
The ICT Propulsion Block indicator is meant to detect and highlight propulsion blocks, which are specific price structures introduced by the Inner Circle Trader (ICT).
Propulsion Blocks are essentially blocks located where prices interact with preceding order blocks. Traders often utilize them when analyzing price movements to identify potential turning points and market behavior or areas of interest in the market.
USAGE (fingure 1) An order block is a significant area on a pric

It is an indicator which notifies via push notification when an order is closed by Take Profit/Stop Loss It indicates via pc alert and or mobile alert Psychologically you can hold order for long time If stop loss hunting happens you can re-enter with same direction If real break out happens you can reverse the position Overall it Alerts when position reach stop - loss or take-profit level
FREE
Trend Analyser Pro is a versatile trend analysis tool designed for traders who want to capitalize on market trends across multiple timeframes. This indicator combines advanced trend detection, dynamic signals, and higher timeframe analysis to provide you with a comprehensive view of market movements, empowering you to make well-informed trading decisions. 50% DISCOUNT - ENDING SOON ! BONUS - Trend Analyser Pro TradingView Indicator - After you purchase or rent this product, please send m
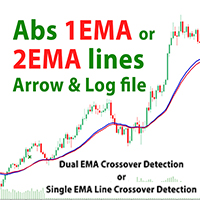
Product: 1 or 2 EMA Lines Crossover Indicator The 2 EMA Lines Crossover Indicator is a powerful and versatile tool designed for MetaTrader 4 (MT4) that helps traders identify potential buy and sell signals based on the crossover of two Exponential Moving Averages (EMAs). This indicator provides visual arrows on the chart to highlight trading opportunities, and it can also log these signals for further analysis. Whether you're a beginner or an experienced trader, this indicator can enhance your t
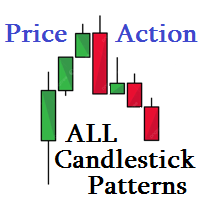
MetaTrader 4 (MT4) 的 CandlestickPatterns 指标是一个综合工具,旨在识别和突出交易图表上的关键蜡烛图模式。这个高度可定制的指标允许交易者选择显示哪些模式以及如何呈现它们,从而增强他们基于技术分析做出明智交易决策的能力。 功能 可定制的蜡烛图模式 该指标识别12种主要的蜡烛图模式,包括看涨和看跌模式。 用户可以根据他们的交易策略启用或禁用特定模式。 模式检测 看涨模式 :锤子,吞没形态,晨星,三只白色士兵,看涨的母子线,倒锤子。 看跌模式 :射击之星,看跌吞没,黄昏之星,三只乌鸦,看跌的母子线,吊人。 灵活的显示选项 每种模式都用箭头在图表上标记,以便于识别。 箭头用颜色标记(蓝色表示看涨模式,红色表示看跌模式),可以自定义大小和间距。 移动平均线 (MA) 集成 该指标包括一个可选的移动平均线,可以在图表上显示。 MA设置可以完全调整,包括周期、方法(SMA、EMA等)、时间框架和应用价格。 警报系统 该指标提供各种警报选项,包括屏幕消息、声音警报、推送通知和电子邮件警报。 可以配置警报,以在检测到特定数量的模式时触发,确保交易者不会错过重要的交易

SMT (Smart Money Technique) Divergence refers to the price divergence between correlated assets or their relationship to inversely correlated assets. By analyzing SMT Divergence, traders can gain insights into the market's institutional structure and identify whether smart money is accumulating or distributing assets. Every price fluctuation should be confirmed by market symmetry, and any price asymmetry indicates an SMT Divergence, suggesting a potential trend reversal. MT5 Version - https:/

HURRY! The offer price of $89 is ACTIVE ONLY for next 4 PURCHASES, after which the price will increase to $129. William Delbert Gann, commonly known as W.D. Gann, was an exceptional market analyst renowned for his unique trading style in the early 20th century. His trading techniques were based on a blend of mathematics, geometry, astrology, and ancient mathematics. Gann believed that stock market movements followed specific patterns and cycles, rather than being random. His methodologies, cel

GoTrend 多时间框架指标 "GoTrend Multi-Timeframe" 指标是交易员寻求快速高效地评估不同时间框架内货币对整体和具体趋势的必备工具。 此指标允许交易员一目了然地获得市场方向的清晰全面视图,优化决策过程并提高其交易策略的有效性。 主要特点: 多时间框架分析: 此指标提供六个不同时间框架的详尽分析:M5, M15, M30, H1, H4 和 D1,使交易员能够了解每个时间段的趋势。 集成技术指标: 此指标使用五个可靠的技术指标:RSI, SAR, MA, MACD 和 ADX,以确定每个时间框架的趋势方向。 清晰直观的可视化: 信号显示在主图表的选定角落,使用直观的符号和颜色。这使得交易员能够一目了然地评估市场情况。 组合信号: 除了每个指标的单个信号外,"GoTrend Multi-Timeframe" 还提供一个组合信号,总结该货币对的整体市场趋势。 交易优势: 快速清晰的趋势概览: 使用此指标,交易员可以快速清晰地看到多个时间框架内的趋势方向,这对于做出知情且及时的决策至关重要。 优化进出场点: 不同时间框架内的买卖信号帮助交易员优化进出场点,增加交易成
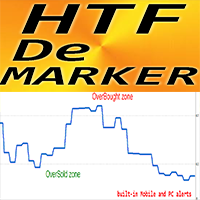
MT4 外汇指标 HTF DeMarker
该指标是技术交易者用来寻找入场点和出场点的有用工具。HTF 表示 - 更高时间框架。 DeMarker 振荡线表示当前价格相对于之前高点和低点的位置 DeMarker 提供其他振荡指标中最有效的常规发散信号 当 DeMarker 高于 0.7 时为超买区域,低于 0.3 时为超卖区域 指标具有内置移动和 PC 警报 该指标非常适合具有价格行动条目或与其他指标结合的多时间框架交易系统。 HTF DeMarker 指标允许您将更高时间框架的 DeMarker 附加到您当前的图表 --> 这是专业的交易方法
// 更多优秀的专家顾问和指标可在此处获得: https://www.mql5.com/en/users/def1380/seller // 也欢迎您加入有利可图、稳定可靠的信号 https://www.mql5.com/en/signals/1887493 这是仅在此 MQL5 网站上提供的原创产品。

MT4 外汇指标“HTF 布林带”
使用 MT4 专业指标“HTF 布林带”升级您的交易方法。HTF 表示 - 更高时间框架 布林带是市场上最好的指标之一 - 完美的交易工具 大约 90% 的价格行为发生在两个波段之间 HTF 布林带指标非常适合具有价格行为条目或与其他指标结合的多时间框架交易系统。
此指标允许您将更高时间框架的布林带附加到您当前的图表。
// 更多出色的专家顾问和指标可在此处获得: https://www.mql5.com/en/users/def1380/seller // 也欢迎您加入有利可图、稳定可靠的信号 https://www.mql5.com/en/signals/1887493 它是仅在此 MQL5 网站上提供的原创产品。
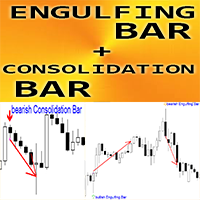
MT4 外汇指标“吞没条和盘整条形态”
指标“吞没条和盘整条形态”对于价格行为交易非常有效 指标可检测图表上的吞没条和盘整条: 看涨吞没条形态 - 图表上的绿色箭头信号 看跌吞没条形态 - 图表上的橙色箭头信号 看涨盘整条形态 - 图表上的蓝色箭头信号 看跌盘整条形态 - 图表上的红色箭头信号 无需重绘;无延迟;盘整条本身具有较高的 R/R 比率(回报/风险) 带有 PC、移动和电子邮件警报 指标“吞没条和盘整条模式”非常适合与支撑/阻力位结合使用: https://www.mql5.com/en/market/product/100903
// 更多出色的专家顾问和指标可在此处获得: https://www.mql5.com/en/users/def1380/seller // 也欢迎您加入有利可图、稳定可靠的信号 https://www.mql5.com/en/signals/1887493 它是仅在此 MQL5 网站上提供的原创产品。
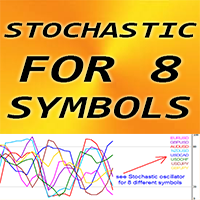
适用于 MT4 的外汇指标“8 个符号的随机指标”。
随机震荡指标是市场上最好的指标之一 - 是许多交易者的完美工具。 超买区域 - 高于 80;超卖区域 - 低于 20 非常适合从高于 80 的区域进行卖出,从低于 20 的区域进行买入 “8 个符号的随机指标”让您有机会在 1 张图表上控制多达 8 个不同符号的随机指标值 此指标也非常适合与价格行动条目结合使用。
// 更多出色的专家顾问和指标可在此处获得: https://www.mql5.com/en/users/def1380/seller // 也欢迎您加入有利可图、稳定可靠的信号 https://www.mql5.com/en/signals/1887493 它是仅在此 MQL5 网站上提供的原创产品。
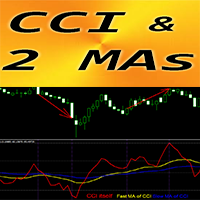
MT4 外汇指标“CCI 和 2 条移动平均线”
商品通道指数 (CCI) 非常适合趋势方向的动量交易。 “CCI 和 2 条移动平均线”指标可让您查看 CCI 指标的快速和慢速移动平均线 上升趋势 - 快速移动平均线位于慢速移动平均线上方;下降趋势 - 快速 MA 低于慢速 MA CCI 是交易中最受欢迎的震荡指标之一 - 它衡量当前价格与历史平均价格之间的差异 选项 1 - 从 50 到 -50 值的中心区域开始交易,当指标达到 200/-200 区域时退出 重要级别:+/-200,选项 2 - 从 +200 区域以上进入卖出,从 -200 以下进入买入 指标提供了很早就看到趋势变化的机会
// 更多优秀的专家顾问和指标可在此处获得: https://www.mql5.com/en/users/def1380/seller // 也欢迎您加入有利可图、稳定可靠的信号 https://www.mql5.com/en/signals/1887493 它是仅在此 MQL5 网站上提供的原创产品。

Tired of navigating the sea of uncertainties in the financial market? Imagine having an experienced guide by your side, helping you decipher the mysteries of charts and leading you confidently toward financial success. With StakBank, you'll have more than just a simple indicator in your hands. You'll have a complete arsenal of tools to make assertive and profitable decisions. But what makes StakBank so special? Volume: Understand the driving force behind market movements, accurately identifying
MetaTrader市场是 出售自动交易和技术指标的最好地方。
您只需要以一个有吸引力的设计和良好的描述为MetaTrader平台开发应用程序。我们将为您解释如何在市场发布您的产品将它提供给数以百万计的MetaTrader用户。
您错过了交易机会:
- 免费交易应用程序
- 8,000+信号可供复制
- 探索金融市场的经济新闻
注册
登录