YouTube'dan Mağaza ile ilgili eğitici videoları izleyin
Bir ticaret robotu veya gösterge nasıl satın alınır?
Uzman Danışmanınızı
sanal sunucuda çalıştırın
sanal sunucuda çalıştırın
Satın almadan önce göstergeyi/ticaret robotunu test edin
Mağazada kazanç sağlamak ister misiniz?
Satış için bir ürün nasıl sunulur?
MetaTrader 4 için yeni teknik göstergeler - 2
77.90 USD'DEN 37.90 USD'YE DÜŞEN İNDİRİM, 1 EYLÜL PAZAR GÜNÜNE KADAR GEÇERLİDİR "Forex Scanner" Nedir? "Forex Scanner", Forex piyasasında gerçek zamanlı olarak size kapsamlı bir genel bakış sağlamak için tasarlanmış güçlü bir ticaret aracıdır. Bu gelişmiş gösterge, birden fazla teknik göstergeden ve zaman dilimlerinden önemli verileri toplar, böylece ticaret fırsatlarını hızla belirlemenizi sağlar. Çok sayıda varlık ve parametreyi izlemek istiyorsanız, grafikler arasında geçiş yapmadan "Forex Sc
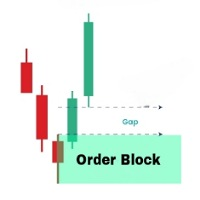
The OrderBlock Analyzer is a powerful custom MetaTrader 4 (MT4) indicator designed to detect and highlight critical Order Blocks on your price charts, helping you identify potential reversal points and key areas of market interest. Key Features: Order Block Detection: Automatically identifies bullish and bearish Order Blocks, marking areas where institutional traders are likely to enter or exit positions. Customizable Display: Choose your preferred colors and styles for bullish and bearish Order
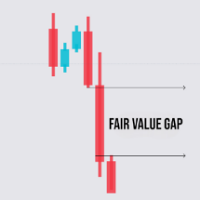
The FVG Analyzer is a custom indicator for MetaTrader 4 designed to detect and highlight Fair Value Gaps (FVG) on price charts. This tool allows traders to easily identify areas where value gaps have occurred, providing potential trading opportunities based on these gaps. Features: FVG Detection : Bullish FVG : Identifies bullish gaps where the high of the next candle is lower than the low of the previous candle. Bearish FVG : Detects bearish gaps where the low of the next candle is higher than
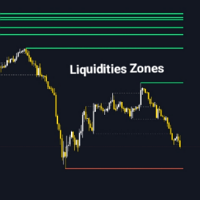
The Liquidity Zone Detector is an advanced technical indicator designed to identify and highlight key liquidity zones in the market using the ZigZag indicator. This tool pinpoints price levels where significant liquidity is likely present by drawing trendlines at the highs and lows detected by the ZigZag. The Liquidity Zone Detector assists traders in spotting potential reversal or trend continuation areas based on liquidity accumulation or release. Key Features: Automatic Liquidity Zone Identif
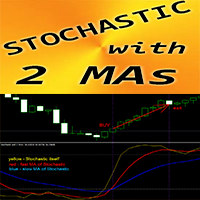
Forex Indicator " Stochastic and 2 Moving Averages" for MT4 Stochastic oscillator is one of the best indicators on the market - perfect tool for many traders. "S tochastic and 2 Moving Averages" Indicator allows you to see Fast and Slow Moving Averages of S tochastic oscillator OverBought zone - above 80; OverSold one - below 20 It is great to take Sell entries from above 80 zone and Buy entries from below 20 You can see Buy and Sell entry conditions on the pictures

Forex Indicator "Support Resistance Levels" for MT4 Indicator " Support Resistance Levels" is very useful auxiliary indicator for trading 'Support' and 'Resistance' are important zones on chart respected by price
Support level is where the price regularly stops falling and bounces back up
Resistance level is where the price normally stops rising and dips back down I ndicator " Support Resistance Levels" shows the recent levels: Resistance levels - red lines. S upport levels - blue lines
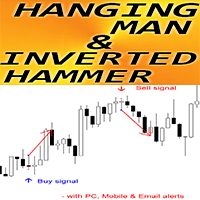
Forex Indicator " Hanging Man and Inverted Hammer pattern" for MT4 Indicator " Hanging Man and Inverted Hammer pattern " is very powerful indicator for Price Action trading : No repaint, No delays; Indicator detects bullish Inverted Hammer and bearish Hanging Man patterns on chart: Bullish Inverted Hammer - Blue arrow signal on chart (see pictures) Bearish Hanging Man - Red arrow signal on chart (see pictures) P C, Mobile & Email alerts are included Indicator " Hanging Man
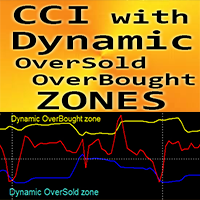
Forex Indicator " CCI with Dynamic OverSold/OverBought zones " for MT4. C ommodity Channel Index (CCI) is excellent for Momentum trading into the trend direction. It is great to take Sell entries from dynamic OverBought zone and Buy entries from dynamic OverSold zone into the direction of main trend T his indicator is excellent to combine with Price Action entries as well . D ynamic OverBought zone - above yellow line
Dynamic OverSold zone - below blue line
CCI oscill
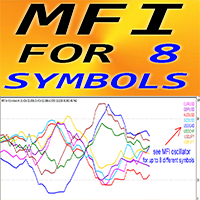
Forex Indicator "MFI for 8 Symbols" for MT4. M oney Flow Index (MFI) is a technical oscillator which uses price and volume data for identifying oversold and o verbought zones It is great to take Sell entries from Overbought when the MFI is above 80 and Buy entries from Oversold when it is below 2 0 MFI is very useful for divergence detection and it is great to combine with Price Action as well "MFI for 8 Symbols" gives opportunity to control MF I values of up to 8 diff

This indicator is not a guarantee of profitability but is designed to provide valuable insights and reduce the time spent analyzing charts, allowing you to focus on what matters most—your time.
The "Candle Info" indicator is designed to analyze and display specific candle formations directly on the chart within MetaTrader 4 (MT4). The indicator provides traders with visual cues about market sentiment by identifying various candle formations, such as Higher Highs, Lower Lows, Higher Lows, and
Imbalance is one of the important zones on the chart, to which the price will always strive to cover it. It is from the imbalance zone that the market most often makes significant reversals, rollbacks and gives entry points that you can successfully trade. In the Smart Money concept, the imbalance zone is used to find an entry point, as well as a place for take profit at the level of imbalance overlap by the price. Until the imbalance is overlapped, it is the closest target for the price. Ho
This indicator was created based on a multi-time trend monitoring system by combining several trend signals into 1 signal in the panel. This indicator is also equipped with an alert feature. Try to master how to reveal Fibo Weasel Candle Break Reetes to make it easier to use this indicator. for entry we only monitor the signal in the top left corner for the ongoing trend as a trading reference For the risk reward reference, we use the Fibo Weasel withdrawal reference which is in the same direct
FREE
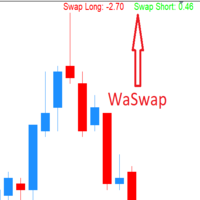
WaSwap MT4 Indicator shows the current Swap Long and current Swap Short with color.
* Set the Swap Threshold and the color to identify when the current swap is below or above the Spread Threshold.
* Set X axis and Y axis and chose the Corner and the Anchor to position the Swap Label on the chart.
* Write the font and the font size for more confort.
* Activate alert if the current Swap Long or the current Swap Short is below the swap threshold.
* The user will never swing with a negati
FREE
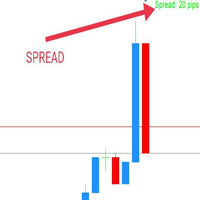
WaSpread MT4 Indicator shows the current spread in pips with color.
* Set the Spread Threshold and the color to identify when the current spread is below or above the Spread Threshold.
* Set X axis and Y axis and chose the Corner and the Anchor to position the Spread Label on the chart.
* Write the font and the font size for more confort.
* Activate alert if the current spread is above the spread threshold.
* For more precision, the user can choose to show the decimal numbers.
* The
FREE
A Full Concept of BUY/SELL Scalping Strategy Trend detection is one of the basic challenges of every trader. Finding a way to tell when to enter a trade is very important, timing is a game changer, not too early and not too late. Sometimes, due to not knowing the market conditions, the trader closes his positions with a small profit or allows the losses to grow, these are the mistakes that novice traders make. Indicator Trend Whipper is a complete trading strategy and can improve the trader's tr

The indicator monitors price movements in relation to a dynamic trailing stop line derived from the Average True Range (ATR). The trailing stop line adjusts based on market volatility, with the ATR determining the distance of the stop from the current price. This allows the stop to widen during periods of high volatility and tighten during calmer market conditions. The indicator tracks how the price interacts with this trailing stop line, marking potential reversal points when the price crosses
FREE

Divergence Divergence refers to when the price of a currency pair moves in one direction while the trend indicator is moving in the opposite direction. With divergence, there can be positive and negative signals. Divergences in Forex trading are quite common signals of technical analysis. These are basic early Forex signals indicating the trend reversal and filter false signals. Application of this indicator It is usually not easy to detect divergences by the trader and it may be time-consuming

he "Super Trampoline" is an innovative trading indicator designed to simplify decision-making in financial markets. It analyzes chart data and provides clear and timely signals on when to buy or sell an asset, based on a proven strategy of candlestick pattern analysis. Product Advantages: Intuitive Interface : "Super Trampoline" integrates directly into your trading terminal, displaying signals as simple arrows on the chart. This means you don't need deep technical analysis knowledge to start us

Introducing "Super Transplant with Filter" — a game-changing tool for traders who value precision, reliability, and simplicity. This indicator combines advanced trend analysis techniques with intelligent signal filtering, allowing you to make decisions based on the most relevant data. Benefits of "Super Transplant with Filter": Accuracy in Every Trade : The indicator meticulously analyzes market data, identifying key trends while filtering out false signals. This enables you to make more informe
MACD Indicator The Moving Average Convergence and Divergence (MACD) is a trend following momentum indicator which shows the relationship between two moving averages that we chose and configure them on the indicator. The MACD is calculated by subtracting the 26-period exponential moving average and the 12 period D.A.M. These are the default parameters when you put the MACD indicator on the charts, and the period is usually 9 which means the last 9 candles. DT-Oscillator This is Robert C. Miner's
Scalping Strategy BUY SELL
Having a strategy in the market is one of the main conditions for trading. The presence of various and complicated indicators and tools sometimes makes trading difficult, and the user gets confused after trying various methods and gets stuck in a loss cycle, the result of which is usually clear. This indicator is a simple strategy based on the detection of pivots and short-term trends, which helps you to easily trade in trends. Sometimes a simple but efficient st

Adjustable Consecutive Fractals looks for 2 or more fractals in one direction and sends out a on screen alert, sound alert and push notification, for strong reversal points .
Adjustable Consecutive Fractals, shows the fractals on chart along with a color changing text for buy and sell signals when one or more fractals appear on one side of price.
Adjustable Consecutive Fractals is based Bill Williams Fractals . The standard Bill Williams fractals are set at a non adjustable 5 bars, BUT withe

The Binary Profit Maker,
This indicator works on MT4 and is very easy to use. When you receive a signal from it, you wait for that candle with the signal to close and you enter your trade at the beginning of the next new candle . A Up Purple arrow means Buy and a Down Purple arrow means Sell. All arrows comes with Alert like for easy identification of trade signal. Are you okay with that?
How To Enter Trade?
1 minute candle
1 minute expire

This indicator/dashboard , is place on a single symbol. It shows the percentage of movement withing all time frames from M1 to W1.The text will change green if all % are in the positive for a buy signal.The text will change red if all % are below zero and in negative for a sell signal. There are audible notifications, as well as on screen notifications along with push notifications that can be turned on and ON/OFF in the settings.
This is a sure way to Find trends quickly and efficiently, with
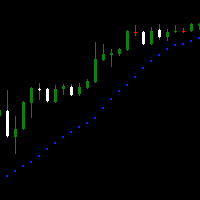
Доброго времени суток.
Вашему вниманию простой, но крайне удобный продукт для любителей индикатора Parabolic SAR . Он представляет собой окно осциллятора, на который выводится несколько тайм-фреймов в режими реального времени вместе с индикатором.
Настройки интуитивно понятные, что бы включать и отключать количество выбранных таймов - необходимо применять PERIOD_CURRENT, в таком случае дополнительный тайм не откроется.
Пишите в комментариях к продукту, что бы вы хотели увидеть в новых вер
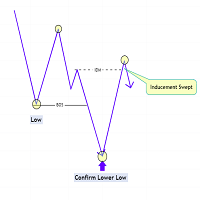
The Market Structure with Inducements & Sweeps indicator is a unique take on Smart Money Concepts related market structure labels that aims to give traders a more precise interpretation considering various factors.
Compared to traditional market structure scripts that include Change of Character (CHoCH) & Break of Structures (BOS) -- this script also includes the detection of Inducements (IDM) & Sweeps which are major components of determining other structures labeled on the chart.
SMC &
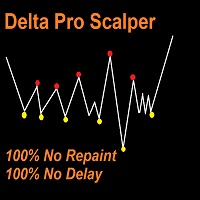
Delta Pro Scalper - Your Ultimate Trend Trading Solution, Delta Pro Scalper is a TREND indicator that automatically analyzes the market and provides information about the trend without redrawing or delay.
The indicator uses candlestick OHLC data and analyzing them to determine up trend or down trend, You MUST wait till closing candle, once the dot appear the next open candle you can open buy or sell position.
Red Dot = Bearish Trend (Open SELL)
Yellow Dot = Bullish Trend (Open BUY)
Here's t

Bomb Bank Signal: Your Trusted Indicator for MetaTrader 4
The Bomb Bank Signal is a powerful indicator for MetaTrader 4, designed to identify the most relevant trends in the financial market. If you are looking for a tool that accurately anticipates movements, Bomb Bank is the ally you need.
How it Works:
This indicator combines three distinct methods – volume analysis, candle closes and symmetrical trend – to detect and signal buying and selling opportunities. Bomb Bank is like a "bomb"
Follow Line göstergesi, piyasa eğilimlerini doğru bir şekilde belirlemek ve izlemek isteyen yatırımcılar için vazgeçilmez bir araçtır. Bu gösterge, fiyat değişimlerine dinamik olarak uyum sağlar ve fiyat hareketlerini düzgün ve sürekli bir şekilde izleyen bir çizgi çizer. Görsel sadeliği ve trend değişimlerini sinyallemede etkinliği ile Follow Line, her yatırımcının stratejisine mükemmel bir katkı sağlar. Ana Özellikler: Trend Takibi: Follow Line, fiyatı yakından takip eder ve yatırımcıların mev
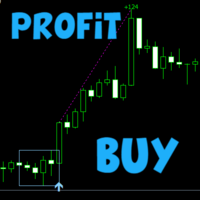
Scalper Box MT4
Fully ready strategy for trading on all markets (Stocks, Futures, Forex and Cryptocurrencies).
Indicator signals are not repaint!!!
Discounted price - 50$ (2 copies only) The next price is 99$
How to trade?
Wait for a signal from the indicator Scalper Box MT4 (blue arrow - buy, red arrow - sell).
After the signal we immediately enter the market, SL set behind the formed box.
Using trend filter indicator and template
Recommended timeframe:
M5 - Ideal for Sca
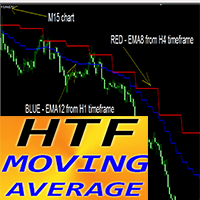
Forex Indicator HTF MOVING AVERAGE for MT4 Upgrade your trading methods with the professional HTF MA Indicator for MT4. H TF means - H igher Time Frame This indicator is excellent for Trend Traders with Price Action entries. HTF MA Indicator allows you to attach Moving Average from Higher time frame to your current chart. Indicator shows the trend from higher time frame --> this is always profitable method. HTF MA Indicator gives opportunity to get big profit with low risk. How to use
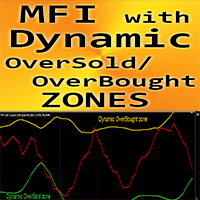
Forex Indicator " MFI with Dynamic OverSold/OverBought zones " for MT4. M oney Flow Index (MFI) is a technical oscillator which uses price and volume data for identifying oversold and o verbought zones It is great to take Sell entries from dynamic OverBought zone and Buy entries from dynamic OverSold zone MFI is very useful for divergence detection and it is great to combine with Price Action as well D ynamic OverBought zone - above yellow line
Dynamic OverSold zone - be
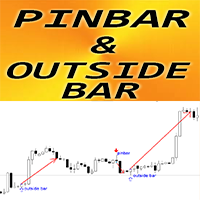
Forex Indicator " Pin Bar & Outside bar Patterns" for MT4 Indicator " Pin Bar & Outside Bar Patterns " is very powerful for Price Action trading Indicator detects Pin Bar and Outside bar Patterns on chart: Bullish pattern - Blue arrow signal on chart (see pictures) Bearish pattern - Red arrow signal on chart (see pictures) No repaint; No delays; with PC, Mobile & Email alerts Indicator "Pin Bar & Outside Bar Patterns " is excellent to combine with Support/Resistance Levels //
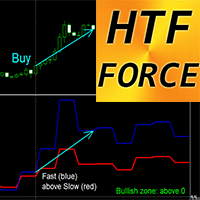
Forex Indicator HTF Force Oscillator for MT4 HTF Force is powerful indicator for Multi-Time Frame trading . HTF means - H igher Time Frame Force index is one of the top indicators that combines price and volume data into a single value Values from High time frame can show you the trend direction (downtrend - below 0; uptrend - above 0) Fast Force - Blue line, Slow Force - Red line Buy signal - Fast line crosses Slow line upward and both - above 0 (see picture) Sell signal - Fast line cr
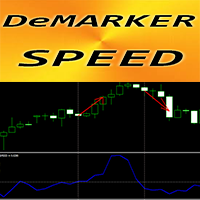
Forex Indicator " DeMarker Speed" for MT4 The calculation of this indicator is based on equations from physics. DeMarker Speed is the 1st derivative of DeMarker itself DeMarker oscillator curve indicates the current price position relative to previous highs and lows during the indicator calculation period
DeMarker Speed is good for scalping entries when standard DeMarker oscillator is in OverSold/OverBought zone (as on pictures) DeMarker Speed indicator shows how fast DeMarker itsel
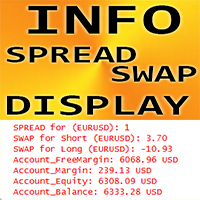
Forex Indicator "INFO Spread Swap Display" for MT4, Trading Support tool. INFO Spread Swap Display indicator shows current S pread and Swaps of forex pair where it is attached. It also indicates account Balance, Equity and Margins It is possible to locate indicator values in any corner of the chart: 0 - for top-left corner, 1 - top-right, 2 - bottom-left, 3 - bottom-right It is possible to set up color and font size as well // More great Expert Advisors and Indica
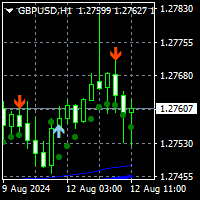
To get access to MT5 version please click here . This is the exact conversion from TradingView: " SSL Hybrid" by Mihkel00.
This is a light-load processing and non-repaint indicator. All input options are available. Buffers are available for processing in EAs. You can message in private chat for further information/changes you need. Thanks for downloading

YOU CAN NOW DOWNLOAD FREE VERSIONS OF OUR PAID INDICATORS . IT'S OUR WAY OF GIVING BACK TO THE COMMUNITY ! >>> GO HERE TO DOWNLOAD
V1 Scalper is an easy to use tool designed for trend scalping. It tries to spot good entry points in a major trend by using swing high and lows formed along the trend . This tool can be used on Fx Pairs , Indices , Commodities and stocks. Not often but in some signals , the arrow might repaint on the current candle so extra confirmation tools are advised for t
FREE
This indicator is designed for effective short-term trading and the most aggressive reinvestment of potential profits into new positions. The philosophy of its use involves entering based on the indicator signal and fixing profit/loss as quickly as possible when receiving an opposite indicator signal on an even shorter time period of the chart.
Thus, the algorithm for effectively using the presented indicator is as follows: 1. Wait for a buy/sell signal to appear. The signal appears at the mom

Features:
This is a slope indicator for TMA Bands indicator. It calculates slope of the center line. It supports 3 types of TMA Bands: TMA True (Non-repaint) Fast Line TMA (Repaints) TMA+CG (Repaints) It will help you determine whether price is Trending or Ranging based on the Threshold you set. Download extra TMA Indicators for strategy here: https://www.mql5.com/en/blogs/post/758718
How It Works: You can set the Slope Threshold for indicating Buy/Sell heightened levels. Suppose we set Thr
FREE

This indicator works on MT4 and is very easy to use. When you receive a signal from it, you wait for that candle with the signal to close and you enter your trade at the beginning of the next new candle . A red arrow means sell and a green arrow means buy. All arrows comes with Alert like for easy identification of trade signal. Are you okay with that?
1 minute candle
1 minute expire

Average Session Range MT4: Calculate and Average the Sessions High-Low Range of Specific Time Sessions Over Multiple Days. The Session Average Range is a sophisticated and precise tool designed to calculate the volatility of specific time sessions within the trading day. By meticulously analyzing the range between the high and low prices of a defined trading session over multiple days, this tool provides traders with a clear and actionable average range. **Note:** When the trading platform is cl
FREE
MetaTrader Mağaza, ticaret robotları ve teknik göstergelerin benzersiz bir deposudur.
Yatırımcılara sunduğumuz benzersiz hizmetler hakkında daha fazla bilgi edinmek için MQL5.community - Kullanıcı notunu okuyun: ticaret sinyallerini kopyalama, freelancerlar tarafından geliştirilen özel uygulamalar, ödeme sistemi aracılığıyla otomatik ödemeler ve MQL5 Bulut Ağı.
Ticaret fırsatlarını kaçırıyorsunuz:
- Ücretsiz ticaret uygulamaları
- İşlem kopyalama için 8.000'den fazla sinyal
- Finansal piyasaları keşfetmek için ekonomik haberler
Kayıt
Giriş yap
Gizlilik ve Veri Koruma Politikasını ve MQL5.com Kullanım Şartlarını kabul edersiniz
Hesabınız yoksa, lütfen kaydolun
MQL5.com web sitesine giriş yapmak için çerezlerin kullanımına izin vermelisiniz.
Lütfen tarayıcınızda gerekli ayarı etkinleştirin, aksi takdirde giriş yapamazsınız.