工作已完成
执行时间21 小时
客户反馈
Super fast and supportive developer!
员工反馈
Thank you for your trust!
指定
I have csv file with certain dates and times (60 min). Example of few lines in csv =>
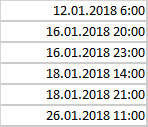
I need a tool (script, indicator) which takes my data and for 60m candle graph draws an arrow down above candle as indicated in my file . For each file load I should be able to chose color of arrows - i can load several csv files with different date_times. Since files may contain 2-3 years - i need simple way also to wipe the arrows (if not possible i can then just delete the chart).
反馈
1
等级
项目
632
26%
仲裁
89
73%
/
13%
逾期
12
2%
空闲
2
等级
项目
8
13%
仲裁
1
0%
/
100%
逾期
0
空闲
3
等级
项目
245
60%
仲裁
3
67%
/
0%
逾期
6
2%
工作中
4
等级
项目
143
34%
仲裁
10
10%
/
60%
逾期
26
18%
空闲
项目信息
预算
30+ USD
开发人员
27
USD
截止日期
到 1 天