Смотри, как быстро заказать торгового робота
Ознакомьтесь с правилами перед работой
Как заказать торгового робота на MQL5 и MQL4
Посмотри пример Технического задания для заказа робота
Работа завершена
Время выполнения 21 час
Отзыв от заказчика
Super fast and supportive developer!
Отзыв от исполнителя
Thank you for your trust!
Техническое задание
I have csv file with certain dates and times (60 min). Example of few lines in csv =>
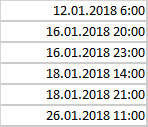
I need a tool (script, indicator) which takes my data and for 60m candle graph draws an arrow down above candle as indicated in my file . For each file load I should be able to chose color of arrows - i can load several csv files with different date_times. Since files may contain 2-3 years - i need simple way also to wipe the arrows (if not possible i can then just delete the chart).
Откликнулись
1
Оценка
Проекты
632
26%
Арбитраж
89
73%
/
13%
Просрочено
12
2%
Свободен
2
Оценка
Проекты
8
13%
Арбитраж
1
0%
/
100%
Просрочено
0
Свободен
3
Оценка
Проекты
244
60%
Арбитраж
3
67%
/
0%
Просрочено
6
2%
Работает
4
Оценка
Проекты
143
34%
Арбитраж
10
10%
/
60%
Просрочено
26
18%
Свободен
Информация о проекте
Бюджет
30+ USD
Исполнителю
27
USD
Сроки выполнения
до 1 дн.