트레이딩 로봇 주문 방법을 보십시오
주문을 실행하거나 포스트하기 전에 규칙을 읽으십시오
MQL5 및 MQL 4의 트레이딩 로봇을 주문하는 방법
로봇을 주문하기 위해샘플 요구 사항을 보십시오
카테고리의 새로운 주문:
150+ USD
35+ USD
작업 종료됨
실행 시간 21 시간
고객의 피드백
Super fast and supportive developer!
피고용인의 피드백
Thank you for your trust!
명시
I have csv file with certain dates and times (60 min). Example of few lines in csv =>
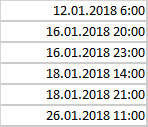
I need a tool (script, indicator) which takes my data and for 60m candle graph draws an arrow down above candle as indicated in my file . For each file load I should be able to chose color of arrows - i can load several csv files with different date_times. Since files may contain 2-3 years - i need simple way also to wipe the arrows (if not possible i can then just delete the chart).
응답함
1
등급
프로젝트
632
26%
중재
89
73%
/
13%
기한 초과
12
2%
무료
2
등급
프로젝트
8
13%
중재
1
0%
/
100%
기한 초과
0
무료
3
등급
프로젝트
245
60%
중재
3
67%
/
0%
기한 초과
6
2%
작업중
4
등급
프로젝트
143
34%
중재
10
10%
/
60%
기한 초과
26
18%
무료
프로젝트 정보
예산
30+ USD
개발자에게
27
USD
기한
로 1 일