Bir ticaret robotunun nasıl sipariş edileceğini izleyin
Bir sipariş vermeden veya bir siparişe başvurmadan önce kuralları okuyun
MQL5 ve MQL4'teki bir ticaret robotu nasıl sipariş edilir?
Bir robot sipariş etmek için örnek İş Gerekliliklerine bakın
Kategorideki yeni siparişler:
İş tamamlandı
Tamamlanma süresi: 21 saat
Müşteri tarafından geri bildirim
Super fast and supportive developer!
Geliştirici tarafından geri bildirim
Thank you for your trust!
İş Gereklilikleri
I have csv file with certain dates and times (60 min). Example of few lines in csv =>
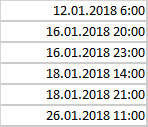
I need a tool (script, indicator) which takes my data and for 60m candle graph draws an arrow down above candle as indicated in my file . For each file load I should be able to chose color of arrows - i can load several csv files with different date_times. Since files may contain 2-3 years - i need simple way also to wipe the arrows (if not possible i can then just delete the chart).
Yanıtlandı
1
Derecelendirme
Projeler
632
26%
Arabuluculuk
89
73%
/
13%
Süresi dolmuş
12
2%
Serbest
2
Derecelendirme
Projeler
8
13%
Arabuluculuk
1
0%
/
100%
Süresi dolmuş
0
Serbest
3
Derecelendirme
Projeler
245
60%
Arabuluculuk
3
67%
/
0%
Süresi dolmuş
6
2%
Çalışıyor
4
Derecelendirme
Projeler
143
34%
Arabuluculuk
10
10%
/
60%
Süresi dolmuş
26
18%
Serbest
Proje bilgisi
Bütçe
30+ USD
Geliştirici için
27
USD
Son teslim tarihi
to 1 gün