Voir comment commander un robot de trading
Lisez les Règles avant de passer une commande ou de l'exécuter
Comment commander un robot de trading dans MQL5 et MQL4
Voir un exemple de spécification des exigences pour commander un robot
Nouvelles commandes dans la catégorie:
Tâche terminée
Temps d'exécution 21 heures
Commentaires du client
Super fast and supportive developer!
Commentaires de l'employé
Thank you for your trust!
Spécifications
I have csv file with certain dates and times (60 min). Example of few lines in csv =>
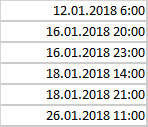
I need a tool (script, indicator) which takes my data and for 60m candle graph draws an arrow down above candle as indicated in my file . For each file load I should be able to chose color of arrows - i can load several csv files with different date_times. Since files may contain 2-3 years - i need simple way also to wipe the arrows (if not possible i can then just delete the chart).
Répondu
1
Évaluation
Projets
632
26%
Arbitrage
89
73%
/
13%
En retard
12
2%
Gratuit
2
Évaluation
Projets
8
13%
Arbitrage
1
0%
/
100%
En retard
0
Gratuit
3
Évaluation
Projets
245
60%
Arbitrage
3
67%
/
0%
En retard
6
2%
Travail
4
Évaluation
Projets
143
34%
Arbitrage
10
10%
/
60%
En retard
26
18%
Gratuit
Informations sur le projet
Budget
30+ USD
Pour le développeur
27
USD
Délais
à 1 jour(s)