
时间序列挖掘的数据标签(第2部分):使用Python制作带有趋势标记的数据集
概述
在上一篇文章中,我们介绍了如何通过观察图表上的趋势来标记数据,并将数据保存到“csv”文件中。在这一部分中,让我们以不同的方式思考:从数据本身开始。
我们将使用Python处理数据。为什么选择Python?因为它方便快捷,并不意味着它运行得很快,但Python庞大的库可以帮助我们大大缩短开发周期。
所以,我们开始吧!
目录:
选择哪个Python库
我们都知道Python有很多优秀的开发人员来提供各种各样的库,这让我们很容易进行开发,为我们节省了大量的开发时间。以下是我收集的一些相关的python库,其中一些库基于不同的架构,一些库可以用于交易,一些库可用于回测。它包括但不限于标注数据,感兴趣的可以尝试研究一下,本文不做详细介绍。
- statsmodels - Python模块,允许用户探索数据、估计统计模型和执行统计测试:http://statsmodels.sourceforge.net
- dynts - 用于时间序列分析和操作的Python包:https://github.com/quantmind/dynts
- PyFlux - 用于模型上的时间序列建模和推理(频率学家和贝叶斯)的Python库:https://github.com/RJT1990/pyflux
- tsfresh - 从时间序列中自动提取相关特征:https://github.com/blue-yonder/tsfresh
- hasura/quandl-metabase - Hasura快速启动,可视化Quandl的使用Metabase的时间序列数据集:https://platform.hasura.io/hub/projects/anirudhm/quandl-metabase-time-series
- Facebook Prophet - 为具有线性或非线性增长的多季节性的时间序列数据生成高质量预测的工具:https://github.com/facebook/prophet
- tsmoothie - 一个用于以矢量化方式进行时间序列平滑和异常值检测的python库:https://github.com/cerlymarco/tsmoothie
- pmdarima - 一个统计库,旨在填补Python时间序列分析功能的空白,包括R的auto.arima函数的等效功能:https://github.com/alkaline-ml/pmdarima
- gluon-ts - 使用Python为vProbabilistic时间序列建模:https://github.com/awslabs/gluon-ts
- gs quant - 用于量化金融的Python工具包:https://github.com/goldmansachs/gs-quant
- willowtree - 用于衍生品定价的健壮灵活的Python实现:https://github.com/federicomariamassari/willowtree
- financial-engineering - 使用 Python 的蒙特卡罗方法在金融工程项目中的应用:https://github.com/federicomariamassari/financial-engineering
- optlib - 用Python编写的金融期权定价库:https://github.com/dbrojas/optlib
- tf-quant-finance - 用于量化金融的高性能TensorFlow库:https://github.com/google/tf-quant-finance
- Q-Fin - 用于数学金融的Python库:https://github.com/RomanMichaelPaolucci/Q-Fin
- Quantsbin - 用于定价和绘制期权价格及其相关各种其他分析的工具:https://github.com/quantsbin/Quantsbin
- finoptions - R包fOptions的完整python实现,以及用于定价各种选项的fExoticOptions的部分实现:https://github.com/bbcho/finoptions-dev
- pypme - PME(公开市场等价物,Public Market Equivalent)计算:https://github.com/ymyke/pypme
- Blankly - 完全集成的回溯测试、纸面交易和实时部署:https://github.com/Blankly-Finance/Blankly
- TA-Lib - TA-Lib的Python封装(http://ta-lib.org/):https://github.com/mrjbq7/ta-lib
- zipline - Python算法交易库:https://github.com/quantopian/zipline
- QuantSoftware Toolkit - 基于Python的开源软件框架,旨在支持投资组合构建和管理:https://github.com/QuantSoftware/QuantSoftwareToolkit
- finta - Pandas实施的常见金融技术分析指标:https://github.com/peerchemist/finta
- Tulipy - 金融技术分析指标库(tulipindicators的Python绑定):https://github.com/cirla/tulipy
- lppls - 用于拟合对数周期幂律奇异性(LPPLS)模型的Python模块:https://github.com/Boulder-Investment-Technologies/lppls
使用MetaTrader5库从MT5客户端获取数据
当然,最基本的是你的电脑上已经安装了python,如果没有,作者不建议安装官方版本的python,而是更喜欢使用易于维护的Anaconda。但普通版的Anaconda体积巨大,集成了丰富的内容,包括可视化管理、编辑等,令人尴尬的是我几乎不用它们,所以我强烈推荐minincoda,简洁明了,简单实用。Miniconda官方网站地址:Miniconda::Anaconda.org/
1. 基本环境初始化
首先创建一个虚拟环境,然后打开Anaconda Promote,键入:
conda create -n Data_label python=3.10 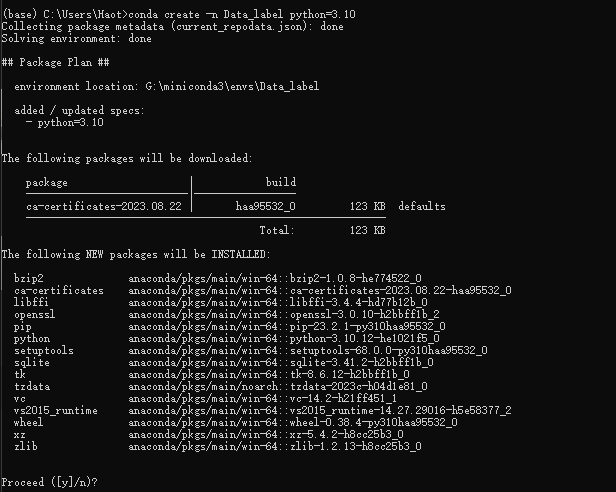
输入“y”并等待创建环境,然后键入:
conda activate Data_label
注意:当我们创建conda虚拟环境时,记得添加python=x.xx,否则我们在使用过程中会遇到莫名其妙的麻烦,这是一个吃过苦头的人的建议!
2. 安装必要的库
安装我们的基本库MetaTrader 5,在conda Promote中键入:
pip install MetaTrader5
安装 pytrendseries,在 conda Promote 中键入:
pip install pytrendseries
3. 创建python文件
打开MetaEditor,找到“工具”->“选项”,在“编译器”选项的python列中填写您的python路径,我自己的路径是“G:miniconda3\envs\Data_label”:
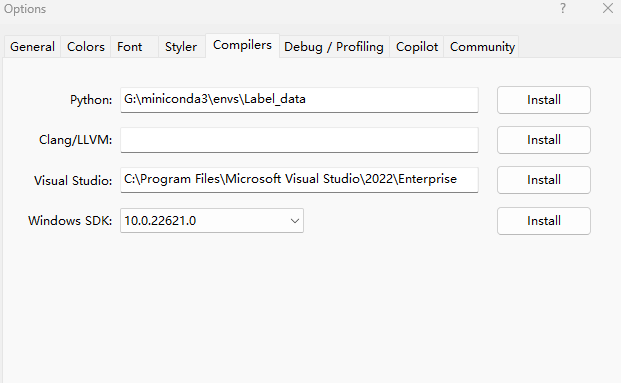
完成后,选择“文件”->“新建”(或Ctrl+N)创建一个新文件,并在弹出窗口中选择“Python脚本”,如下所示:

单击“下一步”并键入文件名,如下所示:
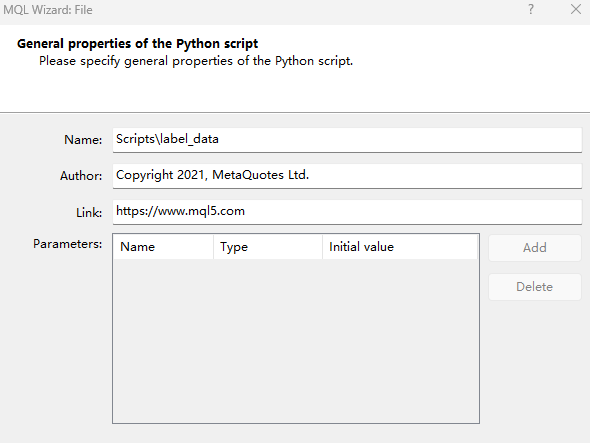
单击“确定”后,将显示以下窗口:

4. 连接客户端并获取数据
删除原来自动生成的代码,并将其替换为以下代码:
# Copyright 2021, MetaQuotes Ltd.
# https://www.mql5.com

import MetaTrader5 as mt

if not mt.initialize():
    print('initialize() failed!')
else:
   print(mt.version())
   mt.shutdown()
编译并运行以查看是否报告了任何错误,如果没有问题,将显示以下输出:

如果提示“initialize()failed!”,请在initialize()函数中添加参数路径,即客户端可执行文件的路径,如以下颜色加深代码所示:
# Copyright 2021, MetaQuotes Ltd.
# https://www.mql5.com

import MetaTrader5 as mt

if not mt.initialize("D:\\Project\\mt\\MT5\\terminal64.exe"):
    print('initialize() failed!')
else:
    print(mt.version())
    mt.shutdown()
一切就绪,让我们获取数据:
# Copyright 2021, MetaQuotes Ltd.
# https://www.mql5.com

import MetaTrader5 as mt

if not mt.initialize("D:\\Project\\mt\\MT5\\terminal64.exe"):
    print('initialize() failed!')
else:
   sb=mt.symbols_total()
   rts=None
   if sb > 0:
     rts=mt.copy_rates_from_pos("GOLD_micro",mt.TIMEFRAME_M15,0,10000)
   mt.shutdown()
   print(rts[0:5])
在上面的代码中,我们添加了“sb=mt.symbols_total()”以防止由于未检测到交易品种而报告错误,并添加了“copy_rates_from_pos(“GOLD_micro”,mt. TIMEFRAME_M15,0,10000)”,意思是从GOLD_micro的M15周期复制10000个柱,编译后将产生以下输出:
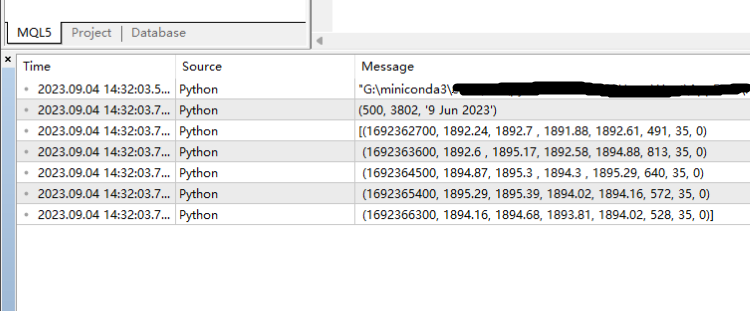
到目前为止,我们已经成功地从客户端那里获得了数据。
数据格式转换
虽然我们已经从客户那里获得了数据,但数据格式不是我们需要的。数据是“numpy.ndarray”,如下所示:
"[(1692368100, 1893.51, 1893.97,1893.08,1893.88,548, 35, 0)
(1692369000, 1893.88, 1894.51, 1893.41, 1894.51, 665, 35, 0)
(1692369900, 1894.5, 1894.91, 1893.25, 1893.62, 755, 35, 0)
(1692370800, 1893.68, 1894.7 , 1893.16, 1893.49, 1108, 35, 0)
(1692371700, 1893.5 , 1893.63, 1889.43, 1889.81, 1979, 35, 0)
(1692372600, 1889.81, 1891.23, 1888.51, 1891.04, 2100, 35, 0)
(1692373500, 1891.04, 1891.3 , 1889.75, 1890.07, 1597, 35, 0)
(1692374400, 1890.11, 1894.03, 1889.2, 1893.57, 2083, 35, 0)
(1692375300, 1893.62, 1894.94, 1892.97, 1894.25, 1692, 35, 0)
(1692376200, 1894.25, 1894.88, 1890.72, 1894.66, 2880, 35, 0)
(1692377100, 1894.67, 1896.69, 1892.47, 1893.68, 2930, 35, 0)
...(1693822500, 1943.97, 1944.28, 1943.24, 1943.31, 883, 35, 0)
(1693823400, 1943.25, 1944.13, 1942.95, 1943.4 , 873, 35, 0)
(1693824300, 1943.4, 1944.07, 1943.31, 1943.64, 691, 35, 0)
(1693825200, 1943.73, 1943.97, 1943.73, 1943.85, 22, 35, 0)]"
因此,让我们使用pandas进行转换,添加的代码用绿色标记:
# Copyright 2021, MetaQuotes Ltd.
# https://www.mql5.com

import MetaTrader5 as mt
import pandas as pd

if not mt.initialize("D:\\Project\\mt\\MT5\\terminal64.exe"):
    print('initialize() failed!')
else:
   print(mt.version())
   sb=mt.symbols_total()
   rts=None
   if sb > 0:
     rts=mt.copy_rates_from_pos("GOLD_micro",mt.TIMEFRAME_M15,0,1000)
   mt.shutdown()
   rts_fm=pd.DataFrame(rts)
现在再次查看数据格式,如下所示:
print(rts_fm.head(10)) 
td_data=rts_fm[['time','close']].set_index('time') 让我们看看前10行数据是什么样子的:
print(td_data.head(10))
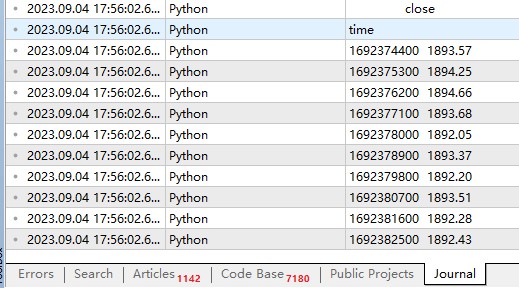
注意:“td_data”不是我们最后的数据样式,它只是我们获取数据趋势的过渡产品。
现在,我们的数据是完全可用的,但为了后续操作,最好将我们的日期格式转换为数据帧,因此我们应该在“td_data=rts_fom[['time','close']].set_index('time')”之前添加以下代码:
rts_fm['time']=pd.to_datetime(rts_fm['time'], unit='s')
我们的输出将如下所示:
| time | close |
|---|---|
| 2023-08-18 20:45:00 | 1888.82000 |
| 2023-08-18 21:00:00 | 1887.53000 |
| 2023-08-18 21:15:00 | 1888.10000 |
| 2023-08-18 21:30:00 | 1888.98000 |
| 2023-08-18 21:45:00 | 1888.37000 |
| 2023-08-18 22:00:00 | 1887.51000 |
| 2023-08-18 22:15:00 | 1888.21000 |
| 2023-08-18 22:30:00 | 1888.73000 |
| 2023-08-18 22:45:00 | 1889.12000 |
| 2023-08-18 23:00:00 | 1889.20000 |
本节的完整代码:
# Copyright 2021, MetaQuotes Ltd.
# https://www.mql5.com

import MetaTrader5 as mt
import pandas as pd

if not mt.initialize("D:\\Project\\mt\\MT5\\terminal64.exe"):
    print('initialize() failed!')
else:
   print(mt.version())
   sb=mt.symbols_total()
   rts=None
   if sb > 0:
     rts=mt.copy_rates_from_pos("GOLD_micro",mt.TIMEFRAME_M15,0,1000)
   mt.shutdown()
   rts_fm=pd.DataFrame(rts)
   rts_fm['time']=pd.to_datetime(rts_fm['time'], unit='s')
   td_data=rts_fm[['time','close']].set_index('time')
   print(td_data.head(10))
标注数据
1. 获取趋势数据
首先导入“pytrendseries”包:
import pytrendseries as pts 我们使用“pts.detecttrend()”函数来查找趋势,然后为该函数定义“td”变量,该参数有两个选项-“downtrend”或“uptrend”:
td='downtrend' # or "uptrend"
我们需要另一个参数“wd”作为趋势的最大周期:
wd=120 还有一个参数可以定义,也可以不定义,但我个人认为最好定义它,这个参数指定了趋势的最小周期:
limit=6 现在我们可以将参数填充到函数中以获得趋势:
trends=pts.detecttrend(td_data,trend=td,limit=limit,window=wd)
然后检查结果:
print(trends.head(15))
| from | to | price0 | price1 | index_from | index_to | time_span | drawdown | |
|---|---|---|---|---|---|---|---|---|
| 1 | 2023-08-21 01:00:00 | 2023-08-21 02:15:00 | 1890.36000 | 1889.24000 | 13 | 18 | 5 | 0.00059 |
| 2 | 2023-08-21 03:15:00 | 2023-08-21 04:45:00 | 1890.61000 | 1885.28000 | 22 | 28 | 6 | 0.00282 |
| 3 | 2023-08-21 08:00:00 | 2023-08-21 13:15:00 | 1893.30000 | 1886.86000 | 41 | 62 | 21 | 0.00340 |
| 4 | 2023-08-21 15:45:00 | 2023-08-21 17:30:00 | 1896.99000 | 1886.16000 | 72 | 79 | 7 | 0.00571 |
| 5 | 2023-08-21 20:30:00 | 2023-08-21 22:30:00 | 1894.77000 | 1894.12000 | 91 | 99 | 8 | 0.00034 |
| 6 | 2023-08-22 04:15:00 | 2023-08-22 05:45:00 | 1896.19000 | 1894.31000 | 118 | 124 | 6 | 0.00099 |
| 7 | 2023-08-22 06:15:00 | 2023-08-22 07:45:00 | 1896.59000 | 1893.80000 | 126 | 132 | 6 | 0.00147 |
| 8 | 2023-08-22 13:00:00 | 2023-08-22 16:45:00 | 1903.38000 | 1890.17000 | 153 | 168 | 15 | 0.00694 |
| 9 | 2023-08-22 19:00:00 | 2023-08-22 21:15:00 | 1898.08000 | 1896.25000 | 177 | 186 | 9 | 0.00096 |
| 10 | 2023-08-23 04:45:00 | 2023-08-23 06:00:00 | 1901.46000 | 1900.25000 | 212 | 217 | 5 | 0.00064 |
| 11 | 2023-08-23 11:30:00 | 2023-08-23 13:30:00 | 1904.84000 | 1901.42000 | 239 | 247 | 8 | 0.00180 |
| 12 | 2023-08-23 19:45:00 | 2023-08-23 23:30:00 | 1919.61000 | 1915.05000 | 272 | 287 | 15 | 0.00238 |
| 13 | 2023-08-24 09:30:00 | 2023-08-25 09:45:00 | 1921.91000 | 1912.93000 | 323 | 416 | 93 | 0.00467 |
| 14 | 2023-08-25 15:00:00 | 2023-08-25 16:30:00 | 1919.88000 | 1913.30000 | 437 | 443 | 6 | 0.00343 |
| 15 | 2023-08-28 04:15:00 | 2023-08-28 07:15:00 | 1916.92000 | 1915.07000 | 486 | 498 | 12 | 0.00097 |
您还可以通过函数“pts.vizplot.plot_trend()”得到结果图:
pts.vizplot.plot_trend(td_data,trends)
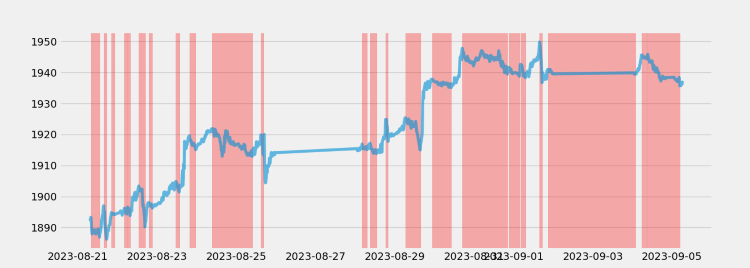
同样,我们可以通过代码来查看上升趋势:
td="uptrend"
wd=120
limit=6

trends=pts.detecttrend(td_data,trend=td,limit=limit,window=wd)
print(trends.head(15))
pts.vizplot.plot_trend(td_data,trends)
结果是:
| from | to | price0 | price1 | index_from | index_to | time_span | drawup | |
|---|---|---|---|---|---|---|---|---|
| 1 | 2023-08-18 22:00:00 | 2023-08-21 03:15:00 | 1887.51000 | 1890.61000 | 5 | 22 | 17 | 0.00164 |
| 2 | 2023-08-21 04:45:00 | 2023-08-22 10:45:00 | 1885.28000 | 1901.35000 | 28 | 144 | 116 | 0.00852 |
| 3 | 2023-08-22 11:15:00 | 2023-08-22 13:00:00 | 1898.78000 | 1903.38000 | 146 | 153 | 7 | 0.00242 |
| 4 | 2023-08-22 16:45:00 | 2023-08-23 19:45:00 | 1890.17000 | 1919.61000 | 168 | 272 | 104 | 0.01558 |
| 5 | 2023-08-23 23:30:00 | 2023-08-24 09:30:00 | 1915.05000 | 1921.91000 | 287 | 323 | 36 | 0.00358 |
| 6 | 2023-08-24 15:30:00 | 2023-08-24 17:45:00 | 1912.97000 | 1921.24000 | 347 | 356 | 9 | 0.00432 |
| 7 | 2023-08-24 23:00:00 | 2023-08-25 01:15:00 | 1916.41000 | 1917.03000 | 377 | 382 | 5 | 0.00032 |
| 8 | 2023-08-25 03:15:00 | 2023-08-25 04:45:00 | 1915.20000 | 1916.82000 | 390 | 396 | 6 | 0.00085 |
| 9 | 2023-08-25 09:45:00 | 2023-08-25 17:00:00 | 1912.93000 | 1920.03000 | 416 | 445 | 29 | 0.00371 |
| 10 | 2023-08-25 17:45:00 | 2023-08-28 18:30:00 | 1904.37000 | 1924.86000 | 448 | 543 | 95 | 0.01076 |
| 11 | 2023-08-28 20:00:00 | 2023-08-29 06:30:00 | 1917.74000 | 1925.41000 | 549 | 587 | 38 | 0.00400 |
| 12 | 2023-08-29 10:00:00 | 2023-08-29 12:45:00 | 1922.00000 | 1924.21000 | 601 | 612 | 11 | 0.00115 |
| 13 | 2023-08-29 15:30:00 | 2023-08-30 17:00:00 | 1914.98000 | 1947.79000 | 623 | 721 | 98 | 0.01713 |
| 14 | 2023-08-30 23:45:00 | 2023-08-31 04:45:00 | 1942.09000 | 1947.03000 | 748 | 764 | 16 | 0.00254 |
| 15 | 2023-08-31 09:30:00 | 2023-08-31 15:00:00 | 1943.52000 | 1947.00000 | 783 | 805 | 22 | 0.00179 |

2.标记数据
1). 分析数据格式
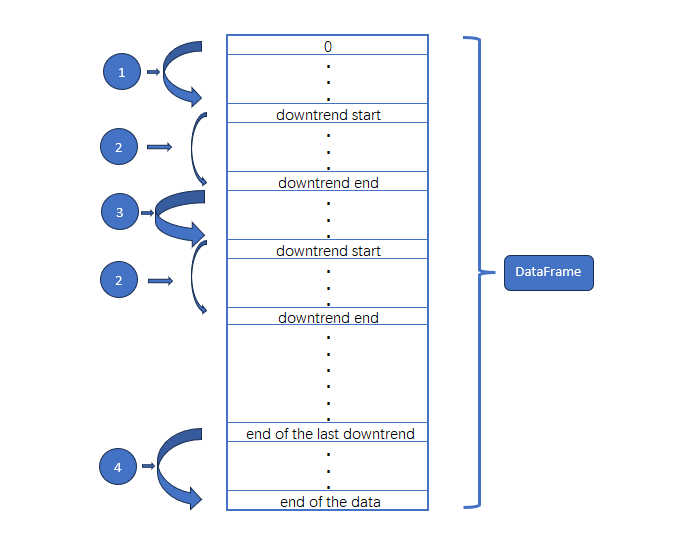
① 意味着数据的开始到第一个下降趋势的开始,让我们假设这是一个上升趋势;
② 指下降趋势
③ 是指数据中间的上升趋势;
④ 意味着上一次下跌趋势的结束。
因此,我们必须实现这四个部分的标记逻辑。
2). 标记逻辑
让我们从定义一些基本变量开始:
rts_fm['trend']=0
rts_fm['trend_index']=0
max_len_rts=len(rts_fm)
max_len=len(trends)
last_start=0
last_end=0
使用for循环遍历“trends”变量,以获得每条数据的开始和结束:
for trend in trends.iterrows():
        pass
获取每个段的开始索引和结束索引:
for trend in trends.iterrows():
    start=trend[1]['index_from']
    end=trend[1]['index_to']
因为rts_fom[“trend”]本身已经初始化为0,所以没有必要更改上升趋势的“trend(趋势)”列,但我们需要看看数据的开始是否是下降趋势,如果不是下降趋势,我们假设它是上升趋势:
for trend in trends.iterrows():
    start=trend[1]['index_from']
    end=trend[1]['index_to']

    if trend[0]==1 and start!=0:
        # Since the rts_fm["trend"] itself has been initialized to 0, there is no need to change the "trend" column
        rts_fm['trend_index'][0:start]=list(range(0,start))
与数据开始时一样,我们需要看看数据结束时是否以下降趋势结束:
for trend in trends.iterrows():
    start=trend[1]['index_from']
    end=trend[1]['index_to']

    if trend[0]==1 and start!=0:
        # Since the rts_fm["trend"] itself has been initialized to 0, there is no need to change the "trend" column
        rts_fm['trend_index'][0:start]=list(range(0,start))
    elif trend[0]==max_len and end!=max_len_rts-1:
	#we need to see if it ends in a downtrend at the end of the data
        rts_fm['trend_index'][last_end+1:len(rts_fm)]=list(range(0,max_len_rts-last_end-1))
处理除数据开始和结束之外的上升趋势段:
for trend in trends.iterrows():
    start=trend[1]['index_from']
    end=trend[1]['index_to']

    if trend[0]==1 and start!=0:
        # Since the rts_fm["trend"] itself has been initialized to 0, there is no need to change the "trend" column
        rts_fm['trend_index'][0:start]=list(range(0,start))
    elif trend[0]==max_len and end!=max_len_rts-1:
        #we need to see if it ends in a downtrend at the end of the data
        rts_fm['trend_index'][last_end+1:len(rts_fm)]=list(range(0,max_len_rts-last_end-1))
    else:
        #Process the uptrend segments other than the beginning and end of the data
        rts_fm["trend_index"][last_end+1:start]=list(range(0,start-last_end-1))
处理下降趋势的每个部分:
for trend in trends.iterrows():
    start=trend[1]['index_from']
    end=trend[1]['index_to']

    if trend[0]==1 and start!=0:
        # Since the rts_fm["trend"] itself has been initialized to 0, there is no need to change the "trend" column
        rts_fm['trend_index'][0:start]=list(range(0,start))
    elif trend[0]==max_len and end!=max_len_rts-1:
        #we need to see if it ends in a downtrend at the end of the data
        rts_fm['trend_index'][last_end+1:len(rts_fm)]=list(range(0,max_len_rts-last_end-1))
    else:
        #Process the uptrend segments other than the beginning and end of the data
        rts_fm["trend_index"][last_end+1:start]=list(range(0,start-last_end-1))

    #Process each segments of the downtrend
    rts_fm["trend"][start:end+1]=1
    rts_fm["trend_index"][start:end+1]=list(range(0,end-start+1))
    last_start=start
    last_end=end
3). 补充
我们假设数据的开头和结尾是上升趋势的,如果您认为这不够精确,也可以删除开头和结尾部分。为此,请在for循环结束后添加以下代码:
rts_fm['trend']=0
rts_fm['trend_index']=0
max_len_rts=len(rts_fm)
max_len=len(trends)
last_start=0
last_end=0
for trend in trends.iterrows():
    start=trend[1]['index_from']
    end=trend[1]['index_to']

    if trend[0]==1 and start!=0:
        # Since the rts_fm["trend"] itself has been initialized to 0, there is no need to change the "trend" column
        rts_fm['trend_index'][0:start]=list(range(0,start))
    elif trend[0]==max_len and end!=max_len_rts-1:
        #we need to see if it ends in a downtrend at the end of the data
        rts_fm['trend_index'][last_end+1:len(rts_fm)]=list(range(0,max_len_rts-last_end-1))
    else:
        #Process the uptrend segments other than the beginning and end of the data
        rts_fm["trend_index"][last_end+1:start]=list(range(0,start-last_end-1))

    #Process each segments of the downtrend
    rts_fm["trend"][start:end+1]=1
    rts_fm["trend_index"][start:end+1]=list(range(0,end-start+1))
    last_start=start
    last_end=end
rts_fm=rts_fm.iloc[trends.iloc[0,:]['index_from']:end,:]
3.检验
一旦我们完成了这项工作,让我们看看我们的数据是否符合我们的预期(该示例只查看前25条数据):
rts_fm.head(25) | time | open | high | low | close | tick_volume | spread | real_volume | trend | trend_index | |
|---|---|---|---|---|---|---|---|---|---|---|
| 0 | 2023-08-22 11:30:00 | 1898.80000 | 1899.72000 | 1898.22000 | 1899.30000 | 877 | 35 | 0 | 0 | 0 |
| 1 | 2023-08-22 11:45:00 | 1899.31000 | 1899.96000 | 1898.84000 | 1899.81000 | 757 | 35 | 0 | 0 | 1 |
| 2 | 2023-08-22 12:00:00 | 1899.86000 | 1900.50000 | 1899.24000 | 1900.01000 | 814 | 35 | 0 | 0 | 2 |
| 3 | 2023-08-22 12:15:00 | 1900.05000 | 1901.26000 | 1899.99000 | 1900.48000 | 952 | 35 | 0 | 0 | 3 |
| 4 | 2023-08-22 12:30:00 | 1900.48000 | 1902.44000 | 1900.17000 | 1902.19000 | 934 | 35 | 0 | 0 | 4 |
| 5 | 2023-08-22 12:45:00 | 1902.23000 | 1903.59000 | 1902.21000 | 1902.64000 | 891 | 35 | 0 | 0 | 5 |
| 6 | 2023-08-22 13:00:00 | 1902.69000 | 1903.94000 | 1902.24000 | 1903.38000 | 873 | 35 | 0 | 1 | 0 |
| 7 | 2023-08-22 13:15:00 | 1903.40000 | 1904.29000 | 1901.71000 | 1902.08000 | 949 | 35 | 0 | 1 | 1 |
| 8 | 2023-08-22 13:30:00 | 1902.10000 | 1903.37000 | 1902.08000 | 1902.63000 | 803 | 35 | 0 | 1 | 2 |
| 9 | 2023-08-22 13:45:00 | 1902.64000 | 1902.75000 | 1901.75000 | 1901.80000 | 1010 | 35 | 0 | 1 | 3 |
| 10 | 2023-08-22 14:00:00 | 1901.79000 | 1902.47000 | 1901.33000 | 1901.96000 | 800 | 35 | 0 | 1 | 4 |
| 11 | 2023-08-22 14:15:00 | 1901.94000 | 1903.04000 | 1901.72000 | 1901.73000 | 785 | 35 | 0 | 1 | 5 |
| 12 | 2023-08-22 14:30:00 | 1901.71000 | 1902.62000 | 1901.66000 | 1902.38000 | 902 | 35 | 0 | 1 | 6 |
| 13 | 2023-08-22 14:45:00 | 1902.38000 | 1903.23000 | 1901.96000 | 1901.96000 | 891 | 35 | 0 | 1 | 7 |
| 14 | 2023-08-22 15:00:00 | 1901.94000 | 1903.25000 | 1901.64000 | 1902.41000 | 1209 | 35 | 0 | 1 | 8 |
| 15 | 2023-08-22 15:15:00 | 1902.39000 | 1903.00000 | 1898.97000 | 1899.87000 | 1971 | 35 | 0 | 1 | 9 |
| 16 | 2023-08-22 15:30:00 | 1899.86000 | 1901.17000 | 1896.72000 | 1896.85000 | 2413 | 35 | 0 | 1 | 10 |
| 17 | 2023-08-22 15:45:00 | 1896.85000 | 1898.15000 | 1896.12000 | 1897.26000 | 2010 | 35 | 0 | 1 | 11 |
| 18 | 2023-08-22 16:00:00 | 1897.29000 | 1897.45000 | 1895.52000 | 1895.97000 | 2384 | 35 | 0 | 1 | 12 |
| 19 | 2023-08-22 16:15:00 | 1895.96000 | 1896.31000 | 1893.87000 | 1894.48000 | 1990 | 35 | 0 | 1 | 13 |
| 20 | 2023-08-22 16:30:00 | 1894.43000 | 1894.60000 | 1892.64000 | 1893.38000 | 2950 | 35 | 0 | 1 | 14 |
| 21 | 2023-08-22 16:45:00 | 1893.48000 | 1894.17000 | 1888.94000 | 1890.17000 | 2970 | 35 | 0 | 1 | 15 |
| 22 | 2023-08-22 17:00:00 | 1890.19000 | 1894.53000 | 1889.94000 | 1894.20000 | 2721 | 35 | 0 | 0 | 0 |
| 23 | 2023-08-22 17:15:00 | 1894.18000 | 1894.73000 | 1891.51000 | 1891.71000 | 1944 | 35 | 0 | 0 | 1 |
| 24 | 2023-08-22 17:30:00 | 1891.74000 | 1893.70000 | 1890.91000 | 1893.59000 | 2215 | 35 | 0 | 0 | 2 |
您可以看到,我们成功地将趋势类型和趋势指数标记添加到数据中。
4. 保存文件
我们可以将数据保存为我们想要的大多数文件格式,您可以使用to_json()方法保存为JSON文件,也可以使用to_html()方法保存为HTML文件,等等。这里只使用保存为CSV文件作为演示,在要添加的代码末尾:
rts_fm.to_csv('GOLD_micro_M15.csv') 手动校对
目前,我们已经做了基础性的工作,但如果我们想获得更精确的数据,我们需要进一步的人为干预,我们在这里只指出几个方向,而不会进行详细的论证。
1.数据完整性检查
完整性是指数据信息是否缺失,可能是整个数据的缺失,也可能是数据中没有字段。数据完整性是数据质量最基本的评估标准之一。例如,如果M15时期股市数据中的前一个数据与下一个数据相差2小时,那么我们需要使用相应的工具来完成数据。当然,从我们的客户端获取外汇数据或股市数据通常很困难,但如果您从其他来源获取时间序列,如交通数据或天气数据,则需要特别注意这种情况。
数据质量的完整性相对容易评估,通常可以通过数据统计中的记录值和唯一值来评估。例如,如果上一期的股价数据收盘价为1000,但下一期的开盘价变为10,则需要检查数据是否丢失。
2.检查数据标注的准确性
从本文的角度来看,我们上面实现的数据标注方法可能存在一定的漏洞,我们不仅可以依靠pytrendseries库中提供的方法来获得准确的标注数据,还需要将数据可视化,观察数据的趋势分类是否过于敏感或迟钝,从而遗漏了一些关键信息,此时我们需要对数据进行分析,如果应该分解,则分解,如果应该合并,则需要合并。这项工作需要大量的精力和时间才能完成,这里暂时没有提供具体的例子。
准确性是指数据中记录的信息是否准确,数据中记录信息是否异常或错误。与一致性不同,存在准确性问题的数据不仅仅是规则中的不一致。一致性问题可能是由数据日志记录规则不一致引起的,但不一定是错误。
3.做一些基本的统计验证,看看标注是否合理
- 完整性分布:快速直观地查看数据集的完整性。
- 热图:热图使观察两个变量之间的相关性变得容易。
- 层次聚类:你可以看到不同类别的数据是紧密相关的还是分散的。
汇总
参考: GitHub - rafa-rod/pytrendseries
完整的代码如下所示:
# Copyright 2021, MetaQuotes Ltd.
# https://www.mql5.com

import MetaTrader5 as mt
import pandas as pd
import pytrendseries as pts

if not mt.initialize("D:\\Project\\mt\\MT5\\terminal64.exe"):
    print('initialize() failed!')
else:
   print(mt.version())
   sb=mt.symbols_total()
   rts=None
   if sb > 0:
     rts=mt.copy_rates_from_pos("GOLD_micro",mt.TIMEFRAME_M15,0,1000)
   mt.shutdown()
   rts_fm=pd.DataFrame(rts)
   rts_fm['time']=pd.to_datetime(rts_fm['time'], unit='s')
   td_data=rts_fm[['time','close']].set_index('time')
   # print(td_data.head(10))

td='downtrend' # or "uptrend"
wd=120
limit=6

trends=pts.detecttrend(td_data,trend=td,limit=limit,window=wd)
# print(trends.head(15))
# pts.vizplot.plot_trend(td_data,trends)

rts_fm['trend']=0
rts_fm['trend_index']=0
max_len_rts=len(rts_fm)
max_len=len(trends)
last_start=0
last_end=0
for trend in trends.iterrows():
    start=trend[1]['index_from']
    end=trend[1]['index_to']

    if trend[0]==1 and start!=0:
        # Since the rts_fm["trend"] itself has been initialized to 0, there is no need to change the "trend" column
        rts_fm['trend_index'][0:start]=list(range(0,start))
    elif trend[0]==max_len and end!=max_len_rts-1:
        #we need to see if it ends in a downtrend at the end of the data
        rts_fm['trend_index'][last_end+1:len(rts_fm)]=list(range(0,max_len_rts-last_end-1))
    else:
        #Process the uptrend segments other than the beginning and end of the data
        rts_fm["trend_index"][last_end+1:start]=list(range(0,start-last_end-1))

    #Process each segments of the downtrend
    rts_fm["trend"][start:end+1]=1
    rts_fm["trend_index"][start:end+1]=list(range(0,end-start+1))
    last_start=start
    last_end=end
#rts_fm=rts_fm.iloc[trends.iloc[0,:]['index_from']:end,:]
rts_fm.to_csv('GOLD_micro_M15.csv')
注意:
1.请记住,如果您在mt.initialize()函数中添加路径,如下所示:mt.initilize(“D:\\Project\\mt\\MT5\\terminal64.exe”),请确保将其替换为您自己的客户端可执行文件的位置,而不是我的位置。
2.如果找不到'GOLD_micro_M15.csv'文件,请在客户端根目录中查找,例如,我的文件位于路径:“D:\\Project\\mt\\MT5\\”中。
感谢您的耐心阅读,希望您有所收获,祝您生活愉快,下一章再见!
本文由MetaQuotes Ltd译自英文
原文地址: https://www.mql5.com/en/articles/13253