YouTube'dan Mağaza ile ilgili eğitici videoları izleyin
Bir alım-satım robotu veya gösterge nasıl satın alınır?
Uzman Danışmanınızı
sanal sunucuda çalıştırın
sanal sunucuda çalıştırın
Satın almadan önce göstergeyi/alım-satım robotunu test edin
Mağazada kazanç sağlamak ister misiniz?
Satış için bir ürün nasıl sunulur?
MetaTrader 5 için yeni teknik göstergeler

MonetTrend — Премиум-индикатор для торговли по тренду (M30, H1, H4)
MonetTrend — это мощный и визуально понятный трендовый индикатор, созданный для торговли на таймфреймах M30, H1 и H4. Он идеально подходит для работы с волатильными инструментами, такими как: • Золото (XAUUSD) • Криптовалюты (BTCUSD) • Валютные пары (EURUSD, USDJPY и др.)
Ключевые особенности MonetTrend: • Автоматическое отображение Take Profit 1 (TP1) и Stop Loss (SL): После появления сигнала индикатор сразу показывает: • TP
Haven CBDR , ICT "Central Bank Dealers Range" (CBDR) fiyat aralığını grafikte gösteren kullanımı kolay bir göstergedir. Program, CBDR fiyat aralığını vurgulayan dikdörtgenler çizer ve ayrıca destek ve direnç seviyelerini değerlendirmek için standart sapma çizgilerini gösterir. Ürün, CBDR zaman aralığını, görüntülenecek takvim günleri sayısını, renkleri ve grafik öğeleri stillerini yapılandırmanıza olanak tanır ve grafik temasına göre renk şemasını otomatik olarak ayarlar. Ayrıca, gösterge, günlü
FREE

Basit, doğrudan ve etkili — Bars Trend ve Pivot Desteği tam da budur.
Bu sistemle, grafik üzerinde analizinizi kolaylaştıran sezgisel bir araca sahip oluyorsunuz. Seçilen periyoda göre önemli destek ve dirençleri otomatik olarak işaretler, ayrıca Pivot çizgisini vurgular ve tüm bunları tercihinize göre aktif veya pasif hale getirme seçenekleriyle sunar.
Gösterge tablosu ayrıca D1, H4, H1 ve M30 zaman dilimlerindeki mumların yönünü net bir şekilde göstererek çeşitli işlem yaklaşımları için öne
FREE

Crystal Volume Indicator – MT5 için Akıllı Hacim Analizi Aracı Crystal Volume, fiyat hareketlerinin arkasındaki gizli piyasa gücünü görsel olarak yorumlamanıza yardımcı olmak için tasarlanmış, gelişmiş ve kullanıcı dostu bir hacim analiz göstergesidir. Fiyat hareketi ile hacim dinamiklerini birleştirerek Alım Climax’i , Satım Climax’i ve Zayıf Mumlar gibi önemli hacim olaylarını öne çıkarır. Ana Özellikler: Gerçek Hacim Desteği (Broker desteğine bağlı olarak gerçek hacim veya tick hacmi)
FREE

SMC Sessions Göstergesi, ICT kavramlarına, likidite avlarına ve seans bazlı stratejilere güvenen Akıllı Para yatırımcıları için tasarlanmış hassas bir araçtır. Kurumsal düzeydeki yatırımcılar tarafından kullanılan en kanıtlanmış ve popüler kavramları kullanarak kritik seans bazlı işlem bölgelerini sorunsuz bir şekilde haritalandırır. Bu hepsi bir arada seans göstergesi, grafiğinizi ICT Asya Aralığı, Londra Çıkışı, New York Aralığı, ICT Londra Açık Ölüm Bölgesi, ICT New York Açık Öl

Gerçek piyasa gücünü kolayca tespit et — yeni başlayan olsan bile.
Momentum Gölge Göstergesi (MSI), hem acemiler hem de profesyoneller için mükemmeldir.
Piyasanın gerçekten güçlü olup olmadığını gösterir — böylece güvenle alım-satım kararları verebilirsin. Kafa karışıklığı yok. Tahmin yok.
Sadece gerçeği gösteren basit çizgiler. Kullanımı son derece kolay — her seviye için uygundur
Net alım ve satım sinyalleri
En iyi 20 dakikalık grafiklerde çalışır, scalping için de uygundur Sentetik vola

Volume Thermal Vision ile Hacmin Gücünü Keşfedin Trading’inizi bir üst seviyeye taşımaya hazır mısınız? Volume Thermal Vision karşınızda: hacim analizini stratejik bir avantaja dönüştüren MetaTrader 5 için nihai hacim göstergesi. Yüksek olasılıklı fırsatları tespit etmek isteyen trader’lar için geliştirilen bu gösterge, VSA (Volume Spread Analysis), ICT (Inner Circle Trader), SMC (Smart Money Concepts) ve Wyckoff gibi metodolojilere mükemmel uyum sağlar ve EURUSD, GBPUSD, US30 gibi paritelerde p

KT Fair Value Gap (FVG), piyasada geçici fiyat dengesizliklerinin oluştuğu bölgeleri tespit eder ve vurgular. Bu boşluklar genellikle fiyatın devam edeceği alanlar olarak işlev görür — bazı durumlarda ise ters yönde dönüşlerin (ters FVG) gerçekleşebileceği alanlar haline gelir. Yükseliş FVG: Yeşil kutular olarak gösterilir. Bu boşluklar, fiyatın yukarı yönlü hareketine devam edebileceği destek bölgeleridir. Fiyat boşluğu doldurduğunda, geri dönüş noktası olarak da işlev görebilir. Düşüş FVG: Kır

**ICT OrderFlow Matrix** *Kurumların arz ve talep izlerini ortaya çıkarır.*
---
### Özellikler ICT OrderFlow Matrix, bankaların, hedge fonların ve prop‑trading masalarının emirlerini yoğunlaştırdığı tam bölgeleri otomatik olarak tespit eder ve çizer. Bu Order Block’lar gerçek destek ve direnç seviyeleri işlevi görür — manuel çizim gerekmez.
---
### Temel Özellikler - **Order Block Tespiti** Fiyat hareketlerini tarayarak kurumsal arz/talep dengesizliklerini bulur ve bunları g
Volume Thermal Vision Basic, ünlü Volume Thermal Vision göstergesinin basitleştirilmiş versiyonudur ve hacim yoğunluğunu pratik ve etkili bir şekilde analiz etmek isteyen traderlar için tasarlanmıştır. 6 seviyeli canlı renk seçeneğiyle, hacim verilerini net ve stratejik bir şekilde görmek için StealthMode, NightVision ve FrostVision modları arasından seçim yapabilirsiniz. Yeni başlayanlar için mükemmel veya analizlerinize tamamlayıcı olarak ideal olan bu gösterge hafif, sezgisel ve işlem kararla
FREE
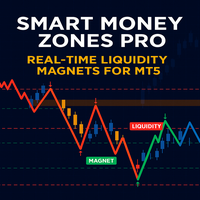
SM Zones Pro göstergesinin işleyişini daha iyi öğrenmek istiyorsanız, öncelikle çeşitli zaman dilimlerinde tek bir EURUSD enstrümanıyla çalışmak üzere uyarlanmış olan ücretsiz SM zones göstergesini indirip denemenizi öneririz. SM Zones'u bu piyasadan indirebilirsiniz. SM Zones Pro, SM Zones'un aksine aynı anda 10'a kadar farklı enstrümanı analiz edebilir.
Akıllı para yönetimi stratejilerinin prensiplerine göre geliştirilen SM Zones Pro göstergesi, MetaTrader 5 (MT5) platformundaki yatırımcılar
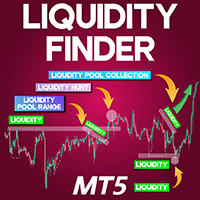
Liquidity Finder Indicator MT5
The Liquidity Finder Indicator MT5 is a specialized tool developed for the MetaTrader 5 platform, created to detect zones of market liquidity. This indicator functions by plotting both fixed and dynamic liquidity levels on the price chart. Blue-colored lines indicate zones of liquidity near recent highs, while red lines mark zones near significant lows. Static lines often align with common chart structures such as Double Bottoms and Double Tops, giving visual clar
FREE
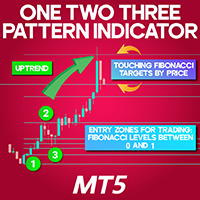
1-2-3 Pattern Indicator for MetaTrader 5
The 1-2-3 Pattern Indicator for MetaTrader 5 is a strategic analytical tool designed to pinpoint potential reversal zones in the financial markets. This indicator automatically identifies three significant swing points, forming a ZigZag structure that outlines the price path and calculates Fibonacci levels based on those decisive pivots. «Indicator Installation & User Guide» MT5 Indicator Installation | One Two Three 123 Pattern Indicator MT4 | ALL
FREE

Welcome. This tool is designed to help traders monitor the critical price level at which the account's margin level reaches 100%, providing valuable insights for risk management in trading. Advisor Description The "Margin Level 100%" indicator is a custom technical indicator for MetaTrader, designed to calculate and display the critical price level for a specific symbol where the account's equity equals its margin, resulting in a margin level of 100%. This level is crucial as it indicates the
FREE
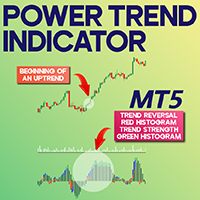
Power Trend Indicator for MetaTrader 5 The Power Trend Indicator for MetaTrader 5 is a dynamic trading utility designed to help traders pinpoint both the direction and momentum of ongoing market trends. This oscillator uses a color-coded histogram to visually represent trend strength. A red bar signifies a trend shift, blue indicates mild trend activity, green denotes strong momentum, and black reflects a flat or indecisive market. It's particularly useful for spotting trend reversals and rapid
FREE
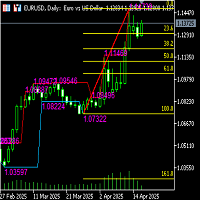
Functional description of automatic Fibonacci line indicator (including high and low channel lines) Indicator name Automatic Fibonacci retracement line + high and low channel auxiliary
Functional introduction This indicator combines the automatically identified high and low points of the band, automatically draws the Fibonacci retracement/extension line, and draws the highest and lowest price channel lines of the current analysis interval to provide traders with clearer support/resistance refe
FREE
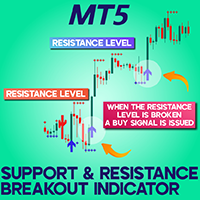
Support Resistance Breakout Indicator (SRBAI) download for MetaTrader 5 The Support Resistance Breakout Arrows (SRBA) indicator serves as a precision tool for mapping key price areas based on pivot structures. Specifically designed for MetaTrader 5 (MT5), the SRBAI indicator marks support zones with blue and resistance zones with red lines. Upon a confirmed breakout beyond these zones, it signals buying opportunities with blue arrows or selling opportunities with red arrows, accompanied by on-sc
FREE
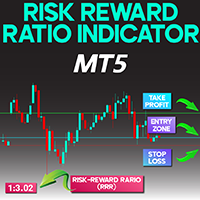
Risk Reward Indicator for MetaTrader 5
The Risk Reward Indicator for MetaTrader 5 is crafted to evaluate and display the Risk-to-Reward Ratio (RRR) with precision, placing the calculated value directly onto the trading chart.
This advanced risk assessment tool showcases the RRR in the upper-left corner of the screen and marks essential trade levels using three clearly defined horizontal lines:
• Green Line: Target Profit (TP)
• Red Line: Protection Stop (SL)
• Blue Line: Entry Point (EP) «Indic
FREE
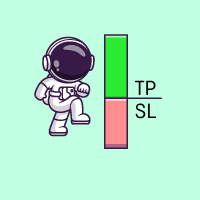
A simple plotting box for your TP and SL markers. The best use case is showcasing signals to your community. I also have MT2DC, which can be used to submit signals to Discord via webhook. By utilizing this indicator, your followers can quickly see the open position along with its TP and SL levels. The indicator also displays the average open price, allowing you to set SL above the average for a safer trade Kindly leave 5-star rating and share with your friends if you like this indicator.
FREE
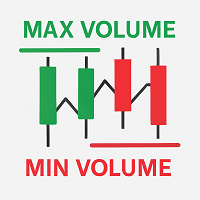
MaxVolumeTrendLines
This indicator visualizes the bars with the highest tick volume for each trading day, highlighting price levels where buyers or sellers showed notable activity. Description MaxVolumeTrendLines automatically detects the bar with the highest tick volume within each day (for a selected number of days) and displays horizontal lines on the chart: Green line at the Low — for bullish bars (close above open). Red line at the High — for bearish bars (close below open). Line thicknes
FREE

Discover the power of harmony in the markets with this advanced harmonic pattern indicator. Designed for demanding technical traders, this indicator automatically detects 11 of the most popular harmonic patterns, including the Gartley, Bat, Crab, Butterfly, Shark, Cypher, and many more.
Thanks to its dynamic dashboard, you can easily manage the visibility of patterns on the chart, activating or deactivating the ones you want in real time without overloading your platform. This flexibility allo
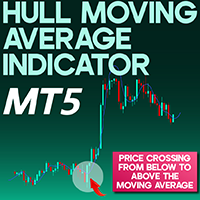
Hull Moving Average Indicator MetaTrader 5
The Hull Moving Average (HMA), developed by Alan Hull, offers a refined alternative to conventional moving averages by delivering faster responsiveness and improved trend accuracy. Integrated into the MetaTrader 5 (MT5) platform, this indicator is tailored to help traders better recognize short-to-medium-term market directions. By using the Hull MA, traders can fine-tune their trade entries and exits with enhanced timing. «Indicator Installation & User
FREE
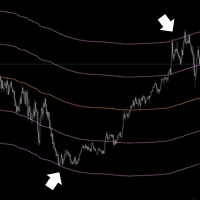
Elevate Your Trading with Advanced Anchored Volume Weighted Average Price Technology Unlock the true power of price action with our premium Anchored VWAP Indicator for MetaTrader 5 - the essential tool for precision entries, strategic exits, and high-probability trend continuation setups. Write me a DM for a 7 day free trial. Anchored VWAP Plus gives traders unprecedented control by allowing custom anchor points for Volume Weighted Average Price calculations on any chart. With support for 4 sim
FREE

Welcome to the "Breakeven Line" indicator, version 1.1, developed by Sergei Ivanov in 2025. Visualize breakeven price levels for your trades with precision and ease. Advisor Description The "Breakeven Line" is a MetaTrader (MQL5) indicator that displays breakeven price levels for open buy and sell positions on the current symbol, factoring in commissions and swaps for accurate risk management. Key Features: Dual Lines: Plots Buy Breakeven (Dark Violet) and Sell Breakeven (Deep Pink) lines, show
FREE
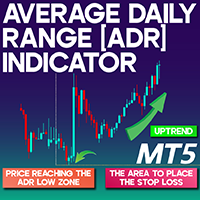
Average Daily Range (ADR) Indicator for MetaTrader 5 The Average Daily Range (ADR) Indicator for MetaTrader 5 is a powerful analytical tool developed for monitoring average price fluctuations within a trading day. It serves as an essential asset for evaluating market dynamics and intraday volatility. A price movement reaching the ADR High can indicate a potential exhaustion among buyers, often hinting at an upcoming pullback. Conversely, when the price moves toward the ADR Low, it might represen
FREE
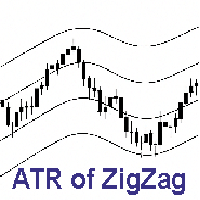
ZigZag Channel Indicator – A Simple Way to Read Market Structure! This indicator automatically calculates the average distance of ZigZag waves and draws a visual channel:
The upper line reflects the average distance of upward waves.
The lower line reflects the average distance of downward waves. Instantly understand market rhythm and price swings.
Use it to identify targets, exits, reversals, and false breakouts.
Perfect for trend analysis, pattern recognition, and measuring move str
FREE
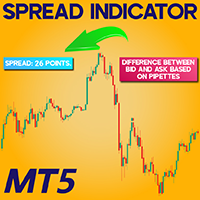
Spread Indicator download For Meta Trader 5
The Spread Indicator is a practical utility designed for MetaTrader 5 (MT5) that highlights the gap between the Bid and Ask prices directly on the chart. Positioned in the upper-left corner of the screen, it presents the current spread in real-time using pipettes (points), providing traders with a clear view of market costs. «Indicator Installation & User Guide» MT5 Indicator Installation | Spread Indicator Download for MT4 | ALL Products By Trad
FREE

RSI Heatmap Indicator for MetaTrader5
The RSI Heatmap Indicator for MetaTrader5 is a powerful visual tool designed to measure the momentum of multiple currency pairs based on the Relative Strength Index (RSI). It detects and highlights overbought and oversold conditions across several timeframes and displays them in a heatmap located at the bottom left section of the chart. This visual representation helps traders quickly assess the overall market sentiment. Green tones signal potential buying
FREE
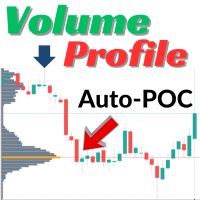
Crystal Volume Profile Auto POC Indicator by Muhammad Jawad Shabir
Version: 1.74 Crystal Volume Profile — Smart Volume Visualization for Precise Trading Decisions Crystal Volume Profile is a lightweight yet powerful indicator developed for MetaTrader 5, designed to provide traders with a clear and insightful view of market volume activity. Whether you're a day trader or swing trader, this tool enables you to identify high-impact price levels by highlighting where trading volume is most conc
FREE
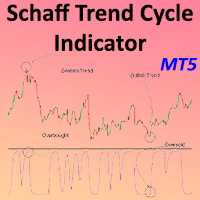
Schaff Trend Cycle Indicator for MetaTrader5
The Schaff Trend Cycle Indicator for MetaTrader5 is a momentum-based oscillator that helps detect potential reversal zones on the price chart. It is built using a hybrid model of the MACD (Moving Average Convergence Divergence) and the Stochastic Oscillator. This indicator marks readings below the 25 level as potential buying zones (oversold), while values above 75 suggest overbought conditions. The visual movement is depicted by a curved purple line
FREE

The VIX Index, or CBOE Volatility Index, is an indicator designed for MetaTrader 5 that transforms historical volatility into an easy-to-interpret oscillator, placing the volatility range between 0 (minimum) and 100 (maximum) based on a configurable normalization period.
Unlike a simple ATR, this oscillator shows you on the chart when volatility is abnormally low or high compared to its recent behavior. Additionally, the indicator provides context and information about the famous VIX Volatility
FREE
As the suggested, with this indicator you are able to switch from one symbol or timeframe to another in the same single chart. So forget about opening tons of chart on your screen! It's not designed for ICT or SMC trader, but if you are that kind of trader you still can use it. Imagine you have a strategy containing various indicators and settings, on a single chart you can screen the entry opportunity then move to the next symbol or timeframe.
FREE
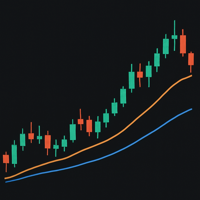
The 13- and 21-period exponential moving averages (EMA) on a 15-minute gold chart are used to identify short-term trends and potential trading signals. When the 13-period EMA crosses above the 21-period EMA, it is considered a bullish signal indicating a possible price increase. Conversely, when the 13-period EMA crosses below the 21-period EMA, it is considered a bearish signal indicating a possible price decline.
These crosses are used to determine entry and exit points. For example, when a
FREE
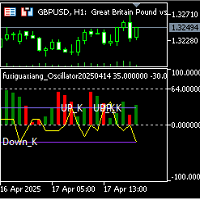
Fuxi Hexagram Oscillation Signal Alert Indicator — An Innovative Trading Tool Combining I Ching Philosophy with Modern Quantitative Analysis 1. Product Overview The Fuxi Hexagram Oscillation Signal Alert Indicator is a cutting-edge technical analysis tool that integrates ancient Chinese I Ching (Book of Changes) philosophy with modern financial market data analysis. By converting K-line (candlestick) chart behavior into dynamic hexagram structures, the indicator provides traders with real-time t
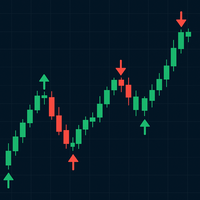
Trend Mark is a versatile trading indicator designed to highlight high-probability entry points using visually intuitive arrows directly on the chart. It analyzes price action and market momentum to identify potential trend reversals or continuations, displaying upward or downward arrows when specific trade conditions are met. Suitable for both beginners and experienced traders, Trend Mark can be used across multiple timeframes and instruments, making it a powerful tool for scalping, day trading

AstroBias Indicator: Precision in the Angle of Your Trend The AstroBias Indicator is more than just a trend direction tool. It also tracks the change in the angle of the price slope , allowing traders to filter signals using angular filters . This makes it especially useful for building automated trading bots based on its signal logic. Key Benefits of AstroBias Indicator Highly Sensitive to Price Action AstroBias responds quickly to real-time price movements, providing clear and timely sign

Sonic Edge Meter: Precision for Reversals and Price Surges Sonic Edge Meter is a powerful indicator built on original algorithms for extremum detection . It’s specifically designed to identify market reversals and sharp directional moves , giving you a clear signal before they happen. How Does Sonic Edge Meter Work? The indicator notifies you of potential turning points or price spikes by displaying visual markers directly on the chart:
Blue dot — signal to buy
Red dot — signal to sell
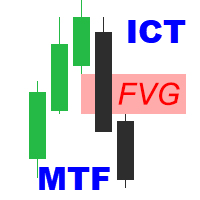
ICT Fair Value Gaps MTF Unlock the power of Fair Value Gaps (FVGs) across multiple timeframes using the ICT Fair Value Gaps Multi - Timeframe Indicator —a precision tool built for traders who follow the Smart Money Concept (SMC) . Key Features : Multi-Timeframe FVG Detection : Automatically identifies Fair Value Gaps from higher timeframes (M15, H1, H4, etc.) and plots them on your active chart for immediate insight. Break of Structure (BOS) & Change of Character (CHoCH): Clearly marked BOS

Candle Confirm Color
What Is It?
The Candle Pattern Confirmations is an advanced indicator for MetaTrader 5 (MT5) designed to identify and confirm candlestick patterns with high probability of trend reversal or continuation. It visually highlights candles that form Engulfing (Bullish/Bearish) and Inside Bars patterns, assisting traders in making more assertive decisions with real-time confirmation.
Main Features
Automatic Pattern Detection
- Detects Bullish Engulfing and Bearish Engulfin
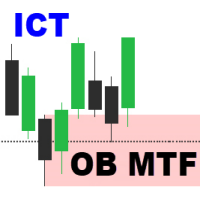
Order Block Multi Timeframe The Order Block Multi Timeframe is a powerful tool for Smart Money Concept (SMC) traders, combining high-accuracy Order Block detection with real-time Break of Structure (BOS) and Change of Character (CHoCH) analysis across multiple timeframes. Smart Money Insight, Multi-Timeframe Precision This indicator automatically identifies institutional Order Blocks —key price zones where large players have entered the market—and plots them directly on your chart. It also track

This MT5 indicator provides real-time updates of classic Renko charts. Renko charts focus on price movement, filtering out noise and highlighting trends. What are Renko candles? Renko charts display price movement using "bricks" of equal size, ignoring time. A new brick is drawn only when the price moves by a specified amount. They help visualize trends by removing time-based noise.
Parameters - BrickSizePoints (20): Renko brick size in points - HistoryDepthSec (3600): Historical data to ini
FREE

Multi-MA Ribbon Overlay (6 EMAs + 250 SMA)
This indicator displays six exponential moving averages (15, 25, 35, 45, 60, 70)(YOU CAN CHANGE THE VALUES) and a slow 250-period simple moving average to help visualize market momentum and trend structure. It’s designed as a clean trend-ribbon for scalpers, intraday, and swing traders. ️ Disclaimer:
Trading forex and CFDs on margin carries a high level of risk and may not be suitable for all investors. Leverage can work for or against you. Always u
FREE

This is a Free Display Dashboard for The ArbitrageATR Recovery MT5 EA. This indicator is used to track existing Total hedge positions (Account Summary) , Balance, Equity, P/L and Symbols, Correlation Status. Please adjust size and colours according to your desired preference. Feel free to message me if there are any queries required. Please note that this an indicator and not a Utility or Expert Advisor.
LINK TO THE EA: https://www.mql5.com/en/market/product/131269?source=Site+Market+Product+
FREE

Pivot Points Indicator – Your Technical Compass in the Market Unlock powerful levels of market structure with our Pivot Points Indicator – a classic tool enhanced for modern trading! Designed for MetaTrader5, this indicator automatically calculates and displays daily, weekly, or monthly pivot levels along with key support and resistance zones. Whether you're a scalper, day trader, or swing trader, pivot levels help you identify potential reversal points , entry zones , and take-profit targ
FREE
Fractal Model Indicator for Metatrader , meticulously crafted around the renowned Fractal Model by TTrades. This powerful tool empowers traders to navigate price action with precision, leveraging multi-timeframe analysis to anticipate momentum shifts, swing formations, and trend continuations. Designed for MetaTrader , the Fractal Model Indicator combines advanced algorithmic insights with customizable features, making it an essential addition for traders seeking to capitalize on expansive mar

This indicator is converted from Pinescript to MQL5 and consisting of buffers for the range lines as well, its not only object.
The Range Detector indicator aims to detect and highlight intervals where prices are ranging. The extremities of the ranges are highlighted in real-time, with breakouts being indicated by the color changes of the extremities.
USAGE Ranging prices are defined by a period of stationarity, that is where prices move within a specific range.
Detecting ranging marke

The Accumulation and Distribution indicator is a volume-based indicator that was essentially designed to measure underlying supply and demand. This is accomplished by trying to determine whether traders are actually accumulating (buying) or distributing (selling). This is accomplished by plotting a cumulative total of the money flow volume for each period. This indicator can reveal divergences between volume flow and actual price to primarily affirm a current trend or to anticipate a future reve
Overview The Stochastic Divergence Indicator is a powerful tool designed to detect potential market reversals by combining the popular Stochastic Oscillator with divergence analysis. Divergence occurs when the price moves in the opposite direction of the indicator, signaling a possible trend exhaustion or reversal. This indicator visually marks bullish and bearish divergences on the chart, helping traders make informed decisions with greater confidence. Key Features • High Accuracy (No Repaint)

Alwinson Active Trades Info Simple. Informative. Instantly Visible on Your Chart. Alwinson Active Trades Info is a lightweight custom indicator that displays a real-time summary of your currently open trades —right on your chart. No more switching tabs just to see what pairs are active and how much lot size is in play. Key Features: Displays a list of all symbols with open positions in your trading account. Shows the dominant position type (BUY or SELL) per symbol. Calculates and displays t

To get access to MT4 version please contact via private message. This is the exact conversion from TradingView: "3rd Wave" by " LonesomeTheBlue ". The screenshot shows similar results from tradingview and Metatrader when tested on ICMarkets on both platforms. This is medium-load processing indicator and updates are available per bar close. This is a non-repaint indicator. All input options are available. Buffers are available for processing in EAs. You can message in private chat for further cha

Zone to Zone Indicator for MT5 Unleash the full potential of your trading strategy with the "Zone to Zone" indicator for MetaTrader 5. This advanced tool provides unparalleled precision and versatility, making it an essential addition to any trader's toolkit. Key Features: MT5 Compatibility : Seamlessly integrates with the MetaTrader 5 platform for a smooth and efficient trading experience. Accurate Historical Resistance/Support Zones : Effortlessly draw and identify key resistance and support

Do you find it difficult to track and manage your open positions across multiple different symbols in MetaTrader 5? Do you need a quick and comprehensive overview of your current market exposure and the performance of each symbol individually? The "Dynamic Exposure Table" indicator is your ideal tool! This indicator displays a clear and detailed table in a separate window below the chart, summarizing all your open positions and intelligently grouping them by symbol, giving you a complete view of

When there is no position, when changing the color, you can consider opening an order. With the fluctuation of the market, when the current color changes again, you need to close the position and leave. Suitable for different cycles, the trading rules are simple and require friends to explore on their own.
I hope friends who use this indicator can make a lot of money, rolling bigger and bigger like a snowball. thank you!
The TrendKiller Oscillator is a custom MetaTrader 5 (MT5) indicator designed to help traders analyze price deviations from a moving average, displayed in a separate window. It calculates the difference between a chosen price (e.g., close) and a moving average (default: 14-period SMA), producing a detrended value that oscillates around a zero line. Dynamic maximum and minimum levels, computed over a user-defined period (default: 50 bars), provide context for identifying overbought/oversold condi

SpectralEdge Periodogram - Cycle Analysis Indicator
Overview
The SpectralEdge Periodogram is a powerful technical analysis indicator for MetaTrader 5, designed to uncover hidden price cycles in financial markets using Fast Fourier Transform (FFT). By transforming price data into the frequency domain, this indicator reveals the dominant cycles driving market movements, enabling traders to identify repeating patterns and make informed trading decisions. Whether you're a day trader, swing trader

Este indicador calcula e exibe no gráfico o preço justo do mini índice (WIN) com base em dados fundamentais do mercado. Além disso, ele traça automaticamente linhas de suporte e resistência percentuais , ajudando você a visualizar zonas importantes de preço. É como ter uma régua financeira no gráfico, mostrando onde o preço "deveria estar", de forma objetiva, considerando o cenário macroeconômico!
O indicador usa uma fórmula de precificação de contratos futuros baseada em: O preço à vista do Ib

Fibonacci Linear Trend Indicator Description This indicator for MT5 helps traders spot price levels using the Fibonacci method. It automatically draws seven colored Fibonacci lines on your chart based on the high and low of the last 50 candles (adjustable via the fiblookback setting): Fib Zero (0%) : Lowest price in the period Fib Level 1 (23.6%) Fib Level 2 (38.2%) Fib Level 3 (50%) : Midpoint Fib Level 4 (61.8%) Fib Level 5 (78.6%) Fib Level 6 (100%) : Highest price in the period Each lin
FREE
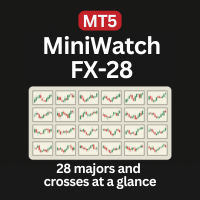
Monitor all 28 Forex pairs at once — clean mini charts, real-time price action, perfect for consistent price pattern traders. Designed for consistent, mechanical, and hybrid traders who repeatedly trade the same price action patterns — such as triangles, flags, trends, and supply/demand zones — across multiple symbols, without relying on indicators.
Core Features: Displays all 28 major Forex pairs in mini chart format , organized in a clean 4-row by 7-column layout. Powered by live price action
FREE

Bu göstergeyi satın alan herkese aşağıdaki ekstra içerikler ücretsiz olarak sunulmaktadır:
Her işlemi otomatik olarak yöneten, Stop Loss ve Take Profit seviyelerini ayarlayan ve işlemleri strateji kurallarına göre kapatan özel yardımcı araç: "Bomber Utility" Göstergenin farklı varlıklar üzerinde kullanılmasına yönelik ayar dosyaları (set dosyaları) Bomber Utility için 3 farklı modda kullanım sunan ayar dosyaları: "Minimum Risk", "Dengeli Risk" ve "Bekle-Gör Stratejisi" Bu ticaret stratejisini hı

NOTE: CYCLEMAESTRO is distributed only on this website, there are no other distributors. Demo version is for reference only and is not supported. Full versione is perfectly functional and it is supported. CYCLEMAESTRO , the first and only indicator of Cyclic Analysis, useful for giving signals of TRADING, BUY, SELL, STOP LOSS, ADDING. Created on the logic of Serghei Istrati and programmed by Stefano Frisetti ; CYCLEMAESTRO is not an indicator like the others, the challenge was to inter

Candle Volume Strength, alıcılar ve satıcılar arasındaki devam eden mücadeleye dair içgörüler sağlayan gelişmiş bir hacim analizi göstergesidir. Gerçek zamanlı hacim değişimlerini hesaplar ve görselleştirir, yatırımcıların kopuşları, trendleri, geri çekilmeleri ve geri dönüşleri daha büyük bir doğrulukla onaylamalarına yardımcı olur.
Temel Özellikler: Hacim Bazlı Onay – Gösterge, tik hacmindeki değişiklikleri izler ve piyasa gücü alıcılar ve satıcılar arasında değiştiğinde uyarı verir. Trend

Sıfır Gecikmeli EMA Göstergesi (AI Optimize) – Profesyonel Araç
Geleneksel hareketli ortalamaların gecikmesini ortadan kaldıran yeni nesil çözüm. AI optimizasyonlu algoritmalarla anlık piyasa içgörüleri sunar. Özellikler: AI Hızı : Neredeyse sıfır gecikme. Trend değişimlerini anında yakala. Çoklu Piyasa : Forex, hisse senetleri, kripto ve emtialar için ideal. Net Sinyaller : Gürültüyü azaltır, kritik sinyalleri korur. Erken Sinyal : Klasik EMA'lardan önce boğa/ayı hareketlerini tespit eder. Ren
FREE

I am a trader specializing in the development of rare , exclusive , high-performance trading bots designed for serious traders who are committed to achieving consistent profitability and success. This free indicator is more than just a visual tool—it powers the Midnight Throttle EA , an automated trading system that executes trades based on the precise market conditions this indicator observes. Midnight Watch : A Pro-Level Tool for Precision Market Analysis. An advanced , multi-functional MetaTr
FREE

RSI ABCD Desen Bulucu: Teknik Strateji 1. Gösterge Nasıl Çalışır? Klasik RSI ile otomatik ABCD harmonik desen tespitini birleştirir. Temel Bileşenler Standart RSI (ayarlanabilir periyot) Tepe ve dip işaretleri (oklar) ABCD desenleri (yeşil/kırmızı çizgiler) Aşırı alım (70) ve aşırı satım (30) filtreleri 2. MT5 Kurulumu period = 14 ; // RSI periyodu size = 4 ; // Maksimum desen boyutu OverBought = 70 ; // Aşırı alım seviyesi OverSold = 30 ; // Aşırı satım seviyesi Filter = USE_FILTER_ YES ; // On
FREE
Haven Average Daily Range - Forex ve diğer piyasalarda finansal araçlar için ortalama günlük fiyat aralığını hesaplayan ve görüntüleyen bir göstergedir. Diğer ürünler -> BURADA Öne Çıkan Özellikler: Farklı dönemlere (5, 10 ve 20 gün) dayalı ADR hesaplaması ADR seviyelerinin, aralık sınırına ulaşıldığında otomatik stil değişikliği ile görüntülenmesi Ticaret gününün başlangıcı ve sonu için net görsel gösterge Özelleştirilebilir görüntüleme parametreleri (renk, çizgi kalınlığı) Daha iyi görselleşt
FREE
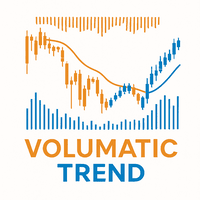
Volumatic Trend is a powerful, trend-following indicator that merges directional analysis with real-time volume behavior. By combining adaptive trend logic and volume overlays, it gives traders a detailed snapshot of market conviction and potential turning points. From instant trend shift detection to volume-weighted candle visuals, this tool brings deeper context to price movement. MT4 Version - https://www.mql5.com/en/market/product/136210/ Join To Learn Market Depth - https://www.mql5.co
FREE
“Bu Gizli Ticaret Aracı Prop Firmaları Tarafından Yasaklandı (Bilmenizi İstemiyorlar!)”
Nihai Ticaret Avantajını Keşfedin - EA'lar Olmadan! (Bir tüccar tarafından tüccarlar için yapılmıştır. Bir Robot değil - sadece saf Ticaret Gücü!)
Sahte kırılmalar, ani geri dönüşler veya piyasa manipülasyonu ile mi mücadele ediyorsunuz? Bu güçlü alım satım aracı, piyasalar hızlı hareket ettiğinde bile size lazerle doğru sinyaller verir - bir profesyonel gibi yüksek olasılıklı girişleri tespit etmenize

Çoklu Zaman Dilimi Mumları göstergesi, yatırımcıların daha düşük zaman dilimi analizlerini daha yüksek zaman dilimi yapısıyla uyumlu hale getirmelerine yardımcı olmak için tasarlanmış güçlü bir görselleştirme aracıdır. Seçili daha yüksek bir zaman diliminden (H1, H4, D1, vb.) mumları doğrudan mevcut grafiğinize çizerek, bu gösterge grafikleri değiştirmeden genel piyasa anlatısına dair daha net bir bakış açısı sunar.
Bu Göstergeye Kimin İhtiyacı Var? Bu araç şunlar için idealdir: Akıllı Para
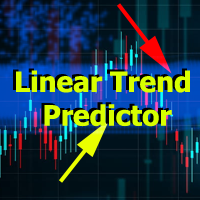
Linear Trend Predictor - Giriş noktalarını ve yön destek çizgilerini birleştiren bir trend göstergesi. Yüksek/Düşük fiyat kanalını kırma prensibiyle çalışır.
Gösterge algoritması piyasa gürültüsünü filtreler, oynaklığı ve piyasa dinamiklerini dikkate alır.
Gösterge yetenekleri
Düzeltme yöntemleri kullanılarak piyasa trendi ve ALIM veya SATIŞ emirlerinin açılabileceği giriş noktaları gösterilir. Herhangi bir zaman dilimindeki grafikleri analiz ederek kısa ve uzun vadeli piyasa hareketlerini
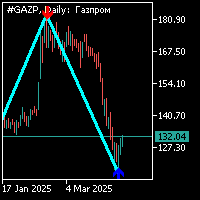
Zig-zag göstergesi, 34 periyotlu standarttır ve ok şeklinde ek bir sinyale sahiptir. Ek sinyal, zig-zag göstergesinden ayrı olarak hesaplanır. Bu gösterge aşağıdaki şekilde çalışır: 1. zıg-zag göstergesinin bir bölümünü oluştururken ve ok şeklinde ek bir sinyal görünürken, konumu ok yönüne doğru açmanız gerekir; 2. zıg-zag göstergesinin bir başka kolu, önceki kolun tepesindeki ek sinyalin (ok) karşı tarafında oluştuğunda, bekleyen emrin konumunu belirlemek mümkündür; 3. zig-zag'ın karşı kolunun
MetaTrader mağazası, alım-satım robotları ve teknik göstergeler satmak için en iyi yerdir.
MetaTrader platformu için ilgi çekici bir tasarıma ve iyi bir açıklamaya sahip bir uygulama geliştirmeniz yeterlidir. Milyonlarca MetaTrader kullanıcısına sunmak için size ürününüzü Mağazada nasıl yayınlayacağınızı açıklayacağız.
Alım-satım fırsatlarını kaçırıyorsunuz:
- Ücretsiz alım-satım uygulamaları
- İşlem kopyalama için 8.000'den fazla sinyal
- Finansal piyasaları keşfetmek için ekonomik haberler
Kayıt
Giriş yap
Gizlilik ve Veri Koruma Politikasını ve MQL5.com Kullanım Şartlarını kabul edersiniz
Hesabınız yoksa, lütfen kaydolun
MQL5.com web sitesine giriş yapmak için çerezlerin kullanımına izin vermelisiniz.
Lütfen tarayıcınızda gerekli ayarı etkinleştirin, aksi takdirde giriş yapamazsınız.