YouTube'dan Mağaza ile ilgili eğitici videoları izleyin
Bir ticaret robotu veya gösterge nasıl satın alınır?
Uzman Danışmanınızı
sanal sunucuda çalıştırın
sanal sunucuda çalıştırın
Satın almadan önce göstergeyi/ticaret robotunu test edin
Mağazada kazanç sağlamak ister misiniz?
Satış için bir ürün nasıl sunulur?
MetaTrader 5 için yeni teknik göstergeler - 36

The Price Elevator indicator is developed to help you figure out the general long-term trend of the market. If the price is above the Green separator line, this is a clear indication the bulls are in control. Similarly, the bears are in control if the price continues to trend below the red separator line. Download Price Elevator MT4
Trend Re-entry In this case you would plan your buy entries above the green dotted box (make sure to set the Buy / Sell Retracement Floor=30). The SL should be

MetaBands uses powerful and unique algorithms to draw channels and detect trends so that it can provide traders with potential points for entering and exiting trades. It’s a channel indicator plus a powerful trend indicator. It includes different types of channels which can be merged to create new channels simply by using the input parameters. MetaBands uses all types of alerts to notify users about market events. Features Supports most of the channel algorithms Powerful trend detection algorith

WolfeWaveBuilder göstergesi ile ticarete katılın! Bu, en başarılı ve karlı yatırım kararlarını almak için özel olarak oluşturulmuş benzersiz bir araçtır. Canlı hesaplar için idealdir ve tamamen test edilmiş ve neredeyse garantili bir ticaret stratejisinden yararlanır. fırsatı kaçırmayın! WolfeWaveBuilder göstergesi ile ticaret yaparak para kazanmaya başlayın!
MT5 sürümü https://www.mql5.com/ru/market/product/8920
Gösterge Özellikleri
Wolfe Waves stratejisi için sinyaller verir.
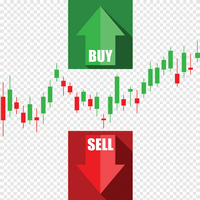
Bu gösterge, fiyat serisinin yerel en yüksek ve en düşük seviyelerini kullanır. Ekstremi vurguladıktan sonra değerleri yumuşatılır. Bu sayede iki kanal inşa edilmiştir - harici ve dahili. Fiyat hareketi kesinlikle lineer bir trend izliyorsa, dahili kanal limitleri gösterir. Dış kanal, logaritmik bir eğilim ile fiyat hareketinin sınırlarını gösterir. Gösterge, kanalları hesapladıktan sonra gerçek fiyat hareketini analiz eder ve pozisyonların açılması ve kapanması için öneriler sunar. Mavi noktal

Bu gösterge, filtrelenmiş fiyat bilgilerini görüntüler 64 renk aralığı kullanan bir mum grafiği şeklinde. Fiyat hareketinin yönünün gücünü belirlemek için son derece yararlıdır. Bu göstergenin herhangi bir ayarı yoktur. 64 rengin tamamı programa dahil edilmiştir, mavi renk ne kadar parlaksa, hareketin satın alma gücü o kadar güçlü olur, ve kırmızı renk ne kadar parlaksa, hareketin satış gücü o kadar güçlü olur. /////////////////////////////////////////////////////////////// Umarım bu gösterge b

Watermark Centralized
Adds a watermark centered with the asset name and chosen period.
It is possible to override the font type, font size, font color and separator character.
The watermark is positioned behind the candles, not disturbing the visualization.
It has automatic re-centering if the window is resized.
Hope this indicator helps you, good trading ;)
FREE

Demand and supply zones Support and Resistance areas Show broken zones Show tested and untested zones Show weak zones Fractal factors Notifications when price reaches point of Interest with Push notifications and pop ups Customizable History Clickable Works on all Timeframes Works on all pairs.
Free for a while till further notice and changes. The demand and supply bot coming soon
FREE

The Market Entropy indicator was created to measure the order of price changes over time. consists of two lines and a histogram where the lines are responsible for measuring the price movement and the histogram measures the strength of the analyzed movement. It can be used to find a trend (Image 2) or price reversal (Image 3).
Blue Line: Buy Entropy Red Line: Sell Entropy Historgram: Market Entropy
Interpretation: Buy Line above the Sell Line indicates that in the analyzed period buyers wer

Informações Importantes sobre o ArrowHacker (Não repinta! Não gera sinais atrasados!)
Se você está procurando um indicador que cumpre aquilo que promete, você acabou de encontrar! O ArrowHacker irá superar todas as suas expectativas com certeza! E o melhor de tudo, é só colocar na sua conta, ligar e já começar a lucrar!
O ArrowHacker é um sistema profissional de trade criado para as plataformas MT4 & MT5 e otimizado para trabalhar com qualquer ativo na plataforma MetaTrader 5, sejam moeda

ImbaTrend Runner - is the trend following manual system for forex/crypto market. It defines medium-term trends and works with it in intraday mode. System shows enter points, profit and loss targets. As a rule profit targets are 2-3 X bigger than loss targets. Indicator is AutoAdaptive and it automatically updates it's settings during trading. Indicator is sensitive to market changes, regular updates helps to stay in relevant trend. Main Indicator's Features Signals are not repaint, late or disap

Moving Average Trend Scanner is a multi symbol multi timeframe triple MA crossover dashboard that helps traders to monitor, and identify potential market trends from one chart. This panel scans 3 moving averages in up to 28 configurable instruments and 9 timeframes for triple moving average alignment and moving average crossover with a deep scan feature to scan all market watch symbols (up to 1000 instruments!).
Download Demo here (Scans only M1 and M6) Settings description here MT4 v

Informações Importantes sobre o CryptoHacker (Não repinta! Não gera sinais atrasados!)
Se você está procurando um indicador que cumpre aquilo que promete, você acabou de encontrar! O CryptoHacker irá superar todas as suas expectativas com certeza! E o melhor de tudo, é só colocar na sua conta, ligar e já começar a lucrar!
O CryptoHacker é um sistema profissional de trade criado para as plataformas MT4 & MT5 e otimizado para trabalhar com CryptoMoedas.
Nosso sistema utiliza uma poderosa

Advanced Bollinger Bands Scanner is a multi symbol multi timeframe Bollinger bands dashboard that monitors and analyzes the Bollinger Bands indicator from one chart. This panel scans the Bollinger bands indicator in up to 28 configurable instruments and 9 timeframes for price overbought/oversold, price consolidation (Bollinger bands squeeze), and consolidation breakout (squeeze break) with a deep scan feature to scan all market watch symbols (up to 1000 instruments!).
Download Demo here

Всем привет. Представляю Вашему вниманию Индикатор TRUE ATR. Так же есть данный индикатор для mt4 https://www.mql5.com/ru/market/product/82414 Данный индикатор работает на всех рынках. TRUE ATR высчитывает среднестатистическое движение инструмента за 1 день и показывает сколько в инструменте осталось энергии внутри дня. В отличие от классического индикатора АТР которые без разбора учитывает все бары(свечи), TRUE ATR при расчете среднестатистического движения инструмента использует ближайших 5

Market Conditions indicators can provide support to the trader so that he can identify market trends over a given period. The purpose of this model is to allow traders to have a global vision on the exchange markets. And the formula that we develop allow to scan the major currencies in the exchange market. The model uses a purely statistical formula which is based on the historical data of the major currencies "eur, usd, gbp, jpy, aud, nzd, cad, chd". Of which 28 currency pairs are traded. It

Dört topluluğa bölünmüş on iki yapay sinir ağı gelecekte fiyat hareketinin yönünü tahmin etmeye çalışmak: küçük: 1 dakika, orta: 5 dakika, büyük: 30 dakika, kraliyet: 15 dakika. Aktif yüksek frekanslı ticaret için bu gösterge ile çalışmaya hazır Ayrı olarak başlatılan ve gösterge tarafından yayınlanan küresel değişkenler biçiminde göstergeden sinyal alan bir EA. Bu gösterge strateji test cihazında çalışmıyor, bu nedenle videoyu izleyin veya size bir hafta ile sınırlı bir deneme demo sürümü sağl

Before installing the HeatMap indicator make sure you are using a broker that gives you access to the Depth of market (DOM) !!
This indicator creates a heatmap on your chart allowing you to see the buy or sell limit orders easily and in real time. You have the possibility to change the setting and the colors of the HeatMap in order to adapt to all markets and all charts. Here is an example of a setting you can use with the NASDAQ100 on the AMPGlobal broker : https://www.youtube.com/watch?v=x0
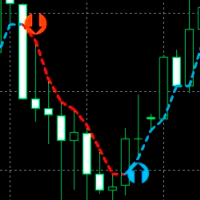
An indicator for accurately determining price reversal points on all timeframes and all currency pairs. With the help of technical analysis of the market and mathematical diagnostic models, this indicator determines the price reversal points and the current trend direction with great efficiency. The indicator displays this information on the chart in the form of arrows and lines. The arrows show the trend reversal points and the lines show the current trend direction. INDICATOR trades in real t

Using the Stochastic Oscillator with a Moving Average is a simple but very efficient strategy to predict a trend reversal or continuation.
The indicator automatically merges both indicators into one. It also gives you visual and sound alerts.
It is ready to be used with our programmable EA, Sandbox, which you can find below: Our programmable EA: https://www.mql5.com/en/market/product/76714 Enjoy the indicator!
This is a free indicator, but it took hours to develop. If you want to pay me a c
FREE

PULLBACK HUNTER What is every trader's cherished dream? To see without delay the places where the reversal will happen. This, of course, is from the category of magic, though... nothing is impossible. But for now I've prepared for you an indicator that marks in real time the end of corrections to the current movement or in short - catches pullbacks.What is the main point? Many people practice rebounds when the price moves in the direction of the open position. And they do them on the formation o

Taking into account the difference in trading sessions, the indicator shows the trend direction and the resistance level. All events are marked on the chart and alerts are sent. Using SessionAlert, you can trade calmly, steadily. You just need to specify the start and end time of the sessions. The indicator displays the resistance level, the arrow indicates the trend change event and additionally marks the price touching the resistance level. The principle of operation of the indicator is very s

This simple indicator creates a ZigZag based on market frequency. It can be very useful for those who trade TapeReading. Switch between the various timeframes and note that the ZigZag will be maintained, this is due to the method used to create a timeless indicator. Set the main input parameter: nTicks: Number of ticks for frequency inversion The other parameters are for visual aspects only, try them.
FREE

Gösterge, ticaret faaliyetleriniz için gerçek Fibonacci seviyelerini çizer.
Seviyeler, fiyat düşük (%0) veya %100 fibonacci seviyesine dokunduktan sonra her seferinde yeniden çizilir.
Parametrelerde ticaret etkinliğini seçin: Uzun vadeli yatırımcı Orta vadeli yatırımcı Orta vadeli yatırımcı aktif Kısa vadeli yatırımcı Kısa vadeli yatırımcı aktif Spekülatör Spekülatör aktif Kafa derisi yüzücü Kafa derisi aktif Bu göstergeyi çalışırken deneyin ve artık fibonacci seviyeleri çizmek için koordin
FREE
The idea of this trading system from the EMA with a Mediante price from the EMA indicators is based exactly 100% from Ripster47 trading system, me is just the person to create it on the MT5 platform, but with alerts for your own buy/sell settings. Hereby I make a copy from Ripster47 explanation for using that system: " EMA Cloud By Ripster
EMA Cloud System is a Trading System Invented by Ripster where areas are shaded between two desired EMAs. The concept implies the EMA cloud area

Moving Average 4 TimeFrames
Display 4 moving averages of 4 different timeframes on the same chart. In order not to pollute the chart, the indicator will plot the complete average only in the current timeframe of one of the 4 registered averages, for the other timeframes of registered averages the indicator only displays a part of the average so that you know where it is at that time graphic.
Example:
Display on the 5-minute chart where the 200-period arithmetic moving average of the 5 min
FREE
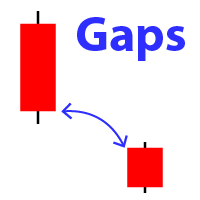
Displays the appearance of a gap on the chart (when the closing price of the previous bar differs from the opening price of the new bar). My #1 Utility: includes 65+ functions | Contact me if you have any questions In the initial settings you can configure: The gap size : gap that exceed this value will be displayed. Size type: pips / poitns / %; Arrow color : separate for up and down gaps. Terminal / Email / Push notifications When you hover the mouse over the gap arrows on the char

Market Chopper Indicator - is the manual system for market scalping. Indicator uses most accurate points to enter, when current trend has lost it's power and new one starts. Indicator shows : Enter points(buy/sell arrows), Exit points(Stoploss/Takeprofit arrows). Indicator makes market analysis and adapts to any market, any timeframe showing most relevant strategy for exact conditions. Main Indicator's Features Signals are NOT repaint, late or disappear; Every signal comes at the open of new bar

Support and Resistance zones indicator for MT5 is a multi-timeframe panel and alert that finds support and resistance zones and pivot points for all timeframes of MetaTrader 5 and gives alert when price has interaction with them. Download demo version (works on GBPUSD, EURJPY and NZDUSD symbols) Read the full description of scanner parameters in the blog page . Many unique features in one indicator: Integrating support and resistance zones and pivot points in one indicator with powerful filteri

3 Moving averages crossover , with customizable Notifications and pop ups. Comment for any ideas. Its a demo version , could use some work, hope you at least find it useful. Hit me up with anything or any ideas you feel might be helpful and i will try and add them in if i get the time. Thank you. This version is free as of now . I can't promise anything about the future. But enjoy and have fun. Truly PVRPLE BLVCK. PS don't forget to share and like.
FREE

VWAP Volume And Price is the indicator for Volume Weighted Average Price, designed according to regular calculation. The average price is calculated using typical price - (high + low + close) / 3 - and weighted by volume for each candle. So, the indicator can be used to trend trades, balanced with volume. Try other products and expert advisors too. Any doubt, PM.

RSI divergence indicator finds divergences between price chart and RSI indicator and informs you with alerts (popup, mobile notification or email). Its main use is to find trend reversals in the chart. Always use the divergence indicators with other technical assets like support resistance zones, candlestick patterns and price action to have a higher possibility to find trend reversals. Three confirmation type for RSI divergences: RSI line cross 50 level Price returns to previous H/L C
FREE

Bollinger bands out/in strategy A strategy created by Joe Ross, and very useful for finding trades when the market is overloaded. Indicator You don't need to find where there are entries on the chart, this indicator shows them for you. The entrance The trade is confirmed when the price closes outside the bollinger bands on a candle and the candle after the price closes inside the bands. comment I want to improve this indicator, so you can help me sending me your reviews and comments, thanks :).
FREE
Bu gösterge, optimum kar al ve zararı durdur seviyelerini gösterir. Bu seviyeler geçmiş verilere dayalı olarak hesaplanır. İlk başlangıçta, gösterge tarih konusunda eğitilir. Bundan sonra, fiyatın gelecekte şu veya bu seviyenin üstesinden gelme olasılığını değerlendirir ve stop emri vermek için en uygun seçenekleri seçer. Örneğin, kârı al değerleri, kârın maksimum olması ve fiyatın seviyesine ulaşma olasılığının mümkün olan en yüksek olması için seçilir. Durdurma kaybı seviyesi minimum olmalıdı

Fiyat gözlemine sağduyulu bir yaklaşım Fiyatlar yükseldiğinde satın al ve fiyatlar düştüğünde sat Fiyatlar yükselirken satın almak veya fiyatlar düşerken satmak için yukarıdaki ifade çok geniş olabilir ve bu nedenle bazı yönergelere ve kurallara ihtiyaç duyabilir, işte burada 3 Ördek devreye giriyor.
Fiyat Ortalama Mt5 göstergesi, son yükseliş trendi yönünde alım fırsatlarını ve son düşüş trendi yönünde satış fırsatlarını belirlemenize yardımcı olacaktır. Başlıktaki “ördek”, her şeyin doğru s
Hipergeometrik seri, bu filtrenin ağırlık katsayılarını hesaplamak için kullanılır. Bu yaklaşım, zaman serilerinde oldukça ilginç bir düzeltme elde etmenizi sağlar. Hipergeometrik filtre ağırlıkları, üstel ve doğrusal ağırlıklı hareketli ortalamalar kadar hızlı azalmaz, ancak düzleştirilmiş hareketli ortalamalardan daha hızlı bozulur. Bu nedenle, bu filtrenin davranışı birçok yönden hareketli ortalamaların davranışına benzer. Ancak, birkaç avantajı vardır. Gecikmesi, hareketli ortalamanınkinden

HiLo Activator is a technical analysis indicator developed by Robert Krausz, a renowned hungarian trader with a career in the USA.
It is a trend indicator that helps you to predict the cange of the current trend. In an uptrend it is displayed at the bottom of the candles; in a downtrend it is displayed at the top.
Its only setting is the calculation period.
It is possible to have alerts when a new trend begin. Enjoy! This is a free indicator, but it took hours to develop. If you want to pay m
FREE

Donchian Channel is an indicator created by Richard Donchian. It is formed by taking the highest high and the lowest low of the last specified period in candles. The area between high and low is the channel for the chosen period.
Its configuration is simple. It is possible to have the average between the upper and lower lines, plus you have alerts when price hits one side. If you have any questions or find any bugs, please contact me. Enjoy!
FREE

Kesin alış ve satış fiyatlarının üst düzey göstergesi. Gösterge, bir pozisyona girme ve pozisyondan çıkma hedefleriyle birlikte fiyat toparlanma seviyelerini gösterir. Her düzeydeki yorum şunları belirtir: düzeyde (AL/SAT) ne yapılması gerektiği; giriş fiyatı; hedef çıkış fiyatı. Parametrelerde ticaret faaliyetinizi seçmeniz gerekir: Uzun vadeli yatırımcı Orta vadeli yatırımcı Orta vadeli yatırımcı aktif Kısa vadeli yatırımcı Kısa vadeli yatırımcı aktif Spekülatör Spekülatör aktif Kafa derisi yü

The " Stochastic Advanced " indicator displays the signals of the 'Stochastic" indicator directly on the chart without the presence of the indicator itself at the bottom of the screen. The indicator signals can be displayed not only on the current timeframe, but also on a timeframe one level higher. In addition, we have implemented a filter system based on the Moving Average indicator.
Manual (Be sure to read before purchasing) | Version for MT4 Advantages
1. Displaying the signals of the "Sto
Daily Projection Levels , as the name implies, is an indicator that project the price changes in percentage above and below the opening of the day (or closing of the previous day.
These are "psychological" support and resistance areas where price tries to retrace or break out.
With this you have a powerful tool to predict what these zones will be! You can define which projection levels you want (up to 5 above and below), in addition to have alert messages and visual customization. If you want
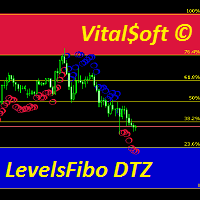
The combined Levels Ib DTZ indicator helps to determine the trend direction when trading. Displaying signals on the chart about a possible upcoming trend change. The indicator is a combination of Fibonacci levels with overbought and oversold zones and a trend indicator based on ZigZag and ATR indicators. The Levels Ib DTZ indicator helps traders predict future price movements and adjust their strategy accordingly. It works on all timeframes.

Donchian Channel DC is the indicator of Donchian Channels, that plots maximum and minimum values of a specific period, besides mean value line. It´s possible to configure simple period for analysis and the indicator will plot all three values. You can trade with this indicator as trend or reversal, according to each strategy. Do not let to test others indicators as soon as others expert advisors.

Basato sull'indicatore RSI aiuta a capire quando il trend sta cambiando in base ai periodi impostati. E' possibile impostare intervalli di tempo personalizzati e colori delle frecce. Segui l'andamento e valuta anche in base alla volatilità dell'asset. Funziona con ogni coppia di valuta ed è da considerare come un'aiuto ad una valutazione. Puoi associarlo con altri indicatori.

Quantitative analysis software, this indicator came from another country and thanks to my network today I can share this software with you!
Russian Tool plots arrows on your asset, indicating the trend the asset will enter, easy to use and easy to install indicator
We have been working with robots and indicators since 2018! We came to MQL5 to be able to bring better benefits at the time of payment by our customers!,
our Instagram where we post daily stories of operations: https://www.inst

Birçok stratejide, bir stop-loss tanımlamaya yardımcı olması için ölçeklendirilmiş bir ATR kullanmak oldukça yaygındır ve onu kar alma hedefleri için kullanmak da nadir değildir. Yerleşik ATR göstergesini kullanmak ve ofset değerini manuel olarak hesaplamak mümkün olsa da, özellikle sezgisel veya verimli değildir ve yanlış hesaplama potansiyeline sahiptir.
Özellikler Yapılandırılabilir ATR ofseti Üst ve Alt Bant. yapılandırılabilir ATR ölçeklendirme faktörü alternatif (grafik dışı) ATR zaman
FREE

///XShea///
Seviye geçişlerine uygulanan göstergenin (MFI) mantığına dayanmaktadır. Sadece kafa derisi soyma
Gerçek hesapta birkaç aylık test ve uygulamadan sonra kullanıma sunmaya karar verdim.
alıcıların bu değerli aracı, ilgili kurallara uyulursa
Forex hesaplarınızdan çok iyi kazançlar elde edebileceksiniz.
Bu gösterge, sesli uyarılar ve anlık bildirimler göndermek üzere programlanmıştır.
Uygulama modu:
Yalnızc

SMARTMASS INDICATOR
This indicator is different from all known volume indicators. It has a significant distinction; it is an algorithm that relates price movement to volume, attempting to find proportionality and efficient movement while filtering out noise and other movements that are more random and do not follow a trend or reversal. Ultimately, it reveals the true strength of the movement, indicating whether it has genuine support from bulls or bears or if it's merely a high-volume movemen

[75% OFF - SALE ENDS SOON] - RevCan Trend Entry Point is a trend based trade alert indicator for serious traders. It does all the price and chart analysis all by itself, and whenever it finds any potential high quality trading opportunity(Buy or Sell) using its revolutionized price prediction algorithms, it sends instant trade alert directly on the chart, MT4 terminal and on the mobile device. The trade signals will be visible on the chart as Up and Down arrows, while the instant audible ale

I'm sure after a lot of research on the internet, you haven't found any indicator that can help you with forex or binary trading in the latest probability strategy created by famous trader Ronald Cutrim. The strategy is based on a simple count of green and red candles, checking for a numerical imbalance between them over a certain period of time on an investment market chart. If this imbalance is confirmed and is equal to or greater than 16%, according to trader Ronald Cutrim, creator of the pro
FREE
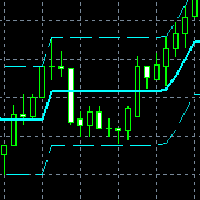
It is a new indicator that frames the price movement and tracks it. It consists of oscillation channel and its center line CL . For its calculation it is only necessary to introduce the amplitude of the channel. Because of this, it is a non-lagging indicator as it is not calculated based on a number of previous candlesticks. It removes any level of noise , showing the underlying price movement cleanly via the center line . It allows you to easily identify the beginnings a
Multiple Timeframe Trend Alert
I. Overview
Real-time analysis of trends on nine time frames (M1, M5, M15, M30, H1, H4, D1, W1, MN1) based on the calculation of highs and lows using swing highs and lows and Dow Theory. Indicator sends notifications (alerts) when the trends of the specified time frames match.
II. Advantage
Since this indicator notifies you when a trend coincides, you can seize trading opportunities without having to stay on the charts.
In addition, by introducing this i

The most sensitive indicator you've ever seen . . .
POscillator is a sensitive indicator to find each trend direction change in every timeframe. It shows price variations and reveals up or down trends. POscillator makes a price curve based on frequency filters. The procedure makes two price functions by using high-frequency and low-frequency filters separately. Then it adds them together to create a smoothed price curve. The final stage of the indicator converts this smoothed curve to an osci
FREE
MT4 Version A versatile tool
You do not need any other tools with this tool.
You can enable or disable all indicators.
Their values are adjustable.
In the first line you will see a summary of your account status.
p: The amount of your profit or loss
BP: The amount of your daily profit based on the balance
EP: Equity daily earnings
WP: Your weekly profit
MP: Your monthly profit
The next line shows each of the time frames you selected.
Chikou: The Chikou process
KT: The trend of t

Every indicator has its advantages and disadvantages. Trending ones show good signals during a trend, but lag during a flat. Flat ones thrive in the flat, but die off as soon as a trend comes. All this would not be a problem, if it was easy to predict when a flat changes to a trend and when a trend changes to a flat, but in practice it is an extremely serious task. What if you develop such an algorithm, which could eliminate an indicator's flaws and enhance its strengths? What if such an algorit

This is a multi frame stochastic indicator, you can attach any time frame of stoch indicator on one chart. It is very useful if you like to check multi time frame stoch data. If you are interested in EA,click below links to take a look: https://www.mql5.com/en/market/product/80170 https://www.mql5.com/en/market/product/81136
How to use: > Atach the first time frame you want on to the currency pair's chart > Atach the second time frame you want on to the currency pair's chart > Atach the thir
FREE

MACD with fast and slow EMA. Moving average convergence divergence (MACD) is a trend-following momentum indicator that shows the relationship between two moving averages of a security's price . The MACD is calculated by subtracting the fast-period exponential moving average (EMA) from the slow-period EMA. Setup options: Fast EMA period Slow EMA period Signal EMA period Applied price Indicator window height Color MACD Color Signal Color Histogram
Average Daily Range with factor target and more functions (ADR)
Hello traders,
The upgraded ADR dashboard now is also for MT5 much more better and more convenient for day trader, try it to experience the good things!
How to use Average Daily Range (ADR) Indicator?
ADR is just a simple indicator tool to help trader identify the daily average range of an instrument. So for example we have the pairs EURUSD and that pairs usually makes a peak and bottom during the trading day an

The most sensitive indicator you've ever seen! And now with Alerts
POscillator Alert is a sensitive indicator that finds each trend direction change in every timeframe and then notifies you with the necessary alarms. It's a new version of the POscillator Indicator, with the addition of its alarm sending capability. The Indicator can send multiple alerts: email, mobile phone notification, alert window and alert sound. All of these different alarms are optional and you can choose the ones you

New Trend Alerts finds new trends at the changing bar very quickly. If the trend has enough power and a quality up/down angle, then the indicator sends multiple alarms to alert you: via email, mobile notification, alert window and alert sound. All of these different alarms are optional, and you can choose which ones you would like to use. The indicator calculates the derivative of the price chart to reveal the slope of price curve and its sign changes. Red bars indicate a positive sign or uptre

CHART OBJECTS: Blue box : Bullish Order Blocks (OB) Red box : Bearish OB Orange box : Mitigated OB. Price bounce from this area the made a new high/low Light gray box : Price bounced from this area but did not made a new high/low Dark gray box : Broken OB. Filled boxes : TimeFrame 1 Order Blocks
Unfilled boxes : TimeFrame 2 Order Blocks
INDICATOR SETTINGS: Order Block Required Length: Required number of subsequent candles in the same direction to identify Order Block. Default value: 5 Im

In this indicator, Heiken Ashi candles are calculated with the most optimal method. You can also customize the results by adjusting the amount of period and method input. But the most important advantage of this indicator is the adjustment of the time frame value. You can use this to calculate the Heiken Ashi chandels to See in time frames with lottery in the lower time chart. In this case, you get the best signal to buy or sell using two or more Heiken Ashi indicators with different timeframes
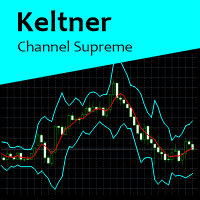
Keltner Channel Supreme is a indicator based on Keltner Channels, with some configuration besides period and Keltner multiplier factor. In this indicator, it is possible to change to an exponential moving average and if prices will be calculated according to close price or typical price. This indicator works on all graphics. If you have some doubt, please PM.
John Bollinger's normalized MFI (Fund Flow Index). Bollinger bands are used to calculate overbought/oversold areas. It takes three input parameters: MFI period - MFI calculation period MFI Applied Volume - Calculates the volume of MFI transactions BB period - Calculation period of the Bollinger band BB deviation - Brin deviation Calculation: NormMFI = (MFI-BL) / (TL-BL) Among them: TL = BBands(MFI, BB period, BB deviation, UPPER_BAND) BL = BBands(MFI, BB period, BB deviation, LOWER_BAND) MFI - M

30% Discounted ONLY 10 COPIES HURRY UP! 8 LEFT COPIES MTF UPDATED IN NEW VERSION Note: If MTF Order Not Work just do one thing one, when you set Show_mtf to true then don't change otf timeframe instead you insert indicator and then again open setting and change current otftimeframe to other in this way it will work. It issue from Mql5 not refresh setting properly. Very precise patterns to detect High Accurate Order Blocks: It Draw zone after market Structure Breakout with a high Accuracy,
Bu filtre, Bessel polinomlarına dayanmaktadır. Ana avantajı, küçük bir zaman gecikmesidir. Bu filtrenin bir diğer özelliği de finansal zaman serilerinin en son değerlerine karşı yüksek duyarlılığıdır. Bu nedenle gösterge, gürültü sapmalarını yumuşatırken aktif fiyat hareketlerini vurgular. Klasik varyanta ek olarak, bir ağırlık fonksiyonu olarak göstergeye Bessel katsayılarının logaritmaları eklenmiştir. Bu durumda, göstergenin daha yumuşak olduğu ortaya çıkıyor, ancak aynı zamanda fiyat aktif
Novice or Expert, our top of the line multi-time span Turn Prof will upgrade your exchanging and carry you extraordinary exchange amazing open doors with the Help and Obstruction levels that experts use.
Turn exchanging is a straightforward compelling technique for entering and leaving the market at key levels and has been utilized by experts for quite a long time and chips away at all images: Forex, Crypto, Stocks, Indicies and so on.
Turn Prof carries premium levels to the broker where th

!! FLASH SALE !! Over 80% off !! For ONE week only. Now only $47 - normally $297! >>> Ends on 30 June 2023 - Don't miss it!
Buy and Sell Arrows when price is about to retrace. It Also Sends Alerts – On MT5 To Your Phone To Your Email
Does not repaint.
Works ony any pair, any timeframe.
10 Activations allowed so you are free from limitations
See an example of alerts from today (23 May 2020) using this and 2 other indicators here .
MT4 Version here . Spreads from 0.1p

!! FLASH SALE !! Over 80% off !! For ONE week only. Now only $47 - normally $297!
Buy And Sell Arrows On The Chart When The Trend Is About To Continue. Sends Alerts – On MT5 To Your Phone To Your Email.
Does not repaint.
Works on any pair, any timeframe. (Just ajust the settings for your pair and timeframe.)
10 Activations allowed so you are free from limitations
See an example of alerts from today (23 May 2020) using this and 2 other indicators here .
MT4 version here.

Imbalance / Fair Value Gap (FVG) , this is a zone / gap created when the price move with force in a given direction. It identify a zone where the price could potentially go back. This gives perfect targets for your trades.
Imbalance is created from the high and low of 3 candles. When the wicks the of 1st and 3rd candle does not fully overlap the middle one.
This indicator will help you to easily spot mitigated/unmitigated imbalances in your chart. NEW UPDATE: Added Multi-Timeframe feature

The best Vwap Midas coding for Metatrader 5 you can find in White Trader indicators.
The indicator has been optimized not to recalculate (improving performance) and has several visual settings for you to adapt in your own way. TRY IT FOR FREE by clicking the free demo button Where and why to use Vwap Midas (and Auto Zig Vwap Midas) can be used on a variety of indices, currencies, forex, cryptocurrencies, stocks, indices and commodities.
Many successful traders use price and volume to ge
MetaTrader Mağaza, MetaTrader platformu için uygulama satın almak adına rahat ve güvenli bir ortam sunar. Strateji Sınayıcıda test etmek için Uzman Danışmanların ve göstergelerin ücretsiz demo sürümlerini doğrudan terminalinizden indirin.
Performanslarını izlemek için uygulamaları farklı modlarda test edin ve MQL5.community ödeme sistemini kullanarak istediğiniz ürün için ödeme yapın.
Ticaret fırsatlarını kaçırıyorsunuz:
- Ücretsiz ticaret uygulamaları
- İşlem kopyalama için 8.000'den fazla sinyal
- Finansal piyasaları keşfetmek için ekonomik haberler
Kayıt
Giriş yap
Gizlilik ve Veri Koruma Politikasını ve MQL5.com Kullanım Şartlarını kabul edersiniz
Hesabınız yoksa, lütfen kaydolun
MQL5.com web sitesine giriş yapmak için çerezlerin kullanımına izin vermelisiniz.
Lütfen tarayıcınızda gerekli ayarı etkinleştirin, aksi takdirde giriş yapamazsınız.