YouTube'dan Mağaza ile ilgili eğitici videoları izleyin
Bir alım-satım robotu veya gösterge nasıl satın alınır?
Uzman Danışmanınızı
sanal sunucuda çalıştırın
sanal sunucuda çalıştırın
Satın almadan önce göstergeyi/alım-satım robotunu test edin
Mağazada kazanç sağlamak ister misiniz?
Satış için bir ürün nasıl sunulur?
MetaTrader 5 için yeni teknik göstergeler - 8

Esse indicador mede o 1º Canal de referencia e a 1º Zona Neutra * configurar o canal macro para verificar a frequencia MAIOR H1 H4 1D * configurar o canal micro para verificar a frequencia Menor 1M 5M 15M Como instalar o Indicador fimathe. E uma pré mentoria tem uma estrategia Secreta bonus nesse video . assitao o video para enteder as logicas que podemos iniciar com esse indicador.
https://www.youtube.com/playlist?list=PLxg54MWVGlJzzKuaEntFbyI4ospQi3Kw2

Indicador IPCPayroll – O Segredo dos Traders de Sucesso! Quer operar com mais confiança e precisão com os preços do dia da divulgação do Payroll e do IPC Americano ? O Indicador IPCPayroll foi desenvolvido para traders que querem acompanhar o impacto dessas notícias no mercado de forma estratégica e organizada. Marcação Automática das Notícias
O indicador insere automaticamente linhas horizontais no preço de abertura do candle de 5 minutos das datas de Payroll e IPC. Visualização Clar

The TMA Centered Bands Indicator for MT5 draws bands on the chart and shows the overall price trend. It displays three bands - the lower and upper boundaries of the channel and the median. The bands are made up of moving averages, and each of them has an MA period. The name TMA comes from triangular moving averages, as the indicator draws triangular bands. The price will fluctuate between these ranges whenever the trend changes direction, thus creating entry and exit points. How to trade
FREE
The TrendChannelTracker Indicator is an innovative Forex trading tool. This indicator, which is based on the standard Stochastic Oscillator, provides traders with a unique and simplified method for observing market trends. In contrast to the traditional Stochastic Oscillator, which is shown at the bottom of the chart, the TrendChannelTracker Indicator is built into the price action itself. This removes the need for traders to continually switch their attention between the oscillator and the pri
FREE
The Kalires Channel Indicator is a technical indicator used to evaluate trend direction and potential trading opportunities. This is a hybrid indicator that combines Kauffman Adaptive Moving Average (KAMA), linear regression and smoothing. The Kalires Channel Indicator consists of two lines: one central and two outer bands. The central line is a smoothed KAMA modified according to the direction of the trend. The outer bars represent two linear regression lines drawn above and below the center l
FREE

The BandsFill Indicator is a modified Bollinger Bands with a colored cloud. It has two adjustable parameters: Period Deviation The cloud is colored as follows: If the price crosses the upper band, the cloud is blue. If the price crosses the lower band, the cloud is pink. Thanks to this, the BandsFill Indicator provides traders with an easy opportunity to detect various features and patterns in price dynamics that are invisible to the naked eye. Based on this information, traders can predict
FREE

Mucize umarak bu sistemi indirmenizi istemiyorum. Bu araç ne kadar iyi tasarlanmış olursa olsun, operasyonlarınızda gerçek bir dönüşümün parçası olmayı amaçlıyor. Sunduğu imkânları en iyi şekilde değerlendirin, analizler yapın, kendinizi profesyonel olarak geliştirin, büyük bir oyuncu gibi düşünün.
Bilgi güvenliğinde kaba kuvvet saldırısı, parolaları, oturum açma kimlik bilgilerini veya kriptografik anahtarları keşfetmek için sistematik bir deneme yanılma yönteminden oluşur. Bu yaklaşımdan ilh
FREE

TW Trend Scalper Indicator:
The TW Scalper Shoot, en son ticaret stratejilerini ve yapay zeka teknolojisini kullanarak size benzersiz bir ticaret deneyimi sunar. Bu ürün, iki farklı sinyal kategorisi sağlayarak skaler tüccarların çeşitli ihtiyaçlarını karşılamaktadır:
Bu olağanüstü ürünü bugün test edin ve bir trend skaler olma yolunda benzersiz deneyiminize başlayın.
Ayrıca, 37 $ değerinde bir ürünü hediye olarak alın.
Sinyal Kategorileri:
1. Uzun vadeli ve Güvenli Sinyaller: Bu sinyaller
MENA TREND INDICATOR & SCANNER Çoklu Zaman Dilimlerinde Trend Analizi ve İşlem Gerçekleştirme İçin Kapsamlı Araç MENA TREND INDICATOR & SCANNER , piyasayı görsel ve yapılandırılmış bir yaklaşımla analiz ederek trendleri belirlemek ve işlemleri gerçekleştirmek üzere tasarlanmış kapsamlı bir ticaret çözümüdür. Bu araç, gerçek zamanlı trend tespiti, çoklu zaman dilimi analizi ve işlem performansı izleme özelliklerini entegre ederek, manuel ve otomatik ticaret stratejileri için çok yönlü bir çözüm s

ATR Master – Grafiğinizdeki Volatilite Ustası! ATR Master, profesyonel bir ATR göstergesidir ve önemli verileri anında doğrudan grafik üzerinde görüntüler! Fiyat hareket aralığını analiz etmenize, kat edilen mesafeyi belirlemenize ve kalan potansiyeli değerlendirmenize yardımcı olur. Ayrıca mum sayacını ve mevcut spreadi izleyebilirsiniz. Tüccarlar Neden ATR Master’ı Seçiyor? Günlük ATR Analizi – Günlük ortalama fiyat hareket aralığını görün, seçilen dönem parantez içinde gösterilir.
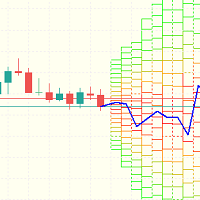
Gösterge Brownian hareketi ve Monte Carlo iterasyonlarını kullanarak fiyatın belirli bir yöne hareket etme olasılığını hesaplar . Gösterge neyi gösteriyor? Bir yandan, fiyatın belirli seviyelere ulaşma olasılığına göre alanı üç bölgeye ayıran ısı haritasını çizer: Kırmızı bölge : Olasılık %50'den fazla . Turuncu bölge : Olasılık %25 ile %50 arasında . Yeşil bölge : Olasılık %25'in altında . Öte yandan, en olası hareket yönünü temsil eden mavi çizgiyi çizer.

Market Structure Indicator BOS CHOCH MT5
The Market Structure Indicator (BOS-CHOCH) is a specialized ICT-style tool designed for MetaTrader 5 (MT5) . This indicator detects both primary and secondary market character shifts (CHOCH) and breaks in structure (BOS) across multiple levels, offering valuable insights for ICT and Smart Money traders . By helping traders analyze price behavior, it enhances market structure recognition and provides more precise trade opportunities. «Indicator Installati
FREE
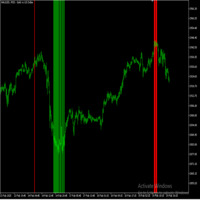
Reversal Radar – Piyasa Dönüş Analizi için Teknik Gösterge Genel Bakış
Reversal Radar, potansiyel piyasa dönüş noktalarını belirlemeye yardımcı olmak amacıyla geliştirilmiş bir teknik göstergedir. Tarihsel fiyat verilerini analiz ederek, önemli zirve ve dipleri tespit eder ve traderların piyasa momentumunun değişebileceği bölgeleri tanımlamasına yardımcı olacak görsel sinyaller sunar. Ana Özellikler Aşırı Fiyat Tespiti:
Piyasa yönündeki potansiyel değişiklikleri işaret edebilecek dikkate değe
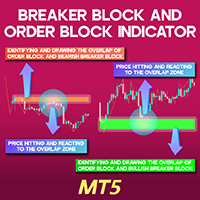
Breaker Block and Order Block Indicator for MT5
The Breaker Block and Order Block Indicator (BB+OB) is specifically developed for traders using ICT strategies to recognize key market zones. This tool employs a unique algorithm to detect intersections of Order Blocks and Breaker Blocks , highlighting them on the chart in green for bullish zones and brown for bearish zones on the MetaTrader 5 (MT5) platform. By utilizing this indicator, traders can improve their market entries and exits, refining
FREE
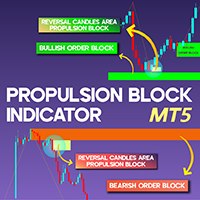
Propulsion Block Indicator for MT5
The Propulsion Block Indicator (ICT Propulsion Block) in MetaTrader 5 is an advanced analytical tool designed to detect price shifts and liquidity zones. These propulsion blocks emerge after the last candle revisits an order block, absorbing liquidity following notable price movements. This indicator pinpoints critical areas where order blocks intersect with Supply and Demand Zones , automatically updating the chart once the price enters one of these designate
FREE

Rejection Block Indicator and Void MT5
The Rejection Block Indicator is a powerful tool designed to detect market reversal zones in MetaTrader 5 . By analyzing candle wicks, this indicator marks crucial rejection block areas where long upper shadows near price highs and lower shadows near price lows act as potential reversal points. Additionally, the Void (absorbed portion) within the rejection blocks is highlighted in gray. Once this void is entirely filled, it signals that the level has lost
FREE
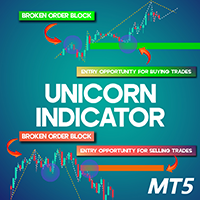
Unicorn Indicator MT5
The Unicorn Indicator is a sophisticated MetaTrader 5 tool designed to identify price gaps and highlight them using Breaker Blocks on the price chart. A Breaker Block represents an order block that initially gets broken but later acts as a strong support level when the price revisits it. A Unicorn zone emerges when a Breaker Block coincides with a Fair Value Gap (FVG). The indicator visually marks bullish Unicorn zones in green and bearish Unicorn zones in red, displaying
FREE
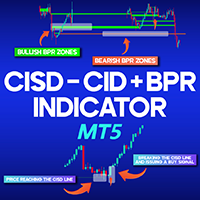
CISD-CSD & BPR Combined Indicator MT5
The CISD-CSD + BPR Combined Indicator is an advanced tool based on the ICT (Inner Circle Trader) trading style in MetaTrader 5. This indicator utilizes the three concepts of "CSD," "CISD," and "BPR" to identify specific zones on the chart and issue trading signals under appropriate conditions. The "CISD" concept comprises four elements: consolidation , impulse , fluctuation , and divergence . Typically, the price exits these zones with a rapid movement ( I
FREE
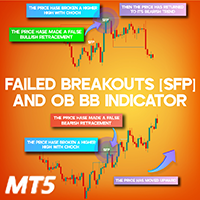
Swing Failure Pattern BB OB Indicator for MT5
The Swing Failure Pattern (SFP) indicator is a valuable tool in MetaTrader 5, designed to identify false breakouts and key market reversal points. This indicator provides a visual representation of significant price action events such as Break of Structure (BOS), Change of Character (CHoCH), and Fake Breakout (SFP). It is particularly useful for traders following price action strategies, ICT methodologies, and Smart Money trading concepts to pinpoin
FREE
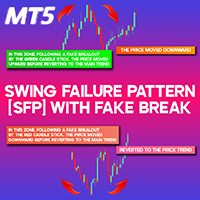
Swing Failure Pattern (SFP) with Fake Break Indicator for MT5
The Swing Failure Pattern (SFP) Indicator in MetaTrader 5 is designed to identify deceptive breakouts in financial markets. This pattern appears when the price momentarily surpasses key levels, such as previous highs or lows, triggering stop-loss orders and liquidity traps. However, instead of continuing in that direction, the price swiftly reverses, signaling a false breakout . The main function of the SFP pattern is to exploit liqu
FREE
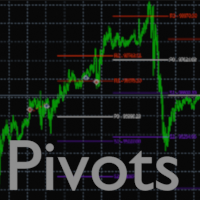
Pivots Points Indicator:
Displays the Pivots Points lines for the Daily, Weekly or Monthly periods
Several parameters are possible:
1 - Choice of calculation method:
- Classic
- Woodie
- Camarilla
- Fibonacci
2 - The choice of the period for calculating the pivot points ( Daily, Weekly or Monthly )
3 - The display or not of the price labels (to the right of each line) as well as the size of the associated font
4 - The number of pivot points (previous) that we want to display
5 - Po

Manyal trading system, CovEchoTrend Robot, focuses on reliability and flexibility. By employing statistical analysis methods to study the relationships between the base indicator and market patterns, the system enables a deeper understanding of market processes. Intelligent pattern analysis: The application of statistical data processing helps identify key trend reversal points more accurately, signaling significant market shifts. Informed decision-making is based on the intersection of indicato
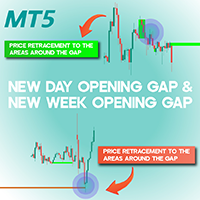
New Day Opening Gap and New Week Opening Gap NWOG NDOG MT5 The New Day and New Week Opening Gap (NDOG-NWOG) indicator is a powerful tool designed for traders using MetaTrader 5. It detects price gaps that emerge at the start of a new trading day or week and visually represents them on the chart. When the market reopens following a daily or weekly closure, the price often shifts from its prior closing level, leading to a gap. This indicator highlights weekly gaps (NWOG) in red and daily gaps (
Breaker Block & Void Indicator MT5
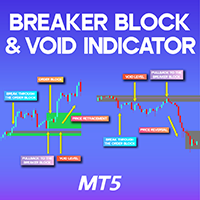
A Breaker Block represents a price zone where the market revisits after breaching an Order Block . In simple terms, when the price pulls back to a previously broken order block, it forms a breaker block. The Breaker Block Indicator is designed to automatically detect these critical zones, marking them once an order block is violated and the price retraces. By analyzing market movements, it helps traders identify recurring patterns in price action. «Indicator I
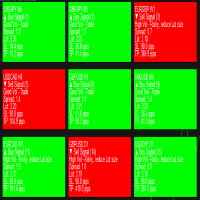
Introducing Telos Dashboard Indicator – Your Ultimate Trading Companion Optimized For Forex! Note: This is a dashboard indicator and won't work on the strategy tester. Demoing it there is a waste. Instead get the main indicator or, use the demo of DynamicCOG to see how it works with arrows, although Telos is a more refined and filtered version than the DynamicCOG indicator. Never Miss a Trading Opportunity Again!
Welcome to the future of trading with the Telos Dashboard Indicator ! Inspired

The indicator is designed to help in making a decision on the direction of trading (buy or sell). It is a history scanner that searches for matches of the current pattern (combination of several current bars) with historical data in percentage terms by the relative vertical position of candles relative to each other, the size of each candle, the size of the candle body and the candle shadows. In history, the matches found are indicated by vertical lines on the candle of the beginning of the soug

Historical Equity Flow Indicator (HEFI)
Description HEFI is an indicator for MetaTrader 5 that visualizes the dynamics of account balance and floating balance in real time. It helps traders analyze the historical effectiveness of their trading, as well as assess the current state of open positions.
What is it intended for?
Account balance tracking, taking into account closed transactions for the selected period.
Displaying a floating balance (balance + uncovered profits/losses).
Analysis o
FREE

The key logic of SignalTech is generated by Artificial Intelligence. The machine learning module should continue optimizing the core logic on the server side to guarantee that SignalTech System can accurately track the market's movement.
SignalTech can generate AI based signals with Buy/Sell Arrows and Pop-Up/Sound Alerts. Each signal has clear Entry and stop Loss levels, which should be automatically flagged on the chart, as well as potential Targets 1, 2, and 3.
SignalTech can work on EURU
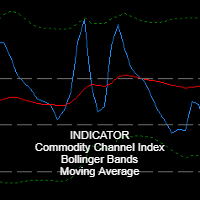
Main Indicator Description: RosMaFin Triple Insight CCI Navigator is an advanced technical indicator that combines the power of three popular indicators - CCI (Commodity Channel Index), Bollinger Bands, and Moving Average - in one comprehensive window. This versatile tool provides traders with a complex view of market conditions and helps identify potential trading opportunities with greater precision. Key Features: Display of all three indicators in one window for efficient analysis Fully custo
FREE

Smart Sniper Entry Spike Detector
Advanced AI-Powered Spike Detection for Boom and Crash Markets
Here are my Socials, make sure you contact me to see How I Use The Spike Detector:
Free Telegram Group: https://t.me/+4jj1artnc_1mMzM8 WhatsApp: https://wa.me/+27659660169 Official Website: https://smartsniperentry.site
The Smart Sniper Entry Spike Detector harnesses cutting-edge artificial intelligence to identify high-probability trading opportunities in Boom and Crash synthetic indices. De

The "Setup Bivit" Indicator The "Setup Bivit" is an advanced technical indicator designed for MetaTrader 5, developed to provide a clear and comprehensive visual analysis of the financial market. Inspired by customized strategies, this indicator combines intuitive visual elements and decision-support tools, making it a powerful ally for traders looking to identify trends, support and resistance zones, and price patterns across different timeframes. With a rich and interactive graphical interface

Highly advanced Non-repaint MT5 Trading indicator. Arrow appears on current candle stick arrow will not disappear, The indicator works in All timeframes M1 - Monthly timeframe. Pairs to trade: US30, SPX500, NASDAQ100, GOLD BLUE ARROW- BUY SIGNAL PINK ARROW- SELL SIGNAL Note the indicator will show multiple blue arrows showing a strong uptrend. Same goes as Multiple pink arrows showing a strong downtrend Entry is on arrow direction and exit on opposite signal.
Please contact me after purchase.
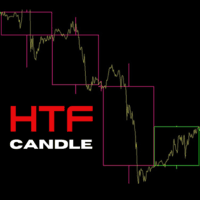
ICT Traders! Here's another cool Indicator that will allow to trade the HTF narrative while focus on price action on your entry timeframes. The following are the input for setup the indicator: Maximum Bar: The number of HTF bar you want to display High Timeframe: the Timeframe which narrative you want to base on and trade from the lower timeframe. Visual Timeframe: the largest Timeframe the indicator will print the HTF candles. Bullish Candle: The color of the bullish candle Bearish Candle: The

The "Matrix Series" indicator is a technical analysis tool designed to identify potential support and resistance zones by visualizing overbought/oversold conditions and trend direction using a combination of price data and customizable parameters, incorporating Commodity Channel Index (CCI) to highlight potential reversal points within the market.
Key features of the Matrix Series indicator: Dynamic Zones: Calculates support and resistance levels based on CCI values, allowing users to adjust th
FREE

A Fair Value Gap (FVG) is a three-candle price imbalance where price moves aggressively in one direction, creating a gap between the wicks of the first and third candle.
How to Identify an FVG: The second candle must have a large body , showing strong displacement.
The wick of the third candle must not overlap with the wick of the first candle , leaving an inefficiency. The third candle should not close beyond the high (bullish) or low (bearish) of the second candle.
Usage: Internal Range
ADBIN BAND – Adaptive Channel Indicator for XAUUSD and DE30
Description:
The ADBIN BAND is a trading indicator designed for analysis of XAUUSD (Gold) and DE30 (German Stock Index) . It generates dynamic price channels using an Adaptive Moving Average (AMA) to reflect market volatility. Functionality: Dynamic Channels : Plots upper and lower bands around price, adjusting to volatility via AMA. Signal Generation : A green arrow appears when price closes above the upper band. A r

Super Trend Indicator – Trend Following Tool
Description:
The Super Trend Indicator is a trend-following tool designed to assist traders in identifying market trends. Utilizing the Average True Range (ATR), it dynamically adjusts to market volatility and generates visual signals. The indicator plots lines directly on the chart, changing color based on trend direction. Crosses between the price and indicator line may suggest potential trend shifts. Key Features: Dynamic trend detection using ATR.
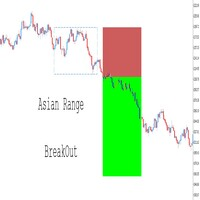
Türkçe (Turkish): Tamamen özelleştirilebilir – Aralık süresi, renkler, çizgi stilleri ve risk-getiri ayarları gibi parametreleri değiştirerek göstergenizi kendi işlem stilinize göre uyarlayın. İşlem seviyelerinin görselleştirilmesi – Kırılma koşullarına bağlı olarak giriş fiyatı, zarar durdurma (SL) ve kar alma (TP) seviyelerini otomatik olarak çizer. Uzman Danışmanlar (EAs) ile sorunsuz entegrasyon – Otomatik stratejileriniz üzerinde tam kontrol sağlayarak RSI, Hareketli Ortalamalar,
FREE
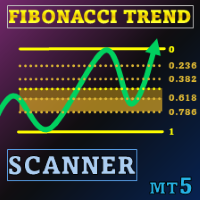
Özel Fırsat : ALL TOOLS , her biri sadece $35 ! New tools will be $30 for the first week or the first 3 purchases ! Trading Tools Channel on MQL5 : Join my MQL5 channel to update the latest news from me Volatil bir işlem ortamında, güçlü ve sezgisel bir analiz aracı fırsatları hızla yakalamanıza yardımcı olabilir. Fibonacci Trend Scanner, sadece geleneksel Fibonacci indikatörü ve SuperTrend işlevlerini bir araya getirmekle kalmaz, aynı zamanda para birimi taraması, çoklu zaman dili

Önemli Not: Ekran görüntülerinde gösterilen "Bazı görseller" benim indikatörlerim olan Suleiman Levels Indicator ve RSI Trend V Indicator 'dan alınmıştır. RSI Trend V Indicator trend belirleme amacıyla tasarlanmış olup, Fibonacci ile entegre edilerek hedef bölgeleri ve potansiyel geri dönüş noktalarını belirler. Bu, genel trend yönünü belirlemede son derece güçlü, katı ve kullanışlı bir indikatördür. Potansiyel fiyat hareketi geri dönüş bölgelerinde görünen yükseliş ve düşüş okları içerir. Anca
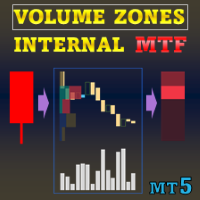
Özel fırsat : ALL TOOLS , her biri sadece $35 ! New tools will be $30 for the first week or the first 3 purchases ! Trading Tools Channel on MQL5 : Join my MQL5 channel to update the latest news from me Volume Zones Internal Visualizer Multi-Timeframe – Daha yüksek zaman dilimi grafiğinde işlem yaparken, daha düşük zaman dilimlerindeki hacim hareketlerini detaylı şekilde görüntülemenizi sağlayan en üst düzey çözüm. Çok zaman dilimli (multi-timeframe) özelliğini destekleyen, güçlü v
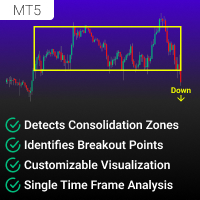
Consolidation and Breakout Detector , konsolidasyon bölgelerini (yatay piyasalar) belirlemek ve breakout fırsatlarını tespit etmek isteyen yatırımcılar için tasarlanmış gelişmiş bir tek zaman dilimli MT5 göstergesidir .
Bu gösterge, geçmiş fiyat hareketlerini otomatik olarak tarar, piyasanın yatay hareket ettiği bölgeleri belirler ve geçerli bir breakout oluştuğunda yatırımcıları uyarır . Bu araç, breakout yatırımcıları, trend takipçileri ve yatay piyasa yatırımcıları için faydalıdır ve fiyat ya
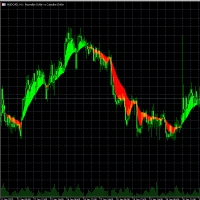
CrossMann is a simple and elegant indicator for MetaTrader 5, which represents the areas of intersection of moving averages.
This indicator displays two Exponential Moving Averages (EMA), with different periods, calculated by closing prices, and colors the ranges of their intersection in two colors - for buying and selling.
The indicator will work great on all trading instruments and timeframes in strategies where a similar principle is used.
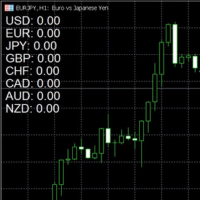
Yeni Ticaret Aracı: İşlemlerinizi Optimize Edin! Size, soru sormadan işlemlerinizi yapabilmeniz için geliştirdiğim yepyeni bir aracı tanıtmaktan büyük heyecan duyuyorum! Geleneksel göstergelerin aksine, bu araç sadece fiyat değişimlerini takip etmekle kalmaz. O, dövizler arasındaki korelasyonları derinlemesine analiz eder ve piyasaya giriş için stratejik anları tespit etmenize yardımcı olur. İşte nasıl çalıştığı: Sıfır = İşlem Yok: Göstergem sıfırda olduğunda, bu piyasa koşullarının uygun

ShoukatSRI is an advanced MQL5 indicator designed to help traders identify potential market trend changes before they fully develop. Using a combination of smoothing techniques and custom signal logic, the indicator processes market data to provide early alerts through clearly defined buy and sell signals. Key Features: • Early Trend Detection – The indicator employs advanced algorithms such as SuperSmoother, Gaussian filtering, and ALMA to smooth out market noise and highlight significant movem
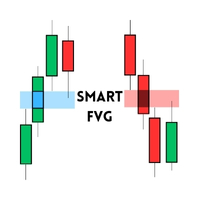
Smart FVG Indicator – Advanced Fair Value Gap Detection for MT5 Enhance Your Trading with the Smart FVG Indicator! Are you looking to identify Fair Value Gaps (FVGs) effectively and integrate them into your trading strategy? The Smart FVG Indicator for MetaTrader 5 (MT5) offers a comprehensive solution to detect and utilize FVGs, providing you with a trading edge. Key Features: Dynamic FVG Detection: Automatically scans and highlights FVGs on your charts, indicating potential institutional
FREE

BOS and CHOCH with Label Indicator MT5
The BOS-CHOCH market structure shift detector is an advanced tool designed for traders who analyze internal price movements on the MetaTrader 5 (MT5) platform . This indicator leverages sophisticated algorithms to cater specifically to traders following ICT (Inner Circle Trader) and Smart Money trading methods . It automatically detects Break of Structure (BOS) and Change of Character (CHOCH) and marks them on the chart with clearly labeled annotations. A
FREE

Fair Value Gap Void MT5
The Fair Value Gap and Void (FVG + Void) indicator is specifically designed for ICT and Smart Money (SMC) traders, utilizing sophisticated algorithms to detect and highlight imbalance zones and FVGs on price charts. This tool is tailored for the MetaTrader 5 (MT5) platform, where bullish FVGs are represented in green and bearish FVGs in brown, allowing traders to quickly recognize critical trading areas. When the price revisits these zones, the indicator marks the portio
FREE

This MetaTrader 5 indicator identifies and visually displays the trading hours of major financial markets (Europe, US, and Asia) on the chart. Through customizable colored fills, it marks the trading periods of each market, respecting server times (GMT+2) and excluding weekends. Market names are displayed near the top of the chart in Arial Black font, also with customizable color. The indicator automatically adjusts to the chart scale, maintaining the fill across its entire vertical range.
FREE

Improved Fair Value Gap Void MT5
The Improved Fair Value Gap (iFVG + Void) indicator for MetaTrader 5 is an advanced iteration of the traditional Fair Value Gap "FVG" indicator. Fair Value Gaps emerge following sharp price movements, marking crucial zones where supply and demand are unbalanced. Price action often gravitates back to these levels. This indicator visually marks bullish Fair Value Gaps (FVG) with green boxes and bearish Fair Value Gaps with red boxes. Additionally, it shades the us
FREE

Order Block Void Indicator MT5
The Order Block + Void Indicator in MetaTrader 5 is an advanced tool designed to detect key liquidity areas and highlight them as order blocks. These zones are frequently utilized by institutional traders, making them ideal reference points for determining support and resistance levels. This indicator visually marks bullish order blocks with green boxes and bearish order blocks with red boxes. Additionally, once an order block is consumed, it turns gray to indic
FREE
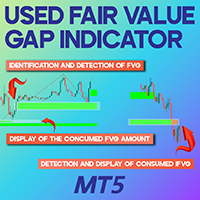
Modified Fair Value Gap (FVG) Indicator for MT5
The Modified Fair Value Gap (Modified FVG-iFVG) indicator is a sophisticated and efficient tool designed for ICT and Smart Money traders, optimized for the MetaTrader 5 (MT5) platform. This indicator detects and marks market imbalance areas (FVG), highlighting key supply and demand zones. Bullish FVG zones are displayed in green, while bearish FVG zones appear in brown. As the price revisits these levels, the indicator dynamically updates by progr
FREE
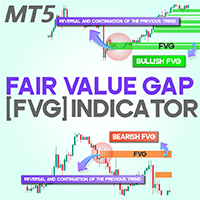
Fair Value Gap or FVG indicator MT5
The Fair Value Gap (FVG) Indicator is a valuable asset for traders using MetaTrader 5, designed to highlight market inefficiencies. An FVG occurs when an imbalance between supply and demand causes a rapid price movement. To understand this, picture three consecutive candlesticks; the space between the first and third candlestick represents the "FVG." This indicator automatically marks these gaps on the chart using dynamic boxes—green for bullish FVGs and red
FREE
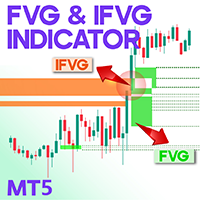
FVG and IFVG Indicator for MT5
The Fair Value Gap (FVG) indicator for MetaTrader 5 is a specialized tool designed to detect critical liquidity zones in line with the ICT trading methodology. These gaps emerge following strong, directional price movements, during which certain price levels remain untraded due to high volatility. Over time, prices often retrace to fill these gaps, creating strategic trading opportunities. «Indicator Installation & User Guide» MT5 Indicator Installation | FVG an
Reversal Zones Pro – an indicator specifically designed for accurately identifying key trend reversal zones. It calculates the average true range of price movement from lower to upper boundaries and visually displays potential reversal zones directly on the chart, helping traders efficiently pinpoint crucial turning points in the market. Key Features: Reversal Zone Identification: The indicator visually highlights potential reversal zones directly on the chart, enabling traders to effectively id
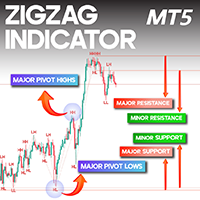
ZigZag Indicator with Labels for MT5
The ZigZag Indicator with Labels is a valuable tool for traders using MetaTrader 5 (MT5) to identify market structure by pinpointing significant highs and lows. This indicator enhances technical analysis by distinguishing between major turning points, which define broader trends, and minor fluctuations, which indicate internal price movements. It is especially useful for Elliott Wave analysts , enabling them to track market dynamics effectively and recognize
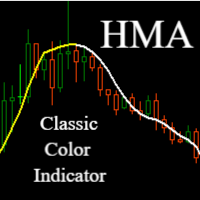
Hull Moving Average (HMA) - Faster and More Precise Trend Tracking
Hull Moving Average represents a revolutionary approach to trend analysis that overcomes the common shortcomings of traditional moving averages. This advanced indicator, developed by Alan Hull, practically eliminates the lag typical for standard moving averages while maintaining exceptional signal smoothness.
Key Benefits:
Significantly faster response to trend changes than traditional moving averages Minimal lag while mainta
FREE

MYHISTOGRAM MT5 MyHistogram is a powerful technical analysis tool designed to help traders visualize the distance between price extremes and a moving average. By calculating and displaying this distance in a histogram format, it allows traders to quickly assess market trends, spot potential reversals, and make more informed trading decisions. The indicator is highly customizable, enabling users to select different timeframes, moving average types, and applied price settings. Additionally, it fea
FREE
How Antabod Stochastic Works Antabod Stochastic is a cutting-edge technical indicator designed to analyze market momentum and identify overbought and oversold conditions with unparalleled precision. Here's a breakdown of how it works and what makes it a game-changer for traders: ________________________________________ 1. Core Concept At its heart, Antabod Stochastic is based on the stochastic oscillator principle, which measures the position of a current price relative to its range over a spec

MT5 Session Indicator: Track Global Market Hours with Precision Boost your trading strategy with this FREE Session Indicator for MetaTrader 5 , designed to help you effortlessly identify active trading sessions across global markets. Perfect for forex, stocks, and commodities traders, this tool highlights key market hours (Asian, European, North American, and overlaps) directly on your chart, ensuring you never miss high-liquidity periods. Key Features:
Visual Session Overlays : Clear color-c
FREE
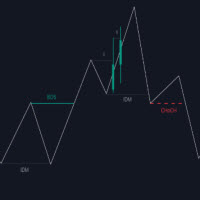
The Market Structure with Inducements & Sweeps indicator is a unique take on Smart Money Concepts related market structure labels that aims to give traders a more precise interpretation considering various factors. Compared to traditional market structure scripts that include Change of Character (CHoCH) & Break of Structures (BOS) -- this script also includes the detection of Inducements (IDM) & Sweeps which are major components of determining other structures labeled on the chart. SMC & price a

Simple Vwap with the daily, weekly and monthly
VWAP is the abbreviation for volume-weighted average price , which is a technical analysis tool that shows the ratio of an asset's price to its total trade volume. It provides traders and investors with a measure of the average price at which a stock is traded over a given period of time.
How it's used Identify entry and exit points: Traders can use VWAP to determine when to buy or sell an asset. Understand price trends : Traders can use V
FREE

Solar Prediction – Indicator for Market Price Analysis Solar Prediction is a tool designed to analyze market price movements. The indicator processes market dynamics and helps identify potential entry and exit points. Market data analysis without additional indicators
Flexible application – works on different timeframes
Ease of use – suitable for both beginners and experienced traders
Adaptability to market conditions – tracks price movement changes Solar Prediction is a solution

SuperTrend Indicator for MetaTrader 5
Ride Trends Like a Pro — Never Miss a Move Again Description:
The SuperTrend Indicator is your ultimate companion for mastering trend-following strategies. Designed to cut through market noise, this powerful tool combines the precision of Average True Range (ATR) with adaptive trailing stops to pinpoint trend reversals, confirm breakouts, and keep you on the right side of the market. Whether you’re trading forex, stocks, crypto, or commodities, the SuperTr
FREE

Arrow Simulator mt5 gives buy and sell signals based on non repaint arrow logic
It also shows take profit and stop loss placement based on average true range
Also provided is a simulation panel in the corner to show how the signals performed over a set number of bars
When running in strategy tester or live lower the number of bars to reduce using pc resources and speed up back testing
Filter out arrows with the ma filter if needed and choose your trading time
Default settings is for 5m EUR
Panther Scalping Indicator – The Ultimate Trading Weapon for Gold, Forex & BTC! Dominate the Markets with Precision Buy & Sell Signals! We’ve designed the Panther Scalping Indicator to give you an unfair advantage in trading Gold (XAUUSD), Forex pairs, and BTC. This powerful tool is built on the proven Panther Scalping Strategy , ensuring you never miss a high-probability trade. How It Works:
Lime Up Arrow – A clear Buy Signal when market conditions align.
Red Down Arrow – A strong
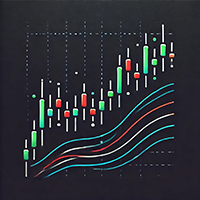
This is simple indicator for displaying Multi Moving Average line in chart, with one single Indicator. Just place the indicator in your chart, select how many MAs you want to display. And you are ready to go. Parameters can be changed on the fly by the control panel provided by the Indicator. And you can show/hide the Moving Average line just with check/unchecked in the Panel. This indicator are still in development, if you have any further feature request, please let me know in the comment.
FREE

TendencyLine Indicator - Market Trend Analysis (An exclusive indicator by PPF - Past Project Future)
General Description TendencyLine is a technical indicator developed by PPF - Past Project Future to help traders identify the prevailing market trend. It overlays a trend line based on a user-selected moving average on the price chart and displays a colored histogram that signals the trend direction.
Main Features Trend Identification: The indicator differentiates between bullish and bear
FREE
Panther Scalping Indicator – Your Ultimate Trading Edge! Maximize Your Profits with the Panther Scalping Indicator! We’ve transformed the powerful Panther Scalping Strategy into an advanced indicator that gives you precise Buy and Sell signals on Deriv’s Synthetic Indices , including Volatility Indices, Step, Jump, and Drift Switching Indices. How It Works:
Lime Up Arrow – Clear Buy Signal when market conditions align.
Red Down Arrow – Strong Sell Signal to capitalize on downtrends
The Volume-Weighted RSI (VW-RSI) is a powerful technical analysis tool that combines the traditional Relative Strength Index (RSI) with volume data to provide a more nuanced view of market conditions. By incorporating volume into the RSI calculation, the VW-RSI offers a unique perspective on price momentum, helping traders identify potential reversals, confirm trends, and filter out false signals. Below is a detailed explanation of the VW-RSI, its features, and why it stands out as a unique indi
MetaTrader mağazası, alım-satım robotları ve teknik göstergelerin benzersiz bir deposudur.
Yatırımcılara sunduğumuz benzersiz hizmetler hakkında daha fazla bilgi edinmek için MQL5.community - Kullanıcı notunu okuyun: alım-satım sinyallerini kopyalama, freelancerlar tarafından geliştirilen özel uygulamalar, ödeme sistemi aracılığıyla otomatik ödemeler ve MQL5 Bulut Ağı.
Alım-satım fırsatlarını kaçırıyorsunuz:
- Ücretsiz alım-satım uygulamaları
- İşlem kopyalama için 8.000'den fazla sinyal
- Finansal piyasaları keşfetmek için ekonomik haberler
Kayıt
Giriş yap
Gizlilik ve Veri Koruma Politikasını ve MQL5.com Kullanım Şartlarını kabul edersiniz
Hesabınız yoksa, lütfen kaydolun
MQL5.com web sitesine giriş yapmak için çerezlerin kullanımına izin vermelisiniz.
Lütfen tarayıcınızda gerekli ayarı etkinleştirin, aksi takdirde giriş yapamazsınız.