YouTube'dan Mağaza ile ilgili eğitici videoları izleyin
Bir alım-satım robotu veya gösterge nasıl satın alınır?
Uzman Danışmanınızı
sanal sunucuda çalıştırın
sanal sunucuda çalıştırın
Satın almadan önce göstergeyi/alım-satım robotunu test edin
Mağazada kazanç sağlamak ister misiniz?
Satış için bir ürün nasıl sunulur?
MetaTrader 5 için yeni teknik göstergeler
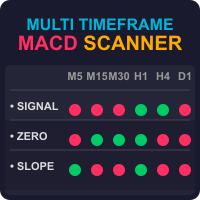
Discover the Power of the Multi Timeframe MACD Scanner for MT5 The MTF MACD Scanner indicator is a practical tool for traders using MetaTrader 5 (MT5). It takes the well-known MACD (Moving Average Convergence Divergence) indicator and turns its data into easy-to-read dashboard and candle colors on your chart. This helps you spot market trends, momentum shifts, and potential reversals without needing to analyze separate MACD lines and switch between timeframes. What Does It Do? This indicator cr

ENIGMERA: Piyasanın Çekirdeği Giriş
Bu gösterge ve alım-satım sistemi, finans piyasalarına olağanüstü bir yaklaşım sunar. ENIGMERA, destek ve direnç seviyelerini doğru hesaplamak için fraktal döngüler kullanır. Gerçek birikim fazını gösterir ve yön ile hedefler belirler. İster trendde, ister düzeltme sürecinde çalışır. Nasıl Çalışır
Gösterge işlevlerinin çoğu, grafiğin sol tarafındaki düğmelerle kontrol edilir ve farklı piyasa koşullarına hızlı yanıt verir. Düğmeler ON/OFF – Tüm göstergeleri g
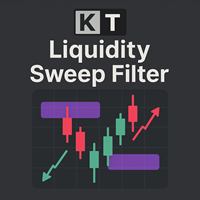
KT Liquidity Sweep Filter, kritik likidite süpürme bölgelerini tespit eder ve vurgular. Bu bölgeleri net fiyat tepkileri ve uyarlanabilir bir trend filtresiyle birleştirerek, piyasa trendiyle uyumlu hassas alım ve satım sinyalleri üretir. Araç, ana ve ikincil likidite süpürme bölgeleri arasında ayrım yapar. Ana bölgeler büyük oklarla, ikincil bölgeler ise daha küçük oklarla işaretlenir, böylece kolayca ayırt edilebilir. Büyük Oklar: Ana likidite süpürme bölgelerinden gelen güçlü dönüş sinyalleri
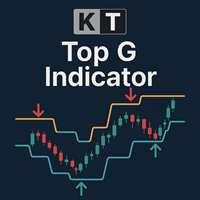
KT Top G, potansiyel piyasa tepe ve diplerini belirlemek için akıllı kanal analizini fiyat hareketine dayalı bir yapıyla birleştiren bir göstergedir. Olası bir dönüş algılandığında, grafik üzerinde kalın ve net oklar çizerek piyasadaki yön değişimi öncesinde sizi uyarır. Büyük Oklar: Fiyatın tükenmesi ve momentum değişimini algılayarak yüksek olasılıklı tepe ve dip seviyelerini vurgular. Küçük Oklar: Daha düşük olasılıklı dönüş noktalarını gösterir; bu noktalar genellikle piyasa gerçekten dönmed

ICT NewYork Açık Killzone Göstergesi, Forex piyasasında Akıllı Para Kavramları (SMC) , ICT işlem modelleri ve likidite tabanlı stratejileri takip eden yatırımcılar için tasarlanmıştır. Bu araç, kurumsal hacmin sıklıkla büyük hareketlere yol açtığı kritik bir zaman olan 11:00 ile 14:00 GMT arasındaki New York Açık Killzone'u işaretler. Gösterge, seans aralıklarını , piyasa yapıcı aralıklarını , likidite taramalarını , FVG bölgelerini (Adil Değer Boşlukları) v

Turkish (Türkçe) Tanıtım
Swing Reversal Full History MT5 için geliştirilmiş bir indikatördür; geçmişteki tüm verilerde gerçek dönüş noktalarını tespit eder. Yeşil oklar dip (alış sinyali), kırmızı oklar tepe (satış sinyali) olarak gösterilir. Genel Bakış Tam geçmiş yeniden hesaplama : her tikte tüm mumları tekrar işler, repaint yok. Derinlik ayarı : swing’i belirlemek için her iki taraftan kaç mum kullanılacağını seçin. Non-repainting : oklar kapanmış mumlarda sabit kalır. Çoklu sembol & ç

Türkçe Smoothed Heiken Ashi by winwin – MetaTrader 5 için yeni nesil bir trend filtresi, piyasa gürültüsünü süzer ve net, uygulanabilir sinyaller sunar. Scalper’lar, swing trader’lar ve gerçek fiyat yönünü görmek isteyen herkes için ideal. Neler Yapar Çift EMA Yumuşatma Tek SmoothingPeriod Kontrolü Renk Kodlu Netlik Hafif ve Süper Hızlı Ekran Görüntüleri H4 Trend Taraması Giriş Onayı Çoklu Zaman Dilimi Tutarlılığı EURUSD, GBPUSD’de SHA gösterimi. Neden Bayılacaksınız Kendinden emin işle

Kerberos – Piyasanın Muhafızı
(Yunan mitolojisindeki efsanevi üç başlı köpekten ilham alınmıştır; sonsuz uyanıklığın, durdurulamaz gücün ve acımasız hassasiyetin simgesidir.) Konsept: Kerberos, nicelikten ziyade güvenlik ve kaliteyi ön planda tutan traderlar için tasarlanmış yüksek hassasiyetli, çok katmanlı bir trend takip göstergesidir.
Üç kanıtlanmış analiz yöntemini birleştirir ve yalnızca en iyi fırsatları filtreler — tam bir muhafız gibi, sadece doğru anda harekete geçer: EMA 50 ve EMA 20
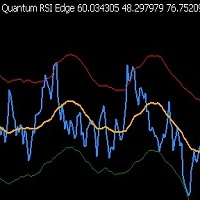
Quantum RSI Edge – Dinamik Volatilite Kanallı Akıllı RSI Göstergesi RSI, hareketli ortalamalar ve istatistiksel volatilite kanallarını birleştiren kesin sinyal sistemi. Avantajlar: Uyarlanabilir aşırı alım/satım seviyeleri – piyasa koşullarına otomatik ayar Yanlış sinyal filtreleme – standart sapma temelli dinamik kanallar Evrensel uyum – Forex, kripto, hisse senetleri ve tüm zaman dilimleri Net görselleştirme – renkli çizgilerle hızlı analiz ️ Parametreler: RsiPeriod (varsayılan
**** From REAL KNOWLEDGE TO WIN EVERYTHING TO TRADE****
CHoCH Power Indicator – Real-time BOS + Demand Detection
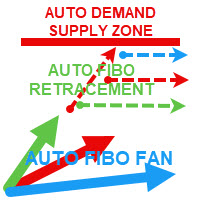
YOU CAN MAKE EASY GOLD TRADING IN TF M1 M5 AND SEE DEMAND SUPPLY ZONE IN M15+H1+FIBO RETRACMENT 61.8% IN TF M5+M15+H1 Togenter
USE with SMA420
price upper = BUY ONLY
price lowwer = Sell ONLY
SCM Multi Fibo include:
MULTI TIME FRAME
AUTO DETECT SWING HIGH AND SWING LOW AUTO DETECT BOS/CHOCH
FIBO RETRACEMENT M5 M15 H1 H4 DAY 0-38.2-50-61.8-78.6-88.7-100%
FIBO FAN M5 M15 H1

The Pranavtrxx ( Author ) Levels Indicator is a precision-based trading tool designed to identify key price levels in the market, helping traders make informed entry and exit decisions. This indicator automatically plots dynamic support and resistance zones derived from historical price action, psychological price levels, and recent market structure. Whether you're a day trader or swing trader, this tool offers real-time market level tracking that adjusts with price movement, helping you pinpoin

The SuperTrend Strategy is a widely-used technical indicator based on the Average True Range (ATR), primarily employed as a trailing stop tool to identify prevailing market trends. The indicator is designed for ease of use while providing reliable insights into the current market trend. It operates based on two key parameters: the period and the multiplier . By default, it uses a period of 15 for the ATR calculation and a multiplier of 3 . The Average True Range (ATR) plays a crucial role in th
FREE
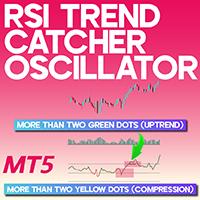
RSI Trend Catcher Oscillator for MetaTrader 5 The RSI Trend Catcher Oscillator for MetaTrader 5 offers a sophisticated enhancement to the classic Relative Strength Index (RSI), with added functionality to highlight trend shifts and represent movements using color-coded curves. When the oscillator remains above the 50% line, it typically signals an uptrend, while values below 50% indicate a prevailing downtrend. «Indicator Installation & User Guide» MT5 Indicator Installation | RSI Trend Catche
FREE
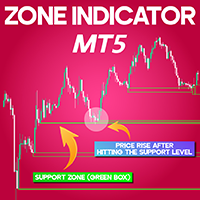
Zone Indicator for MetaTrader 5 The Zone Indicator for MetaTrader 5 serves as a dynamic support and resistance detection system, allowing traders to visually locate significant price boundaries with ease. Widely applicable across various technical strategies—especially in methods like Price Action—this tool highlights market zones that frequently act as turning points. On the chart, green rectangles denote support regions, while red ones indicate resistance, simplifying the tracking of price int
FREE

The Volatility Bands indicator or also known as "Concretum Bands" recreates the upper and lower bound of the Noise Area. The indicator helps you spot when price is making unusually large moves relative to recent “opening range” activity. It draws upper and lower bands around price, based on how much the market has moved in prior sessions. When price pushes beyond these bands—especially in combination with optional filters like an Exponential Moving Average (EMA) or Volume-Weighted Average Price
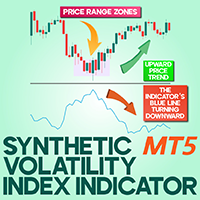
Synthetic Volatility Index Indicator for MetaTrader 5 The Synthetic Volatility Index Indicator for MetaTrader 5 serves as a technical tool tailored to assess market volatility levels. Rather than issuing straightforward buy or sell alerts, this indicator offers a contextual understanding of price behavior. A reading below the 1.00 threshold typically suggests bullish potential, while values rising above 0.00 are often interpreted as early signs of bearish momentum. «Indicator Installation & User
FREE
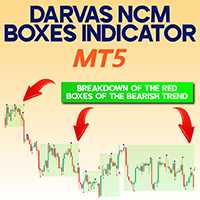
Darvas NCM Boxes Indicator for MetaTrader 5 The Darvas NCM Boxes Indicator for MetaTrader 5 is an advanced analytical tool designed to track significant price turning points by constructing visual range boxes around market highs and lows. By recognizing these pivot levels, the indicator outlines potential areas of interest, where price breakouts could trigger actionable trading opportunities. «Indicator Installation & User Guide» MT5 Indicator Installation | Darvas NCM Boxes Indicator MT4 | A
FREE
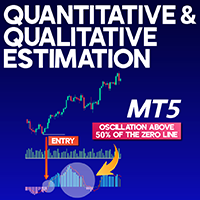
Quantitative and Qualitative Estimation (QQE) indicator MT5 The Quantitative and Qualitative Estimation (QQE) indicator MT5 is a powerful technical analysis tool built for the MetaTrader 5 platform. Derived from the Relative Strength Index (RSI), it applies advanced smoothing algorithms and operates in a separate sub-window below the price chart. This indicator merges both quantitative metrics and qualitative analysis to detect trends, generate signals, and identify divergence setups effectively
FREE
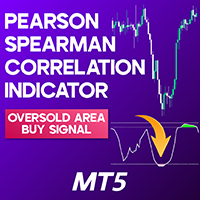
Pearson Spearman Correlation Indicator for MT5 The Pearson Spearman Correlation Indicator for MT5 is an analytical oscillator tailored for users of the MetaTrader 5 trading platform. It applies the Pearson Spearman rank-based correlation method to measure directional bias in the market. The tool produces dynamic oscillating lines that mark potential overbought and oversold areas with distinct color signals, helping traders anticipate price shifts more accurately. «Indicator Installation & User G
FREE

The Digital Buy/Sell Power Indicator is an advanced, visually intuitive tool that monitors buying and selling pressure across timeframes (M1 to Monthly), displaying momentum on a 0-100 scale with glowing digital readouts. Equipped with a movable panel, timeframe toggle switches, and a weighted algorithm for accurate Buy/Sell/Neutral signals, it provides traders with precise, actionable market dynamics. All time frames can be used at once to give a better perspective of market direction. Lowerin
FREE

MA Color Candles MA Color Candles is a technical indicator designed to visually display market trend direction by coloring actual chart candles. It does not draw additional objects — instead, it colors the standard candles directly based on the interaction between two moving averages. This approach makes chart reading simpler and cleaner, especially when visually evaluating the trend. The indicator is ideal for traders who prefer uncluttered charts and clear visual cues. How it works Bullish tre
FREE
Bu gösterge trendleri belirlemek, fiyat kanallarını tanımlamak ve işlem sinyalleri üretmek için uygundur. Pürüzsüzlük, uyarlanabilirlik ve görsel netliği bir araya getirerek scalping, günlük trading ve swing trading için kullanışlı hale getiriyor.
Teknik detaylar: Hull Hareketli Ortalaması (HMA) – Gecikmesiz, düzgün bir trend çizgisi sağlar.
Süper Pürüzsüz – "gürültüyü" azaltır ve pürüzsüz bir eğri oluşturur.
Kanal Genişliği – zaman dilimine uyum sağlar (örneğin, M1 için daha dar, D1 için da
FREE
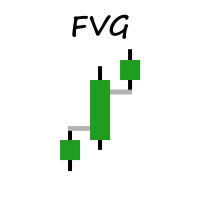
Welcome to MM Fair Value Gap Indicator.
Simple indicator that shows You FVG based on settings. The Fair Value Gap is a pattern made up of three candles: A Bullish Fair Value Gap forms on a second rising candle between the high of the first candle and the low of the third candle. A Bearish Fair Value Gap forms on a second declining candle between the low of the first candle and the high of the third candle
Indicator will be updated in future.
FREE
Indicador IMI (Intraday Momentum Index) Descrição O Indicador IMI (Intraday Momentum Index) é uma poderosa ferramenta de análise técnica desenvolvida para identificar a força do momentum e potenciais reversões no mercado. Este indicador quantifica a relação entre ganhos e perdas durante um período específico, ajudando traders a avaliar a dinâmica atual do mercado. Características Oscila entre 0 e 100, facilitando a interpretação das condições de mercado Identifica com precisão áreas de sobrecomp
FREE

Bu gösterge ne işe yarar? Şunlar gibi mum çubuğu desenlerini algılar:
Çekiç – olası bir yükselişi veya düşüşü gösterir.
Yutma – güçlü bir momentum sinyali.
Doji – Piyasa belirsizliği veya tersine dönme olasılığı.
Üç Beyaz Asker – Güçlü yükseliş trendi.
Üç Siyah Karga – Güçlü bir düşüş trendi.
Sabah Yıldızı – yükselişin başlangıcı.
Akşam Yıldızı – Sonbaharın başlangıcı.
Grafikte sinyaller gösteriliyor:
Bir desen algılandığında sesli, e-posta veya açılır bildirim gönderilebilir.
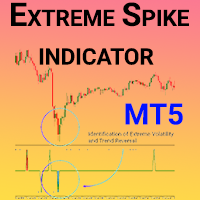
Extreme Spike indicator for MetaTrader 5 The Extreme Spike indicator for MetaTrader 5 applies ATR (Average True Range) analysis and advanced volatility filters to highlight sharp price movements and signal possible market reversals. On the MT5 platform, the indicator marks potential trend reversals to the downside with blue, and to the upside with red, equipping traders with timely alerts to manage risk and position themselves accordingly. «Indicator Installation & User Guide» MT5 Indicator Inst
FREE
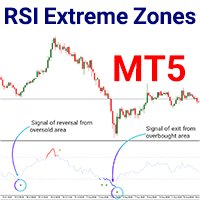
RSI Extreme Zones indicator for MetaTrader 5 The RSI Extreme Zones indicator for MetaTrader 5 (RSI EZ) is a modified version of the traditional Relative Strength Index, tailored to highlight high-probability turning points in the market. Operating on the MT5 platform, this indicator marks critical overbought (above 70) and oversold (below 30) thresholds. When price action exits these zones, the indicator generates buy or sell alerts, suggesting a potential trend change or correction. «Indicator
FREE

Daily Weekly Monthly High Low - Your Ultimate Tool for Precision Market Analysis Please leave a review if you like it and comment what new feature or EA or indicator you would like to have. :) Overview:
Elevate your trading strategy with Daily Weekly Monthly High Low , a sophisticated MQL5 indicator designed to pinpoint critical price levels across multiple timeframes. Seamlessly track daily, weekly, and monthly highs/lows to identify key support/resistance zones, optimize entries, and refin
FREE

Cosine-Self-Similarity: Identify Trends & Reversals
What is Cosine Similarity? Cosine similarity measures how alike two sequences are by looking at the angle between them. A value of +1 means they move perfectly together, -1 means they move perfectly opposite, and 0 means there's no directional relationship. This indicator applies this concept to price returns.
Is the market trending strongly, or is it choppy and reversing? Gain insight with the Cosine-Self-Similarity indicator!
This powerfu
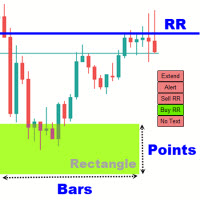
Rectangle Trading Custom is a powerful technical analysis tool designed for price action and range-based traders. It allows users to define consolidation zones and receive alerts when the price breaks out of these zones or approaches trendlines drawn on the chart. Rectangles and Trendlines will be extended into future with one click. Rectangle point size, name and prices will be displayed around rectangle. Key Features: Draw Trading Zones (Rectangle Zones)
Users can manually draw rectangles to
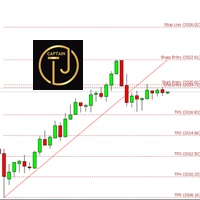
CTJMFiboSignal is The Power of Technical Analysis at Your Fingertips Embark on a seamless trading journey with CTJMFiboSignal , your go-to premium indicator for technical analysis mastery. Integrating advanced Fibonacci Retracement techniques with ZigZag patterns , this cutting-edge tool is designed to boost your confidence, adaptability, and accuracy in the ever-evolving world of market trading. Why CTJMFiboSignal Stands Out Supreme Accuracy:
Gain the upper hand in market analysis
Are you tired of those old, boring TP and SL lines cluttering your charts?
Struggling to showcase your trades in a way that actually grabs attention ?
Worry no more! Introducing the ultimate solution you’ve been waiting for... The TPSL Bounding Box PRO Indicator! PRO Version (With Risk to Rewards Ratio and more Modern Look Stats) With just a simple setup, you can transform your plain trading signals into clear , professional-looking boxes that everyone can understand at a gla
Buy/Sell Volume Indicator with Pair Divergence for MT5 version "1.1" Description The Enhanced Buy/Sell Volume Indicator is a custom technical indicator designed for MetaTrader 5 (MT5) to analyze and visualize buy and sell tick volumes in a separate window. It provides traders with insights into market dynamics by highlighting volume dominance, balance, and divergence patterns. The indicator uses tick volume data to estimate buying and selling pressure, offering a detailed view of market sentime

Advanced Analysis – Total Visual Clarity
The Ichimoku Dashboard features three powerful dashboards to deliver precise trading signals based on a proven methodology. The color-coded panel design allows users to instantly identify the status of each monitored financial instrument at a glance. The combined table of the "Ichimoku Dashboard" for MetaTrader 5 is a key component that integrates and synthesizes trading signals generated by the indicators, providing a clear and immediate overview to su

Push Notif for Mobile Trading: Detect Trend and Consolidation Overview Push Notif for Mobile Trading: Detect Trend and Consolidation is a custom MetaTrader 5 (MT5) indicator developed by Ritz_EANEHA that intelligently detects whether the market is in a trend (bullish/bearish) or in consolidation (sideways) . It uses a proprietary comparison of Standard Deviation (StdDev) and Average True Range (ATR) to assess volatility and market structure, and sends mobile push notifications to alert t
FREE

I s a powerful multi-timeframe indicator designed to automatically detect pivot highs/lows and draw trendlines on a selected higher timeframe (e.g., H4, D1). These structures are then displayed across all lower timeframes, giving traders a strategic view of market structure combined with touch signals and alerts for precise entry points.
Key Features: Automatic Trendline Detection Trendlines are drawn between significant swing highs and lows (pivots) detected on the selected timeframe. Li
FREE

Indicador ROC (Rate of Change) para MT5 Descrição O indicador ROC (Rate of Change) é uma ferramenta essencial para análise de momentum no mercado. Ele mede a variação percentual do preço em relação a um período anterior, fornecendo insights valiosos sobre a força e velocidade dos movimentos de preço. Esta versão personalizada para MetaTrader 5 oferece recursos avançados de visualização e alerta, com múltiplas opções de personalização para atender às suas necessidades específicas de trading. Cara
FREE

Decision Channel – Buy Low, Sell High with Confidence Smart Zones for Smarter Trades The Decision Channel indicator is your ultimate tool for spotting high-probability reversal zones. It draws an adaptive channel around price action to help you clearly see where to sell (top) and where to buy (bottom) . Perfect for traders who follow the “buy low, sell high” philosophy. When price hits the upper boundary , it often signals a potential sell . When price touches the lower boundary , it indicates a

Advanced Volume Profile Analysis Tool for MetaTrader 5 The Kecia Volume Profile Order Finder provides traders with volume profile analysis capabilities. This MT5 indicator combines volume profile visualization with statistical calculations to help identify potential trading opportunities and suggests entry, stop loss, and take profit levels based on market structure. Market Profile Visualization Transform your chart with customizable volume profile visualizations: Multiple visualization options

Have you ever asked yourself why your supply and demand zones fail , even when everything looks “perfect”? The truth is, you're not wrong — you're just watching the reaction, not the reason. It's not like those random currency strength meters that rely on lagging indicators like RSI, CCI, or similar tools mashed together to guess strength or weakness. That approach reacts to the past — not the cause. Pairs like EURUSD or USDJPY are just the outcomes . The real drivers? Currency indices an

Fair Value Channel (FVC) – Critical Price Discovery Signals (Metatrader 5) 1. Rejection at FVC High/Low (Reversal Signal) The Fair Value Channel’s high and low levels act as reversal zones when price aggressively rejects the ceiling (high) or floor (low). This rejection signals that stronger price discovery is NOT occurring —instead, the market is refusing to validate the move, often leading to sharp reversals. Long Bias Reversal: If price fails to hold above the FVC high and drops b

Push Notif for Mobile Trading ( Now you can trade perfectly through notifications to your Mobile Gadget, with Signals that you can adjust to your trading style, Use VPS to activate real time trading)
Description Push Notif for Mobile Trading is a custom MetaTrader 5 (MT5) indicator designed to send mobile push notifications to traders when certain price or indicator-based conditions are met. This allows traders to monitor markets remotely and act quickly, even when not at their trading term

The Kecia Market News Detector is a cutting-edge MT5 indicator designed to detect and quantify the impact of news events and market anomalies across multiple currency pairs in real-time. By leveraging 20+ advanced statistical metrics, this tool identifies abnormal market behavior, liquidity shifts, and volatility regimes often triggered by economic news, geopolitical events, or institutional order flow. Key Features: Multi-Symbol Dashboard : Monitor up to 30 currency pairs simultaneously in a

How the Max Trend Indicator Works This Max Trend indicator is designed to identify market trends and provide clear visual signals for trading decisions. Let me explain how it works: Core Components The indicator uses three main technical analysis tools to determine trend direction: Moving Average Crossovers : It compares a Fast EMA (default: 5 period) and a Slow EMA (default: 20 period) to identify trend direction. ADX (Average Directional Index) : It measures trend strength with a default peri
FREE
Descrizione Il Logarithmic Regression Channel - Trend è un indicatore avanzato progettato per analizzare la tendenza del prezzo attraverso una regressione logaritmica , utile in particolare su strumenti con crescita esponenziale o movimenti parabolici (come criptovalute, azioni tech o indici in trend marcato). Il canale si adatta dinamicamente al prezzo e mostra visivamente la direzione predominante del trend, grazie a: Linea centrale tratteggiata basata sulla regressione logaritmica Canali su
FREE

L'indicatore "Heikin Ashi" è stato progettato per migliorare l'analisi dei grafici finanziari con un sistema di candele Heikin Ashi. Le candele Heikin Ashi sono un metodo avanzato per visualizzare il prezzo, che aiuta a filtrare il rumore del mercato, rendendo più chiara l'interpretazione dei trend e migliorando la qualità delle decisioni di trading. Questo indicatore consente di visualizzare le candele Heikin Ashi al posto delle candele giapponesi tradizionali, rendendo l'analisi grafica più pu
FREE

The Live Percentage Profit/Loss Indicator for MetaTrader 5 (MT5) calculates the total floating profit or loss of all open trades as a percentage of the current account balance. It provides a simple visual reference directly on the chart. Features Real-Time Calculation – Computes floating PnL as a percentage of account balance based on all currently open trades. Chart Display – Shows the result in a label at the lower-right corner of the chart. Color-Coded Output – The label is green when in pro
FREE
MultiEMA Indicator Overview MultiEMA is a custom technical indicator that displays up to 5 different moving averages on the chart simultaneously. It provides traders with a comprehensive view of price trends across different timeframes, helping to identify potential trading opportunities and market trends. Features Displays 5 customizable moving averages (MA1-MA5) Supports multiple MA types: EMA, SMA, SMMA, and LWMA Individual visibility control for each MA Customizable line widths for better v
FREE
Engulfing with EMAs Indicator
Unlock the power of advanced candlestick pattern detection with the Engulfing with EMAs Indicator , a cutting-edge tool designed for MetaTrader 5. This futuristic indicator combines the precision of engulfing pattern analysis with the trend-following strength of Exponential Moving Averages (EMA 21 and EMA 50), empowering traders to identify high-probability setups across all currency pairs and timeframes. Key Features: Comprehensive Engulfing Detection : Detects b
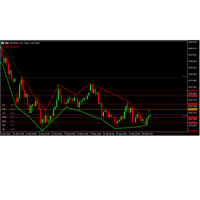
Advantages of the AutoTrendlinesMTF_WithRSI Indicator Multi-Timeframe Trendlines Automatically draws support/resistance trendlines on multiple timeframes (current, H1, H4). Adjustable lookback period ( LookbackBars ) and swing strength ( SwingStrength ) for customization. Daily Pivot Points Calculates and displays daily pivot levels (P, R1/S1, R2/S2, R3/S3) with customizable colors. Toggle visibility for each level individually. Auto Fibonacci Retracement Plots Fibonacci levels based on recent h

"Fire up your trading with Ak-47 Ultimate for MT5 — an elite SMA crossover indicator with real-time Buy/Sell signals, color-coded candles, and instant alerts. Lock onto trends and execute with military precision!" Colored candles (green for up, red for down), Two SMAs Buy/Sell arrows when crossovers happen, Text labels ("BUY"/"SELL") at the crossover points, Alerts triggered only once per signal .
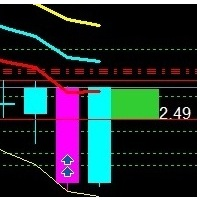
Break Even Zone – Real-Time Floating P/L Visual Indicator Quick Overview:
Break Even Zone is a powerful visual indicator that automatically highlights your floating profit or loss directly on the chart. It displays a red zone when your open trades are in floating loss , and a green zone when they are in floating profit – helping you make smarter, faster decisions. ️ Key Features: Red Zone Block appears when your trades are in floating loss Green Zone Block shows up when trades are in f
Overview:
TrendPro is a cutting‑edge indicator built on the crossover of three customizable Exponential Moving Averages (EMAs). Designed for all timeframes, it accurately identifies bullish and bearish momentum zones, and plots clear buy/sell arrows. With an integrated side‑market filter and optional pop‑up alerts, TrendPro helps you seize every opportunity without noise or false signals. Key Features: Precise Trend Detection Utilizes three EMAs (default periods: 34, 55, 89) to gauge market dir

KingTrend — Price Action Trend Analysis Tool KingTrend is a trend-following indicator based on long-standing price action principles involving Highs, Lows, Open, and Close. The logic behind this tool comes from concepts passed on to me by my mentor and translated into code for consistent structure recognition. Features: Identifies market structure using price action logic Detects trend direction and key turning points Marks Higher Highs, Lower Lows, and extensions Suitable for discretionary or

Liquidity Zones Finder The Liquidity Zones Finder is a powerful tool designed for MetaTrader 5 (MT5) to help traders identify key market levels for making trading decisions. It highlights liquidity zones (areas where price often reverses or breaks) and order blocks (significant supply/demand zones), providing visual cues, strength scores, and alerts to guide your trades. This guide is for traders (not programmers) and explains how to install, configure, and use the indicator effectively, includi

Smart Watermark Displays current symbol + timeframe Shows account name (or custom text) Customizable font/color/position One-Click Tools Timeframe Switcher: Quick-access buttons (M1 to D1) Drawing Tools: Create horizontal lines, trendlines, and Fibonacci retracements with consistent sizing Object Cleanup: "Delete" button removes all indicator-created drawings Pips Meter Real-time P/L tracking in pips Color-coded (green/red) for profit/loss Supports magic number filtering Chart Zoom Contro
FREE
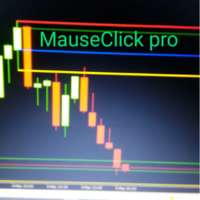
MauseClick Candle Pro – Marca velas importantes con un solo clic Precisión visual, líneas profesionales y persistencia total
¿Qué hace este indicador único?
Marca cualquier vela importante con un solo clic: Selecciona una vela y el indicador dibujará automáticamente sus zonas clave: Mecha de inicio Mecha de final Cuerpo de inicio Cuerpo de final
Marca múltiples velas a la vez: Analiza sin límites. Cada vela marcada se guarda individualmente.
Líneas profesionales y personaliza

Product Title: SuperTrend + Volume Confirmation Pro Product Description: Elevate your SuperTrend trading with the Volume Confirmation Pro indicator. This tool integrates sophisticated volume analysis directly into the SuperTrend framework, aiming to improve signal quality by assessing the strength and conviction behind trend movements. Go beyond simple price action and gain deeper insights into market dynamics. Overview: While the standard SuperTrend indicator offers clear trend direction, not

Overview Not all gaps are created equal — and this indicator knows it. The Fair Value Gap (FVG) Indicator goes beyond basic imbalance detection by filtering only high-probability gaps that align with market structure. Each FVG is validated by the next candle, confirming the prevailing trend before plotting — giving traders fewer false signals and more meaningful setups.
This is the perfect tool for traders who follow Smart Money Concepts (SMC) or ICT-style trading and want precision over clutte

The SuperTrend Advance Trading is a widely-used technical indicator based on SuperTrend Strategy + Price Action + EMA . How it works: - Buy/Sell Signals can be generated when the trend reverses, the conditions of Price action, TrendLine and EMA are met. - After the Signal appears, be patient and wait until the candle closes, at that time place the order as soon as possible. You may have time to review your entry, consider whether it is a good entry or not. - Carefully review the entry, up

DRAGON SCALE User Guide Indicator Visualization The DRAGON SCALE indicator displays several visual elements on the chart: Scale Zone – Displayed as purple areas (accumulation zones) and red areas (distribution zones) surrounding the pivot level. Lifebeat Signal – Appears as an arrow below the candle when the price enters a critical zone. The color of the arrow indicates the direction (green for bullish, red for bearish, yellow for neutral). Entry Countdown – Appears as an arrow above the cand

How to Use 1. Setting the Parameters Momentum Period : Adjust based on the characteristics of the trading pair. Use lower values (8–12) for volatile pairs, and higher values (14–20) for more stable pairs. Accumulation Period : Adjust based on the timeframe. Use lower values (3–5) for lower timeframes (M5–M30), and higher values (5–10) for higher timeframes (H1–D1). Energy Burst Threshold : Set according to your desired sensitivity. Lower values (50–60) provide more frequent signals; higher value

PULSAR ZONE MT5 Indicator Description PULSAR ZONE is a custom MT5 indicator designed for signal zoning based on volume pressure and trend direction. Ideal for scalping volatile pairs, it provides clear visual cues for both entry and exit points. Key Features Lifebeat Signal A visual signal triggered when a trend reversal occurs with significant volume pressure. Displayed as a green (bullish) or red (bearish) arrow, it highlights high-probability entry opportunities. Entry Countdown Once

Gold Euro Edge Indicator for MT5 The Gold Euro Edge Indicator is a versatile trading tool designed for both novice and experienced traders. It operates across various financial instruments, including: Major Forex Pairs Gold (XAU/USD) NASDAQ Deriv Volatility Pairs Weltrade Volatility Pairs Key Features Market Trend Identification :
Analyzes market conditions to determine prevailing trends. Buy/Sell Arrows :
Displays clear buy and sell arrows on charts. Mobile Notifications :
Sends real-time noti

## Signal Types
### Buy Signal - Appears when a bullish reversal pattern is detected - Green arrow appears below the candle - Candles turn green during signal duration - "BUY Signal" label appears with timestamp
### Sell Signal - Appears when a bearish reversal pattern is detected - Red arrow appears above the candle - Candles turn red during signal duration - "SELL Signal" label appears with timestamp
## Best Practices
1. **Timeframe Selection** - Works on all timeframes - Recommen

Boom and Crash Spike Detector v1.0 Boom and Crash spike detector prints Down non repaint Arrow for catching crash spikes and Up non repaint arrow for catching boom spikes. It is suitable for 1M time frame for majorly crash500 and Boom 500. When the Red arrow prints in a red zone moving averages, it indicates high probability of crash spikes downwards, likewise, blue arrow printing in a blue zone of moving average, it indicates high probability of boom spikes. Its pretty straight forward since
Crash500 Spike Detector v1.0 Crash500 spike detector prints Down non repaint Arrow for catching crash spikes. It is suitable for 1M time frame for majorly crash500 When the Red arrow prints, it indicates high probability of crash spikes downwards. Its pretty straight forward since I designed it to follow strong trends. Use default settings, however, you can change the color of your chart background as may be appropriate. The system uses mathematical approach in to display statistical data inf

SusGhos – WAP levels intersection indicator with visual signals, the indicator displays only arrows on the chart in those places where the WAP levels of the younger period intersect with the level of the older period. This helps to identify potential points of price movement direction change and use them to enter the market on a trend or at a reversal.
Visual signals in the form of arrows:
Green arrow up — intersection from bottom to top (bullish signal).
Red arrow down — intersection from t
FREE
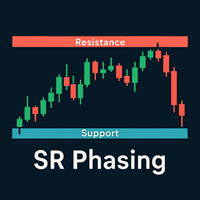
ATTENTION! This indicator is designed to be used in conjunction with the Fair Value Channel indicator, but can act as a complement to any strategy/system. Find the Fair Value Channel indicator on my product page.
Introducing the MetaTrader Support & Resistance Indicator – Precision Levels with Smart Range Measurement Unlock the power of high-probability support and resistance levels with our advanced MetaTrader indicator. Unlike traditional S&R tools, this indicator measures the opening
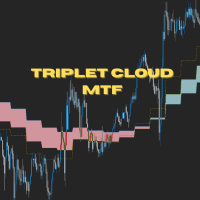
Triplet Cloud MTF is an indicator for trend-following strategy. It presents the trend in HTF from the LTF Chart that allows traders focus on looking for trade entry in the right direction and increase striking rate. It comes with simple input setup. You will only need to choose HTF you want to follow its trend and set the alert setup, then all is set. Here are the mostly selected HTF setup for each of entry timeframe: M1 Entry : M15 Trend M5 Entry : H1 Trend M15 Entry : H4 Trend H1 Entry
MetaTrader mağazası, geliştiricilerin alım-satım uygulamalarını satabilecekleri basit ve kullanışlı bir sitedir.
Ürününüzü yayınlamanıza yardımcı olacağız ve size Mağaza için ürününüzün açıklamasını nasıl hazırlayacağınızı anlatacağız. Mağazadaki tüm uygulamalar şifreleme korumalıdır ve yalnızca alıcının bilgisayarında çalıştırılabilir. İllegal kopyalama yapılamaz.
Alım-satım fırsatlarını kaçırıyorsunuz:
- Ücretsiz alım-satım uygulamaları
- İşlem kopyalama için 8.000'den fazla sinyal
- Finansal piyasaları keşfetmek için ekonomik haberler
Kayıt
Giriş yap
Gizlilik ve Veri Koruma Politikasını ve MQL5.com Kullanım Şartlarını kabul edersiniz
Hesabınız yoksa, lütfen kaydolun
MQL5.com web sitesine giriş yapmak için çerezlerin kullanımına izin vermelisiniz.
Lütfen tarayıcınızda gerekli ayarı etkinleştirin, aksi takdirde giriş yapamazsınız.