Смотри обучающее видео по маркету на YouTube
Как купить торгового робота или индикатор
Запусти робота на
виртуальном хостинге
виртуальном хостинге
Протестируй индикатор/робота перед покупкой
Хочешь зарабатывать в Маркете?
Как подать продукт, чтобы его покупали
Платные технические индикаторы для MetaTrader 5 - 30

PROMOTIONAL OFFER. NEXT PRICE WOULD BE 125 USD.
HAWA is pleased to introduce Price Action Setup indicator for all symbols with high success rate. It's advanced algorithm finds the spots for you where smart money is moving in or out of the market. Indicator will produce signals with pre-calculated entry and exit levels keeping money management in place. The system aims to achieve small, steady and consistent profits and reduce losses.
Unique Features: High Probability Success rate. Steady p

Plucking Machine I Plucking Machine I is a trend indicator designed specifically for gold and can also be used on any financial instrument. The indicator does not redraw and does not lag. Recommended time frame H1. The current setting is applicable for all time periods. It shows the current direction of the market based on price movements. Corresponding products of indicators: https://www.mql5.com/zh/market/product/61388?source=Site+Market+Product+Page#description

Данный индикатор вычисляет формулу MACD для объемо-ориентированных индикаторов Accumulation/Distribution и OnBalance Volumes . Помимо тиковых объемов он поддерживает расчеты со специальными псевдо-реальными объемами, эмулируемыми для символов Форекс, где реальные объемы не известны. Подробности о данных "суррогатных" объемах можно узнать в описании других индикаторов - TrueVolumeSurrogate и OnBalanceVolumeSurrogate (алгоритм последнего используется внутри MACDAD для подготовки значений AD и OBV

GIVE A LOOK TO MY OTHER PRODUCTS ! 100 % PER MONTH PROFIT---- MY NEW SIGNAL HERE -------> https://www.mql5.com/en/signals/2162238?source=Site+Signals+My# Double MA Cross Alert,is a cool indicator that notificate you directly on your telephone or email when 2 Moving average ( you choose the parameters ) crosses. This is very important when you want to know a change of trend and you can't stay in front of your pc! The indicator give you the alert just when the next bar opens ,so give you a more

Automatic Fibonacci Tool Fibonacci retracements is a popular instrument used by technical analysts to determine potential Support and Resistance areas. In technical analysis, this tool is created by taking two extreme points (usually a peak and a minimum) on the chart and dividing the vertical distance by the key Fibonacci coefficients equal to 23.6%, 38.2%, 50%, 61.8%, and 100%. Our Automatic Fibonacci Tool is programmed to make thigs easier. Using this tool, there is no need to explicitly set

Advanced Support and Resistance Support and resistance levels are widely used in trading. They are important as they show some key price levels. Before applying any strategy, one may consider it necessary to draw support and resistance. However, this process can take much time especially if one is to analyse a lot of currency pairs, commodities or indices. This Advanced Support and Resistance tool was designed for traders at any level, amateur to professional. It plots key support and resistance

**Инструмент для определения потенциальных точек разворота и направления тренда**
Этот инструмент отлично подходит для выявления возможных точек разворота и направления тренда на рынке. Он хорошо совместим с такими подтверждающими индикаторами, как MACD, Stochastic, RSI - стандартные индикаторы, доступные на всех платформах MT5. Вместе с ними он формирует надежную стратегию. В настройках можно регулировать расстояние и период канала.
Рекомендуется входить в сделку, когда сигнальная линия пе
Инструмент для торговли бинарными опционами Отличный и надежный помощник в достижении ваших целей, этот инструмент не требует дополнительных фильтров, поскольку уже обладает всем необходимым для успеха на рынке. Отображается в виде свечей под графиком, предоставляя четкие сигналы для торговли бинарными опционами. Основная особенность: Сигнал изменения цвета свечи: Сигналы генерируются на основе изменения цвета свечи при ее открытии. Время экспирации: Экспирация в 2 минут или 2 свечей, в зависим

The indicator measures the balance of aggression.
The formula is as follows: Aggression = Purchase Volume - Sales Volume.
Note : It is rec ommended to use the default configuration and VPS values. It does not work in Forex.
Meet Our Products
Parameters : Numbers of days prior to the current one for calculation; Volume Divider e; Enables calculation of the current candle; Histogram Line style and; Size; Line Line style and; Size;
Follow us on our website to check the next new
For those who are fans of Bill William's strategy, here it is the Trade Zone indicator filled with alerts and a better coloring system and EA ready (BUY & SELL buffers). And for those who don't know Bill Williams work, search Amazon for the title " Trading Chaos: Maximize Profits with Proven Technical Techniques ". This indicator internally uses the widely known Awesome Oscillator along with the Accelerator indicator, and when both are aligned it lights up the candles signaling a probable strong

нота: Рекомендуется использовать значения конфигурации и VPS по умолчанию. На Форексе не работает, так как использует флаги TICK_FLAG_BUY, TICK_FLAG_SELL и TICK_FLAG_LAST. Индикатор отображает объемы покупок и продаж на графике. Формируются две строки, соответствующие средним объемам покупки и продажи. Пересечение средних значений, увеличение их расстояния - хорошие индикаторы движения рынка. Параметры: Агрессия Количество дней до текущего для расчета; Разделитель объема e; Включает расчет текущ

根据高开低收价格确定反转点位,画出的极点折线。 The pole polyline is drawn according to the high opening and low closing price to determine the reversal point.
参数(Args):
1.周期数(Period)。参与界限计算的K柱数量。 2.界限(Divide)。计算方式包括: t1,顺高低价 (Buy min H,Sell max L) t2,逆高低价 (Buy min L,Sell max H) t3,收盘价 (Buy min C,Sell max C) t4,开盘价 (Buy min O,Sell max O) t5,高开低收价的一半 (HOLC/2) t6,高开低收价的一半+1 (HOLC/2+1) t7,高开低收价的一半+2 (HOLC/2+2) 3.跨越界限使用的价格(Price)。包括收盘价(C)和高低价(HL) 4.偏移(

Anchored VWAP (with no Volume) Уникальное развитие одного из самых полезных индикаторов VWAP. Данный продукт позволяет уйти от использования основы VWAP, а именно от объема. Все рассчитывается без него. Дополнительно разработана удобная система выбора точек старта - перемещая "стартовое поле", Вы указываете скрипту область, в которой следует искать экстремум, от которого будет начинаться расчет. Основные преимущества данной разработки: удобная система выбора точки старта расчета VWAP с помощью и

Upgraded - Stars added to indentify Areas you can scale in to compound on your entry when buying or selling version 2.4 Upgraded Notifications and alerts added version 2.3 *The indicator is suitable for all pairs fromm Deriv pairs (Vix,jump,boom & crash indices) , Currencies, cryptos , stocks(USA100, USA30 ), and metals like gold etc. How does it work?
Increasing the period make it more stable hence will only focus on important entry points However lowering the period will mean the indica

This indicator calculates Correlation among currency pairs (Selected by user) to find the least and/or most correlated symbols in real time. Correlation ranges from -100% to +100%, where -100% represents currencies moving in opposite directions (negative correlation) and +100% represents currencies moving in the same direction.
Note The Correlation more than 80 (Adjustable) between two currency pairs, Shows that they are quite similar in the kind of movement and side. The Correlation less than
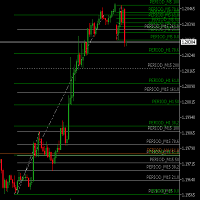
Sets and Updates Fibo-Retracemnet-Levels for Multi Timeframes. Helps to Find TradeZones combined over Multi-Timeframes. M1 M5 M15 H1 H4 D1 are analyzed and shown. Color Changes as soon 161 and 261 Retracements are reached to visualize possible Targets/ TakeProfit Zones . No Settings for Indicator available . Fibonacci retracements are set using a fixed Logic.

Profit Loss Meter For the serious trader this fun easy to use indicator allows you to measure Profit and Loss of current, closed or future trades on your forex account chart. It measures Currency Pairs And Indices plus estimates margin levels at the trade close point. The Profit/Loss indicator is based on MT5 native Crosshair instrument. TO ACTIVATED USE "HOT KEYS" ctrl+f just as you would for activating the Crosshair. left click and hold then drag in the direction in which you would like to m

Here I present you this awesome indicator I made. This is a nique combination witch puts you in the same level as MM's. So you can surf a lot of waves and identify the rally time, breakouts, and the perfect time to get in the market. ----
The SSL Channel is a great all-rounder based on 2 Simple Moving Averages, one of recent Highs, one of recent Lows. The calculation prints a channel on the chart consisting of 2 lines. This strategy gives a Long signal when price closes above the top of the
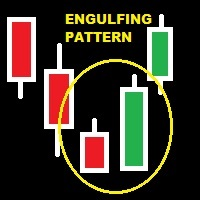
GIVE A LOOK TO MY OTHER PRODUCTS ! There are patterns that are more affidable then others.One of the most important is the engulfing pattern .It is very helpful to understand if there is a change of trend. This indicator find for you affidable engulfing patterns and send you an alert when a pattern is completely formed . To make this alert indicator more reliable,there is a parameter that you can change relative to the engulfing bar ( so the lost one closed before signal ). In fact you can cho
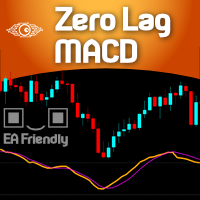
For those who are fans of the traditional MACD ( Moving Average Convergece/Divergence ) indicator, here it is a way faster indicator that could be very useful for intraday trading. Of course it could be used in higher timeframes, with the proper settings. Here at Minions Labs we always encourage traders to calibrate every single indicator you have to extract and distill every drop of good information it has for you. And this is the case with this speedy friend... This Zero Lag MACD could be used

Sinal com base no indicador RSI, que indica compra marcando com uma seta verde quando o preco sai da região de sobrevendido, e sinaliza venda quando o preco sai da regiao de sobrecomprado. A sinalizacão é feita com uma seta verde para compra e seta rosa para venda. Permite configurar o nível de sobrecompra e de sobrevenda, além do período do RSI. Funciona em qualquer período gráfico.

GIVE A LOOK TO MY OTHER PRODUCTS !
100 % PER MONTH PROFIT---- MY NEW SIGNAL HERE -------> https://www.mql5.com/en/signals/2162238?source=Site+Signals+My# Morning and evening star are 2 famous and reliable candlestick patterns, very helpful to understand an imminent change of trend. This indicator finds for you this patterns on your chart and send you an alert just when a pattern is 100 % formed. To make this indicator more reliable,y

This indicator provides an original mix of WPR, VSA, and volume delta. It shows ratio of buy/sell volumes scaled on 100% range based on total volume change for a selected period. The convetional VSA (Volume Spread Analysis) studies interconnections of price action and volume change in absolute values, whereas WPR (Williams Percent Range) offers a convenient approach of price moves normalization into the fixed percentage metric: 0 - 100%. Hence overbough and oversold states are easily spotted. N

TrendMeasurer indicator manual / TMi manual Индикатор создан для помощи пользователю в нахождении точки окончания сильного трендового ценового движения. Важно - ОКОНЧАНИЕ. Не старт. Принципы работы индикатора Первый импульс цены и его последующий откат формируют некую "критическую массу", которая выступает "топливом" для дальнейшего ценового движения. Выработка этого топлива говорит о потенциальном окончании тренда. В качестве топлива может выступать как объем, так и рассчитанный определенным об

TrendMeasurer indicator / TMi Индикатор создан для помощи пользователю в нахождении точки окончания сильного трендового ценового движения. Важно - ОКОНЧАНИЕ. Не старт. Принципы работы индикатора Первый импульс цены и его последующий откат формируют некую "критическую массу", которая выступает "топливом" для дальнейшего ценового движения. Выработка этого топлива говорит о потенциальном окончании тренда. В качестве топлива может выступать как объем, так и рассчитанный определенным образом из ценов
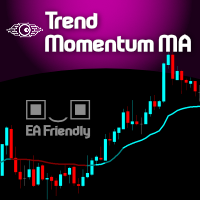
Imagine a simple and powerful line that gives you everything you need: Trend and Momentum . Welcome to the Trend Momentum Moving Average ! Visually it seems like a very simple Moving average, but in fact it is a VIDYA ( Variable/Volatility Index Dynamic Average ) type of moving average - originally created by Tushar Chande - and the main purpose of this special Moving Average is to understand and interpret the current volatility of the market and apply it as a smoothing factor for a traditional

Индикатор дельты служит для отображения разницы объема, который прошел на бирже по цене Ask и выше (рыночные покупки) и объема, который прошел по цене Bid и ниже (рыночные продажи). Данный индикатор показывает дельту каждой свечи на выбранном Вами таймфрейме. Данные выводятся в виде цветной гистограммы в отдельном окне индикатора. Индикатор рассчитывается из тиковой истории, поэтому для ускорения расчётов и уменьшения нагрузки на систему в параметрах задаётся количество баров для расчёта. Также

An effective indicator that highlights candles with increasing volumes, overshadowing those with shrinking volumes. Also suitable for Forex because it uses tick_volume.
You can set the colors to your liking. It will be easier to spot trends and possible reversals. The increasing volumes indicate the presence of large investors and therefore determine the reliability of the candle under observation

Торговая система разработана для работы с золотом на временных периодах: 30M, 1H. Индикатор позволяет подстраиваться под рыночную ситуацию.
Параметры для 1H : PERIOD=9F , FILTER=300 .
Параметры для 30M : PERIOD=22B , FILTER=450 .
Допускается небольшая подстройка под конкретного брокера .
При изменении количества отображаемой истории, также может потребоваться подстройка параметров.
Индикатор не перерисовывается .
В "Gold n XAU" используются разные правила для входа

Распределение Коши является классическим примером распределения с толстыми хвостами. Толстые хвосты указывают на то, что вероятность отклонения случайной величины от центральной тенденции очень велика. Так, для нормального распределения отклонение случайной величины от ее математического ожидания на 3 и более стандартных отклонений встречаются крайне редко (правило 3 сигм), а для распределения Коши отклонения от центра могут быть сколь угодно большими. Это свойство можно использовать для модели

Indicador en MQL5 que obtiene el promedio de 10 EMAS que son alineadas y procesadas según Fibonacci luego el promedio es suavizado" Se ingresa un número de 2 a N que multiplica los EMA-Fibonacci y por consiguiente aumenta los fibonacci, resultando un promedio. Se ingresa un número que suaviza los EMA-Fibonacci. Considerando los números 1/1 seria la suavización minima. Considerando los números 3/5 seria la suavización media. Considerando los números 10/30 seria la suavización alta.....etc
Daily Percentage Change (MetaTrader indicator) — calculates the change of currency rate related to the previous daily close and displays it in percentage points in the main chart window of the platform. Additionally, it can display the weekly and monthly percentage changes. Different colors can be set for positive or negative price increases. Also, a small customizable arrow helps to visualize the price change direction. If your broker uses an unconventional time zone, the indicator can use
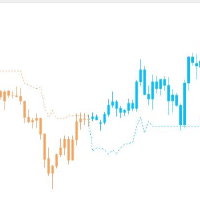
Stable trend index without clutter The index optimizes the moving average and removes the unstable clutter It can also be used in any other commodity It is best used in mainstream currencies such as EURUSD, USDJPY, GBPUSD and AUDUSD
The time period is 1 hour
I only know a little English, please forgive me if you don't understand I will always improve this indicator
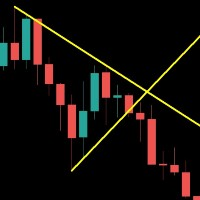
Save your time . Select area and the trend line will draw automatically . Draw a support and resistance line for the selected range with two mouse clicks . If you need to, you can also draw a line for support and resistance based on separate areas.
The resistance trend line is drawn based on the first and last highs inside the selected area; The support trend line is drawn based on first and last lows inside the selected area;

GIVE A LOOK TO MY OTHER PRODUCTS ! 100 % PER MONTH PROFIT---- MY NEW SIGNAL HERE -------> https://www.mql5.com/en/signals/2162238?source=Site+Signals+My#
The Parabolic SAR (PSAR) helps trader identifying direction of the stock movement and also provides them with the entry and exit. This indicator on the chart appears as a series of dots either above or below the price bars. When the Dots are below the price bar is then the price movement is considered to be bullish and when the Dots are a
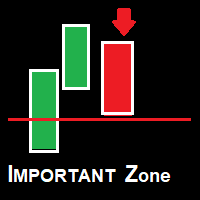
Zona Importante. O indicador Zona Importante é um indicador desenvolvido com todo meu conhecimento no mercado. o que voce podera esperar dele? o Indicador gerara alerta em toda e qualquer Reversao, seja uma reversao de fato ou um simples pullback ou seja a cada mudanca de direcao ocorrera um alerta. - Beneficios: - Nao deixara voce perder oportunidade.
O sell signal significa que uma nova onda de queda ocorrera. O buy signal significa que uma nova onda de alta ocorre
The Moving Average Convergence Divergence Indicator (MACD) is both a trend–seeking and momentum indicator which uses several exponential moving averages set to closing prices to generate trading signals. This Version brought to you the Stochastic confluence filtering the signals, this set ups amazing entries on índices and stock futures trading.
We added many types of alerts plus the Delay Cross Filter to aid in your search for better opportunities in the market.
Product Features Sound aler

Definition : TPO is a Time Price Opportunity. Instead of using bars or candles with an Open, High, Low, and Close price, each "bar" in a Market Profile is represented by horizontal bars against the price It is called Market Profile terminology.
In other words time-price-opportunity (TPO) profiles are histograms of how much time was spent at each price within the span of the profile.
By using a TPO chart, you are able to analyze the amount of trading activity, based on time, for each price leve

Добрый день. Сегодня представляем новый индикатор PointIntoChannelTOMSON https://youtu.be/dmgtVwX3nvg
https://youtu.be/Wr7N2WEY8lA - данный индикатор рассчитывается от канала на уровень отклонения цены в сторону покупки и продажи, зеленое и красное окно показателей соответственно. Чем больше уровень отклонения, тем больше вероятность разворота. Показания индикатора пересчитываются с каждым новым баром и рекомендуется использовать его лишь как вспомогательный Контакты для связи 777basil

Добрый день. UturnAnalysis - для проверки работы качества индикатора ЗАПУСТИЛИ ТРИАЛ ВЕРСИЮ бесплатная рассылка сигналов о разворотах на основе этого индикатора по срочному и фондовому рынку ММВБ напишите в техподдержку, мне 777basil@mail.ru , или в комментариях свой адрес электронной почты и мы пришлем вам данные аккаунта, куда приходят оповещения, бесплатно.
https://youtu.be/q228LvLec-Y
ставим сразу на несколько инструментов https://youtu.be/Wr7N2WEY8lA сэкономит ваше время у монит
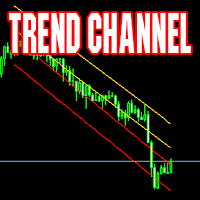
Индикатор каналов. Рассчитывается динамически. Подходит как для работы в направлении тренда, так и внутрь канала. Отличные результаты при работе на таймфреймах от 4Н по направлению в центр канала. Support: https://www.mql5.com/en/channels/TrendHunter Пример использования: при касании цены одной из крайних линий - открытие сделки в центр канала с тейк-профитом на ближайшей средней линии индикатора. Версия для МT4 Индикатор можно использовать в советниках (4 буфера), получая данные стандартным с
Индикатор определяет самую важную составляющую любой торговой системы - возможную точку выхода из сделки.
По мере движения цены, в зависимости от рыночной ситуации, индикатор строит цели.
Цель становится актуальной, когда цена начинает движение в сторону цели.
Если движение сильное, то для его остановки или разворота может потребоваться некоторое количество целей. Скопление целей наиболее вероятно способно остановить цену.
Некоторые цели исполняются по нескольку раз.
Но графи

Индикатор строит динамические уровни POC, VAH и VAL за указанный период из тиковых данных. POC - Point Of Control, цена, по которой накопился максимальный объем за определенный период времени (POC в профиле объема). VA - Volume Area, зона справедливой стоимости актива. VAH - Volume Area High. VAL - Volume Area Low. Индикатор DBS_DynamicLevels строит динамические уровни, где точкой расчета является максимальный уровень объема (POC) и зона VAH/VAL. Индикатор показывает историю положения максималь

Coiote Book Balance é um indicador que monitora o livro de ofertas e indica de maneira simplificada o níveis de renovação de ordens agrupados no timeframe gáfico, mostrando quanto o maior lado renovou e a diferença dessas renovações. Além disso, é possível visualizar em quais preços estão as maiores ordens da cada lado, o preço teórico dessa liquidez e a quantidade de lotes em tempo real. Para correto funcionamento do indicador é preciso que o livro de ofertas seja aberto antes da inclusão do in
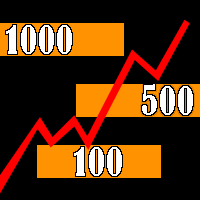
Индикатор строит "психологические уровни": уровни круглых чисел и промежуточные уровни круглых чисел.
Круглые числа играют важную роль в формировании уровней поддержки и сопротивления. Существует закономерность, при которой спад или рост цены может остановится на круглых числах.
Уровень, цена которого заканчивается на 0, является уровнем круглого числа первого порядка.
Промежуточный уровень, это уровень между двумя круглыми уровнями, например, между 10 и 20 это уровень 15.

This easy to setup indicator shows you the market volumes in a different way, with support and resistance as showed. You can setup: - Backdays volume to show - Heiken Ashi candle view It works for every kind of graph and every kind of period. The program shows the volumes based on the number of candles displayed in the chart: the more candles the more volumes. Enjoy this very useful indicator.
Please feel free to message me to report any kind of improvements! :D

The Better Volume indictator improves the comprehension on volume by coloring the classical histogram bars . The colors point out differents nature of volume .
The Better Volume OnOff allows to open/close the subwindow through a botton or using the keyboard only. There is the possibility to customize 3 symbols and assign them different parameters for each time frame .
The indicator improves the comprehension on volume by coloring the classical histogram bars : CLIMAX UP -

Индикатор Trading Strategy призван помочь трейдерам в поиске оптимальных входов в сделку и выходов из неё. В его основе лежат показания технических индикаторов (MA, RSI, ATR и др.), а также авторский алгоритм, связывающий их сигналы в единое целое. Индикатор даёт сигналы на покупку и продажу в виде стрелочек: стрелочка вверх — сигнал на покупку, вниз — на продажу. В правом верхнем углу показаны сигналы индикатора на 6 таймфреймах (M1, M5, M15, M30, H1, H4) данной валютной пары. Индикатор свои з

" Торговый диапазон возникает, когда финансовый инструмент торгуется между постоянными высокими и низкими ценами в течение определенного периода времени. Верхняя часть торгового диапазона финансового инструмента часто обеспечивает ценовое сопротивление, в то время как нижняя часть торгового диапазона обычно предлагает ценовую поддержку. Трейдеры могут входить в направлении прорыва или пробоя из торгового диапазона... "
Это понимание диапазонов "Классической теории". У нас разное понимание пр

Индикатор RSI MT5 - это индикатор Metatrader 5, и суть этого технического индикатора заключается в преобразовании накопленных исторических данных на основе индикатора RSI. Сигналы показаны разными цветами свечей. Смотрите настройки, тестируёте. Это очень полезный индикатор и он точно должен быть у вас . The RSI in candlelight MT5 indicator is a Metatrader 5 indicator, and the essence of this technical indicator is to transform the accumulated historical data based on the RSI indicator. Signals a

Описание индикатора будет крайне коротким. Индикатор Коридор тренда показывает трейдерам зону в которой находится валюта и даёт понимание по какому тренду движется рынок. Визуально очень хорошо воспринимается. Уровни взяты и просчитаны не просто. Полезный индикатор для арсенала индикаторов трейдера. The description of the indicator will be extremely short. The Trend Corridor indicator shows traders the zone in which the currency is located and gives an understanding of which trend the market is

"Профиль объема" - это расширенный индикатор, отображающий общий объем торгов на каждом ценовом уровне за указанный пользователем период времени. Основными составляющими профиля объемов являются POC ( Point Of Control - уровень цены, при котором за выбранный период было исполнено максимальное количество контрактов), VAH ( Value Area High - самая высокая цена в области Value Area) и VAL ( Value Area Low - самая низкая цена в Value Area).
Когда мы остановились на исходном индикаторе, мы долго с

This MT5 indicator, Bull Bear Visual MTF (21 Time Frames), summarize the strength color graphic and percentages of power for both Bull and Bear in current market emotion stage which will show you in multi time frames and sum of the total Bull and Bear power strength which is an important information for traders especially you can see all Bull and Bear power in visualized graphic easily, Hope it will be helpful tool for you for making a good decision in trading.
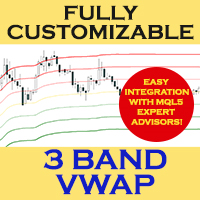
3-BAND VWAP (Volume Weighted Average Price)
Fully customized and EA-friendly VWAP Bands Indicator
MAIN FEATURES:
Choose the period of the VWAP calculation reset (Daily, Weekly or Monthly): For day trading use the Daily VWAP, and for longer term analysis use the Weekly or Monthly calculations.
Fine adjustment of the deviation of the bands: Find the best band’s deviation for the instruments you trade and adjust accordingly.
Customize line colors, style and width according to you

ADX is one of the most versatile indicators, understanding it can help you understand the true nature of movements. It is often used within automatic experts to filter input signals. Unfortunately in its original form it is not immediately understandable. This version aims to simplify its reading by transferring the burden of interpreting its values to the code. The result is a clear graph where it is easy to identify the accumulation and distribution phases, trend phases and excesses. The color

This MT5 indicator, Bull Bear Visual MTF V2, summarize the strength color graphic and percentages of power for both Bull and Bear in current market emotion stage which will show you in multi timeframes (21) and sum of the total Bull and Bear power strength which is an important information for traders especially you can see all Bull and Bear power in visualized graphic easily, Hope it will be helpful tool for you for making a good decision in trading.

https://www.mql4.com Индикаторы тенденций цен отражают изменение рыночных цен точно так же, как и будущие тенденции рыночных цен. Этот показатель не перекрашен, не запоздалый. Рекомендуется время не меньше, чем H1. Когда рыночные цены находятся в светло-зеленом диапазоне, рынки растут, а когда рыночные цены находятся в светло-зеленом диапазоне, рынки падают. Рекомендую использовать параметры по умолчанию.
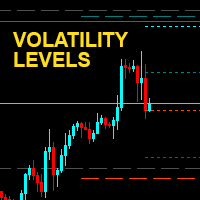
Transfer volatility levels to the chart to understand the nature of the ongoing movements. The levels are calculated based on the volatility recorded in the last few sessions. Easily identify possible targets or swing points for intraday , daily and weekly trading. In addition, the round price levels considered most important are also visible, here the highest trading volumes are usually concentrated. NO REPAINT

MCDX is an indicator based on specific formula to detect Buy and Sell momentum Red Bar means Price go up and Buy momentum. Green Bar means Price go down and Sell momentum" Height of RED bar > 50% means Bull is in control. i.e. RED more than GREEN to go buy. Lower of Green bar < 50% means Bear is in control. i.e. GREEN more than RED to go sell. DARKER RED COLOR - STRONG Up Trend or Strong Bullish Power
LIGHTER RED COLOR - WEAK Up Trend or Weak Bullish Power
LIGHTER GREEN COLOR - STRONG Down

Description: TrendAccess can optimize your trading time by showing you the trend via two different calculation modes quick and easy.
No more searching for Trends. Just open the chart and look at the trend display.
Features: Shows Uptrend, Downtrend and "No Trend" indicator
Shows the calculated ZigZag Profile
Works on all timeframes Two different calculation Modes (MACD and Candle-based calculation)
Settings: Variable
Standard Value Description
Calculation Mode
Candle based
C

Pivot Point Multi Method MT5 Pivot Point Multi Method MT5 is a fully automatic pivot point indicator and indicate support and resistances (S1,S2,S3,S4,R1,R2,R3,R4) based on four Methods that you can select on of them Pivot point detection and drawing support resistances Methods( Classic ,Camarilla ,Woodie ,Fibonacci)
Pivot Point Multi Method Mt5 is working on all time frames and all currency pairs and gold silver and crypto currencies .
Recommended Setting : Pivot_Method select one of

Этот многосимвольный индикатор приборной панели может отправлять оповещения при обнаружении сильного тренда. Это можно сделать, создав информационную панель с использованием следующих индикаторов/осцилляторов (далее упоминаемых только как индикаторы): RSI, Stochastics, ADX, CCI, MACD, WPR (процентный диапазон Вильямса, также называемый Williams %R), ROC (ценовой диапазон). скорость изменения) и осциллятор Ultimate. Его можно использовать со всеми таймфреймами от M1 до MN (он может показывать тол

Индикатор Supply Demand RSJ PRO рассчитывает и строит на графике зоны «Предложение» и «Спрос», определяя тип Зоны (Слабая, Сильная, Проверенная, Проверенная) и в случае повторных проверок Зоны показывает, сколько раз она был повторно протестирован. Зоны "предложения" - это ценовые зоны, в которых предложение превышает спрос, что приводит к снижению цен. Зоны «спроса» - это ценовые зоны, в которых наблюдается больший спрос, чем предложение, что приводит к росту цен.
Обязательно попробуйте нашу

Точки входа Our Trend нужно использовать как точки потенциального разворота рынка. Индикатор работает используя функцию циклично-волновой зависимости. Таким образом, все точки входа будут оптимальными точками, в которых изменяется движение.
Самым простым вариантом использования индикатора является открытие сделки в сторону существующего тренда. Наилучший результат дает сочетание индикатора с фундаментальными новостями, он может выступать в качестве фильтра новостей, то есть показывать наско

Индикатор Checkpoints реализует усовершенствованный алгоритм для визуализации рыночного тренда. сновное применение индикатора заключается в генерации сигналов на покупку и продажу.
Определение рыночного тренда является важной задачей трейдеров. Наверное, почти каждый трейдер хоть раз, но мечтал про незапаздывающие МА. Я воплотил эту мечту в своем индикаторе. При помощи этого индикатора можно прогнозировать будущие значения.
Индикатор предназначен для определения либо тренда, либо краткоср

Индикатор Interesting Thing визуально разгружает ценовой график и экономит время анализа: нет сигнала – нет сделки, если появился обратный сигнал, то текущую сделку стоит закрыть. Это стрелочный индикатор для определения тренда.
Индикатор реализует стратегию для торговли по тренду, фильтрация и все необходимые функции, встроенные в один инструмент! Принцип работы индикатор заключается в том, чтобы при размещении на график автоматически определять текущее состояние рынка, анализировать истори

Индикатор Trend Complete является сигнальным и обладает интересными свойствами. Нужно принять во внимание что данный индикатор отражает экстремумы и его следует использовать как дополнительный, а для точки входа использовать другой инструмент. Ищет и отображает на графике цены точки разворота. Индикаторы тренда являются одним из основных инструментов анализа тенденций на валютном рынке Форекс. Индикатор умеет передать все виды сигналов пользователю: сообщения, E-mail и Push!
Целью, которая
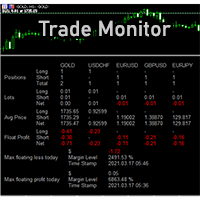
DSProFx Trade Monitor (iExposure) gives you detail information of all trades in your account including total positions, lot size, average price level (Breakeven Level), floating profit, and today's maximum profit/loss. The display is simple. Each data will be separated for every symbol/chart. This indicator will help you monitoring your trades especially if you are working with multiple symbols/charts and open many orders. Just attach DSProFx Trade Monitor in one chart, and it will show all deta
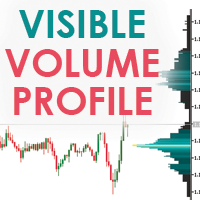
Visible Market Profile graphically represents the amount of trades made on each price level. This indicator in particular, unlike the daily market profile , is calculated on the visible area of the chart.
Visible Market Profile cannot be considered an indicator of operational signals, but it can be a good support for reading the market, in addition to what is already used by every trader in his work process. The Visible Market Profile is able to determine with a good approximation the pric

Fundamental Signals Indicator is a Non-Repaint Indicator with a powerful calculation engine that can predict market movement over 3000 pips (30000 points). The indicator does not analyze the market fundamentally, it is named fundamental because it can predict trends with large movements, no complicated inputs and low risk. Also Indicator can alert on market trend changes.
Using Indicator :
The Indicator is very simple and without complicated input parameters. (No need to optimize anythin
А знаете ли вы, почему MetaTrader Market - лучшее место для продажи торговых стратегий и технических индикаторов? Разработчику у нас не нужно тратить время и силы на рекламу, защиту программ и расчеты с покупателями. Всё это уже сделано.
Вы упускаете торговые возможности:
- Бесплатные приложения для трейдинга
- 8 000+ сигналов для копирования
- Экономические новости для анализа финансовых рынков
Регистрация
Вход
Если у вас нет учетной записи, зарегистрируйтесь
Для авторизации и пользования сайтом MQL5.com необходимо разрешить использование файлов Сookie.
Пожалуйста, включите в вашем браузере данную настройку, иначе вы не сможете авторизоваться.