Смотри обучающее видео по маркету на YouTube
Как купить торгового робота или индикатор
Запусти робота на
виртуальном хостинге
виртуальном хостинге
Протестируй индикатор/робота перед покупкой
Хочешь зарабатывать в Маркете?
Как подать продукт, чтобы его покупали
Платные технические индикаторы для MetaTrader 5 - 43
Impulse Creative – более совершенный индикатор импульсов для принятия решений (в сравнении с индикатором Impulse Change). Основная задача данного индикатора предупредить трейдера о моменте изменения цен а также дать команду на вход по текущему тренду. Для определения тренда используйте любой другой инструмент, данная разработка формирует только точку для входа но не направление входа.
Сначала посмотрите на скриншоты и обратите внимание что мы видем явно выраженные фигуры, которые формирует инд
CalcFlat – индикатор флета.
На первый взгляд простой индикатор но если присмотреться к скриншотам людям которые не являются специалистами, то может показаться, что индикатор мало информативный. Но на самом деле и индикатор очень информационно активен. Его нужно подстраивать под каждый инструмент и каждый таймфрейм. Очень гибок в настройках есть два ключевых параметра настройки, но они могут существенно изменить результаты отображения индикатора. Индикатор помимо основной гистограммы имеет два
CalcFlat Creative – индикатор флета.
Это более продвинутая версия индикатора CalcFlat. Для данного индикатора добавлены три линии, которые существенно улучшают работу индикатора предшественника. Помимо двух существующих уровней на которые реагировал пользователь и которые были статическими, теперь индикатор имеет три динамических линии сверху основной гитограммы и интерпретируемыми как: сигнальная линия базовая, сигнальная минимальная, сигнальная максимальная.
Эти линии формируются благодаря

In the Apple – стабильный индикатор точек выхода, ни один сигнал не изменится и не перерисуется.
Индикатор отображает сигналы на покупку и сигналы продаж с рекомендованными маркерами для выхода из позиции. Каждый маркер выхода сопровождается информационной отметкой о профите от операции. Метка состоит из двух частей. Первая отображает профит от последней операции в пунктах инструмента, а вторая метка отображает общий баланс. Общий баланc начинает просчитываться с момента когда начался просчет

УРОВНИ (экстремумы, стопы, тейкпрофиты)
Индикатор визуализирует уровни недавних экстремумов цены. Поиск таковых значений осуществляется посредством внутреннего алгоритма. Не перерисовывается. Используется для смены уровней размещения стоп-приказов (делается пользователем вручную, индикатор только визуализирует уровень). Также можно использовать для взятия частичной прибыли на противоположных движению уровнях. Индикатор позволит брать бОльшую часть сильных движений. Можно не опасаться преждеврем
TRACKINGLEVELS (SUPPORTS AND RESISTANCES)
TrackingLevels is a useful indicator that saves considerable time when a trader starts analyzing a chart. This indicator draw on the chart all the resistances and supports that the market is creating. The resistance and support levels are very important, this levels define areas where there can be a considerable accumulation of sell or buy orders. These are a key areas that every trader must know and keep in mind all the time. This indicator helps the t

With Renko Plus you can use the features in the Indicator functionality, just add it to the Metatrader5 chart.
The Renko chart is a type of chart, developed by the Japanese, that is constructed using price movement rather than standardized prices and time intervals like most charts. It is believed to be named after the Japanese word for bricks, "renga", as the graphic looks like a series of bricks.
A new brick is created when the price moves a specified pri

AlgoKing Chandelier Exit Indicator (MT5)
The Chandelier Exit Indicator is a volatility based indicator that maximizes returns using the Average True Range (ATR) value and the highest high or lowest low of a period. Benefits Should be used as a trailing stop. Helps you exit a position when you have a respectable profit. Identifies a high probability of a trend reversal when the price moves against the prevailing trend by a distance equal to 3x the average volatility. Join the AlgoKing Lightning

Shift Trend – это индикатор формирования сигналов на вход, точек входа. Индикатор необходимо отбирать для работы на достаточно короткий срок. Но кто работает в коротких диапазонах, то данный индикатор хорошо подойдет.
Параметры: Length1 - Первый параметр. Length2 - Второй параметр; PointActivity - Параметр управляющий пиковыми уровнями. PointMinDist - Параметр задающий минимальную дистанцию. AvgLengthBar - Усреднение боров.
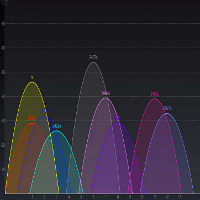
Change Analyzer - Индикатор можно назвать индикатором баланса рынка. Поскольку индикатор на линии нуля тогда рынок сбалансирован в определенном таймфрейме и определенном инструменте.
На основе двух виртуальных окон и их взаимного размещения строится данный график. В результате его работы происходит нормализация ценового графика относительно нулевой линии, что помогает делать выводы о поведении цены. Индикатор чем-то напоминает систему перекупленности и перепроданности, но алгоритм совсем друго
For Nasdaq trading, the most important principle is to know the trend of the fund.
This indicator with 6 green and red lights provides you with the daily path of this important indicator.
This indicator has been tested for 6 months and has a win rate of over 85%.
Be sure to contact me before purchasing to get the necessary instructions on how to use and set up this indicator.
You should use a broker that has dollar index, vix, and commodities. MT4 Version
You can contact us via Instagram, Teleg
Acceleration Force Meter Indicator - is a trend system that join market in trend phase and after trend pull-back. AFM indicator - is the system that watchs market phases from flat to extreme volatility and prefers to enter in market when it's active, more volatility, ignoring most flat places. This is 100% complete trading system including enter and exit points. It works well with profitable trades - maximizing take profit targets(analysis of recent market volatility, its pips range to adapt cur

Volality Index scalper indicator Meant for Volality pairs such as Volality 10, 25, 50, 75 and 100 The indicator works on all timeframes from the 1 minute to the monthly timeframe the indicator is non repaint the indicator has 3 entry settings 1 color change on zero cross 2 color change on slope change 3 color change on signal line cross Orange line is your sell signal Blue line is your buy signal.

UR TrendИсчерпание
UR TrendExhaustion - лучшее решение для трейдеров, которые не хотят иметь дело ни со значениями параметров, ни с другими настройками - оно простое и визуально понятное для всех.
Преимущества использования UR TrendExhaustion:
Нет параметров У вас есть 3 линии, которые лучше всего описывают то, что происходит на графике: линия истощения тренда, линия китовых денег и линия розничных денег. Интерфейс демонстрирует исчерпание любой линии на обоих крайних значениях (красные об

Diagnosis of major and minor pivot
Trend detection
with many signals
Can be used in all symbols
Can be used in all time frames
Settings:
Back Show: The number of candles it displays
If you need any adjustments, or have any questions or suggestions, message me
How to trade:
Blue: sell signal
Red: buy signal
Blue and red at the same time: no signal
Exit signal: Opposite signal

UR максимумы и минимумы
UR Highs&Lows проводит глубокий анализ движения цены и ее волатильности и создает канал, внутри которого движется цена. Этот канал теперь движется как осциллятор и на него накладывается отклонение цены, чтобы сигнализировать о потенциальном истощении и возможных разворотах.
Преимущества использования UR Highs&Lows:
Нет параметров У вас есть 3 линии, которые описывают движение цены: белая линия, которая является средней ценой, и синие линии, которые являются ее экстр

Trading Direction – индикатор, который никогда не пойдет против длительного тренда стабильные точны и без малейшой перерисовки. Индикатор проходит всю историю! Вы можете найти настройки для любого инструмента для чего есть бесплатная утилита TDO .
Правила торговли. Когда появился сигнал (всегда по цене открытия бара) сразу закрываем противоположную позицию, если она есть, несмотря на факт просадки или в профита. И открываем новую позицию вслед за стрелкой в ??нужном направлении. И этих правил

Golden section price action indicator - is a trend-scalping complete system with enter and exit points. Indicator is based on most powerfull price action japan patterns that are filtered by volume, volatility, market phase. Pattern is not a simple combinations of candles. Patterns must have "weight" to move market in right direction. "Weight" - is the summary of pattern's volume, the size of pattern candles according to last average volatility and ofcourse pattern must appear in correct market p
Multi-Timeframe Chart Overlay Indicator
The Timeframe Overlay indicator displays price action for multiple timeframes on a single chart, allowing you to quickly assess different timeframes from a single chart. The advantage is to observe and follow the correlations of price movements in real time to help you find potential trades at a glance.
---- Symbol 1 ----
Symbol = EURUSD
Correlation Inverse = false
Display = true
Ratio

Индикатор Recuroid показывает очень хорошие точки входа. Просто посмотрите на скриншоты, после чего скачайте бесплатную версию и посмотрите в тестере стратегий и вы сами убедитесь.
Работает система на основе двух ключевых алгоритмов. Первый алгоритм (управляемый) создает систему сбалансированного перехода из зоны покупки в зону продажы и наоборот, рисует стрелки и линии, формирует входы. Второй алгоритм (управляющий) корректирует исходные данные для первого алгоритма (управляемого) за счет и
Divergence is one best ways to trade the financial market as it is a leading indicator of price action that detect high probability reversal and continuation setups. The AlgoKing Divergence Detector is an RSI and Stochastics Indicator with Divergence Detection. Features Hidden Divergence for trend continuation. Standard or Normal Divergence for trend reversal. Screen Alerts. MetaQuotes Notifications. Email Notifications. RSI Indicator built in. Stochastics Indicator built in. Types of Divergen

Flag Pattern pro is a Price Action (PA) analytical tool that scans the continuation patterns known as "Flag and Pennant Patterns" .
Flag and Pennant patterns are continuation patterns characterized by a move in a previous trend direction after a shallow retracement usually below 50% of the original move . Deep retracements can however be sometimes found at the 61.8 % levels. The original move is know as the flag pole and the retracement is called the flag.
Indicator Fundam

This indicator provides several drawing tools to assist in various methods of chart analysis.
The drawings will keep their proportions (according to their handle trendline) across different chart scales, update in real time, and multiple drawings are supported.
#
Drawing Option
Description
1 Grid box draggable boxed grid, user defines rows x colums, diagonal ray option 2 Grid partial or fullscreen grid, sized by handle line 3 Grid flex a diagonal grid, sized and sloped by handle line
4 Cyc

Данный индикатор создан для тех людей, которые хотят торговать и зарабатывать на любых инструментах и таймфреймах .Индикатор выдает очень хорошие точки,для входа в рынок,торговать очень просто,стрелки покажут,когда надо открывать сделки,установил и торгуй не о чем не думая,стоп-лосс и тейк-профит,устанавливайте каждый сам,все зависит от вашего стиля торговли,кто то скальпирует а кто то держит сделки по несколько дней..В тестере стратегий индикатор,просто физически не может,показать точные резуль

Это индикатор тенденций, который отражает тысячи изменений в ценах на рынке с помощью реалистичной, красной и зеленой линии, которая указывает на то, что изменение цвета реальной линии предвещает, что рынок изменился, скорее всего, и может измениться! Зелёная линия указывает на то, что рыночные цены растут, а красная — на то, что рыночные цены падают. Для того чтобы вы могли лучше использовать этот показатель, рекомендуется загрузить бесплатно демо-версию этого показателя, прежде чем его поку

Из всех задач, которые стоят перед трейдером при входе на рынок, основной задачей является определить направление тренда. С этой задачей вам поможет справится индикатор Artificial Power. Какую бы цель не ставил перед собой трейдер, инструментом для ее достижения будут в основном трендовые индикаторы.
Индикатор Artificial Power без запаздывания и перерисовки, применяется трейдерами в трендовых стратегиях в торговле на финансовых рынках (Форекс, CFD, бинарные опционы). Этот индикатор создан для

Gann 9+ Indicator Introduction The "Gann Matrix Chart" is the most simple and clear technical analysis in Gann theory, which is the calculation tool that Gann has always been committed to using. It is the essence of Gann's whole life. The Gann 9+ indicator uses the matrix chart to find the future high or low points of stocks or futures. Indicator Input: The base and step size can be set as 1 by default; When the multiple is -1, the multiple will be automatically obtained, or it can be filled in
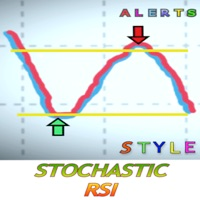
Что такое стохастический RSI?
Стохастический RSI (StochRSI) - это индикатор, используемый в техническом анализе, который колеблется между нулем и единицей (или нулем и 100 на некоторых графических платформах) и создается путем применения формулы осциллятора Стохастик к набору значений индекса относительной силы (RSI), а не к стандартным ценовым данным. Эта версия включает предупреждения, чтобы не упустить действительно хорошие возможности. Вы устанавливаете параметр, когда вы хотите получить с

This indicator scans the 1-3 Trendline pattern . The indicator is a 100 % non repaint low risk breakout system . The patterns are formed around swing high and swing lows which make them a low risk pattern with high reward.
PATTERN BACKGROUND The 1-3 Trendline Breakout pattern is formed by four(4) points which are composed of three (3) primary points and the pattern neck. A trendline is always formed by the point 1 and the neck of the pattern . When price breaks out of the trendline formed , it
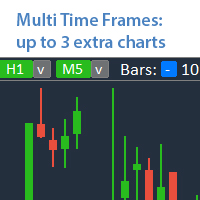
Анализ до 3 дополнительных графиков других таймфреймов , без переключения основного графика. Многофункциональная утилита : 66+ функций, включая этот инструмент | Свяжитесь со мной если у вас есть вопросы | Версия для MT4 Индикатор открывается в отдельном окне: Окно можно перемещать в любое место на графике (с помощью кнопки [<M>] ). Окно также можно свернуть, чтобы сэкономить место ( [ <^>] кнопка) В появившемся окне можно настроить: Период 1-го графика (слева);
Период 2-г

В основе индикатора EasyBands лежит тот же принцип, что и при построении Bollinger Band. Однако, данная модификация индикатора использует вместо стандартного отклонения средний торговый диапазон (Average True Range). Соответственно, с данныи индикатором абсолютно аналогично можно использовать все стратегии, которые применяются с Bollinger Band. В данной версии индикатора используется двенадцать уровней и средняя линия (белый цвет). Индикация тренда выполнена в виде окраски свечей в зависимости

Hello;
This indicator provides input and output signals of real volume levels with some mathematical calculations. It is simple and safe to use. As a result of the intersection of real volume levels with averages, it creates buy and count signals.
Indicator parameter descriptions:
A-PERIOD: Indicates the number of bars to be calculated.
B-GAMMA: A fixed Fibonacci trend average of 0.618 is used.
Use C-VOLUME TYPE:Tick volume as a constant.
D-HIGH LEVEL 2: Represents the level of the second
A technical Indicator Providing Price Convergence Signals along with value for experienced and professional traders. Easy to comprehend, Easy to understand.
This is a helping tool provides best signals. This indicator is designed based on the fundamentals of trade. A very good indicator you can customized its color. A best tool to find trade direction.
An adaptive indicator. It constantly adapts to the trade.

A value indicator for experienced and professional traders. It is helping tool to indicate the direction value gain. A best helping tool to trade value. This indicator is equipped with a colored line and a digital tool to indicate value numerically .
This indicator also helps to indicate value during trends. A study based on this indicator shows value of trade significantly changes during trends best tool to cash the trends.

Best helping tool for Professional and Experienced traders. A best Tool To find the trend. Instruction Manual: First Select your desired Symbol. Then attach this tool and wait till it identify the trend for you. Then it will be more feasible to trade.
Once again best tool to trade. Demo version is available you can fully test its functionality. More importantly there are always trend breaks Once Trend break is observed un-attach this tool and then re-attach to get the fresh trend. Precautions:

УР Моментер
UR Momenter отлично рассчитывает моментум цены в зависимости от исчерпания ценового движения, представленного в виде осциллятора. Следовательно, это дает нам действительно ранние сигналы потенциальных разворотов или откатов. Эта формула была открыта в 2018 году после того, как лопнул рыночный пузырь.
Преимущества использования UR Momenter:
Нет параметров У вас есть 2 линии, которые описывают движение цены - Белая линия, которая представляет собой моментум цены в соотношении с о
A basic tool for traders to trade percentile of the value. It indicates both values in the for of digits appeared on the left corner of the screen.
Instructions Manual : First choose your desired symbol and then select this tool. Please be remined that this tool is just a helping tool. its upon trader what he chooses. The function of this tool is just to provide a help in trading.

Одна из числовых последовательностей носит название - "Последовательность лесного пожара". Она была признана одной из самых красивых новых последовательностей. Её главная особенность заключается в том, что эта последовательность избегает линейных трендов, даже самых кратковременных. Именно это свойство легло в основу этого индикатора. При анализе финансового временного ряда этот индикатор старается отбросить все возможные варианты тренда. И только если это ему не удается, то он признает наличие

Theory VWAP is a volume-weighted moving average, bringing greater relevance to prices. The VWAP base calculation follows the classic formula described in Investopedia ( https://www.investopedia.com/terms/v/vwap.asp ). VWAP = sum(typical price[i]*volume[i]) / sum(volume[i])
Functionalities
Orion Intraday VWAP innovates by allowing the user to choose between the conventional Daily, Weekly and Monthly periods, also having the option of calculating the Intraday indicator, as used in other platform

График Weis Wave Forex для MT5 — это индикатор цены и объема. Чтение цены и объема было широко распространено через Ричарда Демиля Вайкоффа на основе трех созданных им законов: спроса и предложения, причины и следствия и усилия против результата. В 1900 году Р. Вайкофф уже использовал волновую диаграмму в своих анализах. Много лет спустя, примерно в 1990 году, Дэвид Вайс автоматизировал волновой график Р. Вайкоффа, и сегодня мы представляем вам эволюцию волнового графика Дэвида Вайса. Он показыв

This product generates signals at closing bars thanks to channel scaling. It visualizes these signals with an arrow. The color of the arrow indicates the direction of the trade. The default settings are valid for the H1 period. You can backtest for each period and product. The code content of the indicator has been applied in accordance with price movements as much as possible. For this reason, it detects trend beginnings and ends well.
Parameter descriptions:
PER: Indicates the number of bar

The Weis Wave Chart for MT5 is a Price and Volume indicator. The Price and Volume reading was widely disseminated through Richard Demille Wyckoff based on the three laws created by him: Supply and Demand, Cause and Effect and Effort vs. Result. In 1900 R.Wyckoff already used the wave chart in his analyses. Many years later, around 1990, David Weis Automated R. Wyckoff's wave chart and today we bring you the evolution of David Weis' wave chart. It shows the amount of Volume and the amount of pips

Nade com os grandes ou evite-os a todo custo. Com esse indicador, a escolha é sua! Indicador por coloração de barras, com respostas simples se os "grandes" estão negociando ou não. Saiba quando agir se o mercado está calmo ou agitado, de forma simples, pelo valor de retorno do indicador ou pela aparência das barras.
Indispensável indicador para a construção do seu robô ou para seu setup. Resultado do Indicador: 0 - 5. Participantes do mercado: 0 e 1 = Big Players! 2 e 3 = Dia normal. 4 e 5 = Mo

Three Triple Exponential Average oscillators merged into one. Fast period will pull on the slower period, and the slower will smooth out the faster and avoid early positions. You can use 2 fast and 1 slow, or Fibonacci range or 2 slow, 1 fast. NOW FREE. But please consider supporting me by buying my 2 for sale indicators.
You can use this as an entry indicator and exit indicator. Open when the tripleTRIX line crosses the zero line and close when it starts to reverse. When the peaks get bigger,

Smart Market Scanner and Dashboard The trend is very important when trading a financial instrument. The trend can be identified by checking various of structures and indicators. Trend shifts can be identified by trendline breakouts and horizontal support/resistance levels. Scanner will scan the selected symbols and show you the direction/trend on selected timeframes. Algo is based on: Price Cycles, Fractals, Order Blocks, Hi-Lo
Advantages: Multi timeframe Multi instruments including Currencies,

RISK TO REWARD TOOL for MT5 with UI on chart: (creates similar RR boxes like on tradingview) -creates and deletes draggable boxes on chart, ANY SYMBOL, ANY TF. Menu buttons:
NEW BUY, NEW SELL, DELETE ALL, ( and minimize) -draggable target TP level
-draggable SL limit level
-text labels with pips SL TP, RR ratio-there is no limit of boxes
-but program remembers first 100 boxes after changing input. there is parameter "delete_on_init" so false = every created box stays as it is, true

UR FrontEndBackEnd
UR FrontEndBackEnd — моя любимая формула для нахождения наиболее точных уровней поддержки и сопротивления. Я также разделил их на разные категории (пунктирные линии, сплошные линии и области), чтобы отметить, насколько они сильны. Все хранится в буферах, поэтому к ним легко получить доступ и реализовать в других инструментах.
Дополнение: Инструмент может нуждаться в адаптации к активу, к которому он применяется — активы различаются количеством цифр в цене, которая влияет

Awesome Oscillator Билла Уильямса с возможностью тонкой настройки и замены алгоритмов усреднения индикатора, что значительно расширяет возможности применения этого осциллятора в алгоритмическом трейдинге и приближает его по своим свойствам к такому индикатору, как MACD. Для уменьшения ценовых шумов итоговый индикатор обработан дополнительным усреднением Smooth. Индикатор имеет возможность подавать алерты, отправлять почтовые сообщения и push-сигналы при смене направления движения осциллятора и
DESCRIPTION The EasyFollowerTrader Bot1 DayTrade indicator operates only in favor of the majority trend. Thus, the indicator, at first, observe the trend of the daily chart to operate in its favor. Then the indicator watch the current chart trend. When these two charts are moving in the same direction, we have the highest probability of winnings. We will call this region the region of high probability of gain. In the region of high probability of gain, the indicator will indicate the best ent

Accelerator Oscillator Билла Уильямса с возможностью тонкой настройки и замены алгоритмов усреднения индикатора, что значительно расширяет возможности применения этого осциллятора в алгоритмическом трейдинге и приближает его по своим свойствам к такому индикатору, как MACD. Для уменьшения ценовых шумов итоговый индикатор обработан дополнительным усреднением Smooth. Индикатор имеет возможность подавать алерты, отправлять почтовые сообщения и push-сигналы при смене направления движения осцилля

SupportResistancePeaks Indicator indicator - is the combination of dynamic support/resitance and price action pattern. As a rule support/resistance indicators uses already calculated, history levels. The most disadvantage of this method - new(incomming) levels always are not the same as were on history, in other words accuracy is not so high as expected. My indicator is looking for dynamic/live levels that are forming right now after trend lost it's power and choppy market starts. As a rule exac
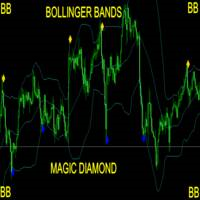
Take Your Trading Experience To the Next Level ! and get the Magic Bollinger Bands Diamond Indicator MagicBB Diamond Indicator is MT5 Indicator which can suggest signals for you while on MT5. The indicator is created with Non Lag Bollinger Bands strategy for the best entries. This is a system to target 10 to 20 pips per trade. The indicator will give alerts on the pair where signal was originated including timeframe. If signal sent, you then enter your trade and set the recommended pips targ
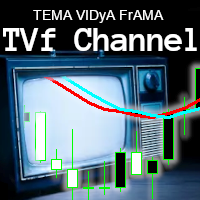
I really like this indicator. But I made it, so of course I would.. NOW FREE. But please consider supporting me by buying my 2 for sale indicators. You can multiply the weight of each indicator used to give more emphasis on it's value when averaging between the 3. Boost fast TEMA and it can move the indicator faster. Boost slow FrAMA and watch it smooth out. I like to use them as open/close lines and set them up so they move quick, but have the FrAMA smooth it out more.
Check out my other indi

The FX Stewards EA Signals Alert Financials Indicator works with every trading instrument(if used on synthetics, performance will not be optimum). Do not use on synthetics. Synthetics are not affected by fundamental analysis. The signals indicator assists with choosing which instrument to trade and the direction to take(follow the trend - the trend is your friend), making it easer for you to enter, re-enter or exit a trade with confidence(you're, however, still required to confirm entry before e

В основу алгоритма этого осциллятора положен анализ веера сигнальных линий технического индикатора RSI . Алгоритм вычисления сигнальных линий выглядит следующим образом. В качестве исходных данных имеем входные параметры индикатора: StartLength - минимальное стартовое значение первой сигнальной линии; Step - шаг изменения периода; StepsTotal - количество изменений периода. Любое значение периода из множества сигнальных линий вычисляется по формуле арифметической прогрессии: SignalPeriod(Number)

Индикатор iVeles_Perfect_Oscilator является опережающим и одним из самых лучших осциляторов на сегодняшний день, использует специализированный расчет текущих цен графика. Очень качественно и своевременно показывает смену направления, очень точный подход к уровням перекупленности и перепроданности, что позволяет своевременно принять решение по сделке. Работает качественно на любом ТФ и с любым инструментом. Параметры: Period - период расчетов Average - усреднение МА Method - применяемый мето

Wink IND is an indicator that tell you: -when MACD is saying buy or sell -when RSI is saying buy or sell -work on multi timeframes MT4 Version
by Wink IND: you don't need to have Knowledge about MACD or RSI don't need to check and compare MACD and RSI respectly don't need to check all of timeframes and compare the resaults don't lose time, save more time for your decisions in trading
Wink IND: multi timeframe indicator multi currency indicator show the positions by graphic shapes, arrows and

В основу алгоритма этого трендового индикатора положен анализ веера сигнальных линий универсального мувинга I . Алгоритм вычисления сигнальных линий выглядит следующим образом. В качестве исходных данных имеем входные параметры индикатора: StartLength - минимальное стартовое значение первой сигнальной линии; Step - шаг изменения периода; StepsTotal - количество изменений периода. Любое значение периода из множества сигнальных линий вычисляется по формуле арифметической прогрессии: SignalPeriod(
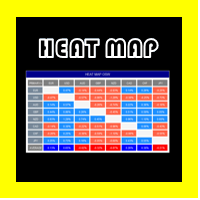
ГОЛОВНАЯ КАРТА OSW
Этот индикатор идеально подходит для того, чтобы знать текущее состояние всех комбинаций валют и знать их изменение.
Вариация рассчитывается по процентному изменению цены от текущей цены до 24 часов назад или по тому, что настроено в меню.
Чтобы узнать изменение валюты, вам просто нужно посмотреть на основную валюту, например:
в евро вы должны смотреть вертикально, чтобы сравнить с другими валютами, и в конце всего этого вы найдете среднее значение всех этих значений вари

Top indicator for MT5 providing accurate signals to enter Trades.
This Indicator will provide pretty accurate trading signals and tell you when it's best to open a trade by giving alerts to buy or sell. Mainly was created to target Volatility Index on Deriv broker however, the Spot Detector Arrow Indicator can be applied to any financial assets(Forex, Crypto, Indices, Volatilities) on MT5 Brokers.
HOW TO BUY Wait for signal Alert to Buy will be sent to your MT5 Terminal Blue arrow facing

** All Symbols x All Time frames scan just by pressing scanner button ** *** Contact me to send you instruction and add you in "Divergence group" for sharing or seeing experiences with other users. Introduction MACD divergence is a main technique used to determine trend reversing when it’s time to sell or buy because prices are likely to drop or pick in the charts. The MACD Divergence indicator can help you locate the top and bottom of the market. This indicator finds Regular divergence for pul
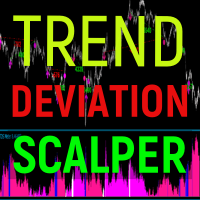
Trend deviation scalper - is the manual system to scalp choppy market places. Indicator defines bull/bear trend and it's force. Inside exact trend system also defines "weak" places, when trend is ready to reverse. So as a rule, system plots a sell arrow when bull trend becomes weak and possibly reverses to bear trend. For buy arrow is opposite : arrow is plotted on bear weak trend. Such arrangement allows you to get a favorable price and stand up market noise. Loss arrows are closing by common p

ESS ПОДГОТОВКА СИГНАЛОВ СТРАТЕГИИ
Этот индикатор обнаруживает свечи конвертного типа, к которым применяется фильтр, этот фильтр состоит из 3-х стратегий вместе, с помощью которых можно выявить максимально возможную эффективность в пределах измеримых параметров.
Сигналы обозначаются стрелками вверх и вниз для каждого из направлений, и вы также можете активировать или деактивировать оповещения, электронные письма и push-сообщения на мобильный телефон.
Стоит отметить, что ни один индикатор не э

Inventory Retracement Trade it is designed based on one of the most popular tradingview indicator. This is mostly combined with other popurlar trend indicator to confirm the strength of the movement. Definition Inventory Retracement Trade is quickly becoming one of the most popular ways to identify where short-term counter trend institutional inventory has subsided and when it’s time to re-enter into a trade’s original trend direction.

Индикатор Active Trend помогает анализировать рынок на выбранном временном интервале. Он определяет господствующую тенденцию. Используются в трейдинге. Можно использовать так основной для определения тренда. Индикатор работает хорошо как на коротких так и на более длинных трендовых участках. Во флете рекомендуется использовать фильры по вашему выбору. Может сопровождать позицию стопом, стоп рекомендуется выставлять на фиксированном расстоянии от точки формируемой индикатором. Самым простым вари

Trend driver bars is the manual trading system, which defines current trend continue or it's pull-back/reverse. "Driver" bars - are price action patterns that has powerfull affect on market, defining it's near future direction. Generally, driver bars represents trend "skeleton" and often anticipates new market impulse. System plots arrows when market shows 3 pattenrs in a row(most powerfull combo-pattern), and makes fast scalping of incomming movement. Loss positions closes by common profit. Lot

Стрелочный технический индикатор без перерисовки Signal Breakthrough на рынке Форекс способен давать подсказки с наименьшими погрешностями.
Каждый рост и каждое падение отражается и на вашем эмоциональном состоянии: надежда сменяется страхом, а когда он проходит, снова появляется надежда. Рынок использует ваш страх для того, чтобы не дать вам воспользоваться сильной позицией. В такие моменты вы наиболее уязвимы. Валютные пары никогда не растут и не падают по прямой. Их подъемы и падения перем

Welcome to Investment Castle products This product is exclusively available in the MQL5 market and is not available and will not be available anywehere else. The Combined indicator is a multi-time frame indicator and it is built using 3 indicators: Bands indicator which draws the support and resistance key levels using up to 5 different time frames Patterns indicator which draws the chart patterns using up to 6 different time frames Spots indicator which shows the common candlestick patterns Yo
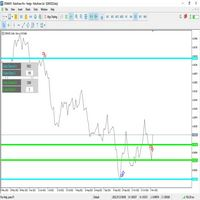
Индикатор - Price Channel состоит из двух независимых ценовых каналов и уровней ценовых зон - (А / B). Индикатор постоянно следя за поведением и движением цены, а также за пробоями уровней каналов - (А / B), переставляя уровни и фиксируя новые зоны экстремумов максимумы и минимумы. Для анализа предыдущих и текущих зон максимума и минимума, не зависимо указывается количество баров в каждом канале - (А / B). На графике индикатор выводит полезную информацию для каждого канала - (А / B): 1. Количес
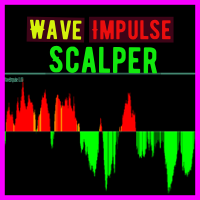
Wave Impulse OmegaScalper - is the manual system for scalping. In many cases Indicator "eats" almost all possible trend wave. System defines up price wave and down price wave. Inside the exact wave - system defines true trend movement and choppy market. Indicator plots signals while market is trending, powerfull and has quiet good volatility. This is complete system with enter and exit points. Main Indicator's Features Signals are not repaint,non-late or disappear(exept cases when system recalcu
А знаете ли вы, почему MetaTrader Market - лучшее место для продажи торговых стратегий и технических индикаторов? Разработчику у нас не нужно тратить время и силы на рекламу, защиту программ и расчеты с покупателями. Всё это уже сделано.
Вы упускаете торговые возможности:
- Бесплатные приложения для трейдинга
- 8 000+ сигналов для копирования
- Экономические новости для анализа финансовых рынков
Регистрация
Вход
Если у вас нет учетной записи, зарегистрируйтесь
Для авторизации и пользования сайтом MQL5.com необходимо разрешить использование файлов Сookie.
Пожалуйста, включите в вашем браузере данную настройку, иначе вы не сможете авторизоваться.