Смотри обучающее видео по маркету на YouTube
Как купить торгового робота или индикатор
Запусти робота на
виртуальном хостинге
виртуальном хостинге
Протестируй индикатор/робота перед покупкой
Хочешь зарабатывать в Маркете?
Как подать продукт, чтобы его покупали
Платные технические индикаторы для MetaTrader 5 - 36

Индикатор паттерна 31 ("Длинный остров") из книги Томас Н. Булковский "Полная энциклопедия графических ценовых моделей". Второй гэп в обратном направлении.
Параметры: Alerts - Включение алертов при появлении стрелки Push - Отправка Push-уведомления при появлении стрелки (требуется настройка в терминале) GapSize - Минимальный размер гэпа в пунктах ArrowType - Значок: от 1 до 17 ArrowVShift - Сдвиг значков по вертикали в пунктах ShowLevels - Показывать уровни ColUp - Цвет линий вверх ColDn -
Stochastic Crossover Dashboard Pro uses the value of Stochastic indicator. The Stochastic's parameters can be adjusted via the Edit boxes of this dashboard. The monitoring pairs will be selected by adding to the Market Watch (no need to set prefixes or suffixes) , you can monitor many pairs as you like. This dashboard will check almost popular time frame (M1,M5,M15,M30,H1,H4 and D1). The colors can be customized. The parameters of Stochastic can be set at the input. Crossover signal can be sent

[ How to use the Demo version ] [ MT4 Version ] AO unpaid divergences MT5 AO unpaid divergences is the first indicator developed to detailed analyze Regular and Hidden Divergences. It uses this analysis to find out possible entry points and targets. Below some of the characteristics of this indicator: Time saving Highly customizable Working for all pairs (Crypto, Forex, Stocks, Indices, Commodities...) Suitable for Scalping or Swing trading Possible reversal swings Alerts and Notifications on M

DYJ TRADINGVIEW — это многоиндикаторная рейтинговая система, использующая подсчет рейтинговых сигналов и инструменты анализа для поиска возможностей входа на мировые рынки. DYJ TRADINGVIEW имеет 10 встроенных индикаторов для анализа рынка. Анализ на основе индикаторов используется многими трейдерами, чтобы помочь им принять решение о том, какие сделки заключать и где входить и выходить из них. Мы используем несколько разных типов, которые могут хорошо дополнять друг друга. Используйте нас, чтобы

RUBFX Trend histo mt5 , indicator works on synthetic indices, Currencies , Indices ,Stocks Gold etc , good for follwoing trend on the markets suitable for scalping Buy Rules; When the histo changes to Blue you place buy order ,stop loss just below the previous swing low Sell Rules; When the histo changes to Red you place sell order ,stop loss just below the previous swing high Trade on a timeframe which best suits your trading style

-Концепция тенденции заполнения фитиля
Во время высокой волатильности на рынке свечи склонны создавать фитили на пути своего движения. Фитиль в свече отражает отклонение цены. В большинстве случаев эти фитили заполняются, поскольку в этом направлении движется огромный объем. Wick Fill Trend сканирует эти возможности, фокусируясь на трендовых рынках.
Он имеет приборную панель симулятора успешности, которая отображает живой сигнал с точкой входа, тейк-профитом и стоп-лоссом. Этот симулятор успе

Используйте возможности MACD с максимальной эффективностью. Выбирайте цену, фильтры и способ усреднения, все возможные параметры. Уникальная особенность "MACD by MK" - усиление сигнальной линии. Изгибы индикатора имеют цветовые обозначения и дополнительно отражаются на основном чарте. Соотнося их и исходную цену сделайте вашу торговлю более качественной. Для удобства использования добавлен аккуратный ZigZag Замечательное свойство "MACD by MK" - детекция ослабления движения. Как только завершаютс
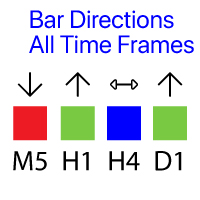
Показывает направление баров на всех основных таймфреймах. Многофункциональная утилита : 66+ функций, включая этот индикатор | Версия для MT4
Значение визуальных сигналов ( квадраты):
Красный : Цена закрытия ниже цены открытия: Close < Open; Зелёный : Цена закрытия выше цены открытия: Close > Open; Синий : Цена закрытия равна цене открытия: Close = Open; Можно установить Сдвиг расчётного бара относительно текущего: Shift = 0: направление текущего (незакрытого) ба
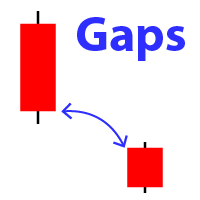
Отображает на графике появляение гэпа (случай, когда цена закрытия предыдущего бара отличается от цена открытия нового бара). Вы можете настроить:
Размер гэпа (в пунктах): будут отображаться только те гэпы, которые превышают или равны этому значениею. Цвет стрелок: отдельно для гэпов вверх и вниз. При наведении мышкой на стрелки гэпов на графике - будет отображен их размер. Для разных тайм-фреймов и валютных пар рекомендуется подбирать подходящий размер гэпа. У меня также есть многофункц
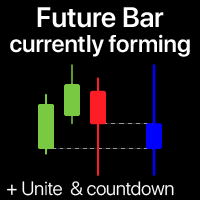
Индикатор показывает формирующуюся свечу выбранного таймфрейма Несколько баров могут быть опционально объединены в одну свечу: помогает увидеть общую картину Многофункциональная утилита #1 : 66+ функций, включая этот индикатор | Свяжитесь со мной по любым вопросам | Версия для MT4 В настройках выберите таймфрейм , который будет использоваться для будущего бара: Справа от текущей цены вы увидите формирующийся бар на указанном интервале. Если активировано в настройках, в правом ниж

This indicator is a scalping indicator intended solely for the Boom and Crash indices of the Deriv Limited market It supports Boom 500, Boom 1000, Crash 500 and Crash 1000 Not repaint and no bug The settings are intuitive and easy to use The product activation number is 20 The Time Frame used depends on the user If you are an aggressive scalper then just use M1 For long trades use M15 If you are conservative use M5 Please contact me for more details of its use

Hello,
This is an easy symbol change panel.
This is a full version of Symbol1 2Changer
Symbols must be active on your Market Watch list.
Parameters:
SymbolList - you can add more symbols with a comma(,) ratio - change the size LineNumber - you can set that how many symbols are displayed per line. button_width - modify the button size button_height - modify the button size
Thank you.
Индикатор паттерна 31 ("Длинный остров") из книги Томас Н. Булковский "Полная энциклопедия графических ценовых моделей". Параметры: Alerts - Включение алертов при появлении стрелки Push - Отправка Push-уведомления при появлении стрелки (требуется настройка в терминале) GapSize - Минимальный размер гэпа в пунктах ArrowType - Значок: от 1 до 17 ArrowVShift - Сдвиг значков по вертикали ShowLevels - Показывать уровни ColUp - Цвет линий вверх ColDn - Цвет линий вниз Auto5Digits - Автоматическ

IBB Candles is a tool that is based on the concept of Inverse Bollinger Bands. It compares price relative to state of the bands and plots candles with different colors defining the current state of the market i.e range | trend | strong trend. As the name suggests IBB(Inverse Bollinger Bands) is a technique which is completely different from the traditional Bollinger Bands and proves to be much more effective in analyzing market. This personal implementation makes this tool a more reliable optio

Indicador de MQL5 basado en 3 EMAs, en función del precio. El precio influye en las EMAs, de tal forma que los Máximos y Mínimos solo la alteran minimamente, este influjo lo llame radio. Considerando la influencia del radio como constante, por lo que no tiene valores de entrada. Ideal para todas las criptomonedas. Funciona en todos los tiempos. Se sugiere operar cuando el precio este abajo y en bajada.... o cuando el precio este encima y en subida.
Binary Options Assistant (BOA) ICE Signals Indicator provides signals based on gkNextLevel Binary Options Strategy. Indicators: 2 Bollinger Bands & Stochastic
Stop missing trades, stop jumping from chart to chart looking for trade set-ups and get all the signals on 1 chart! U se any of the BOA Signals Indicator with the Binary Options Assistant (BOA) Multi Currency Dashboard . All BOA Signal Indicator settings are adjustable to give you more strategy combinations. The signals can be seen vis

Perfect indicator to use No Forex or Binary Options You can use it manually or use it automated on the mt2trading platform or similar 90% winrate indicator Common questions Which brokers does this work with? IQOption.com Binary.com Alpari.com Specter.ai Instaforex.com clmforex.com GCOption.com Is it necessary to leave my pc on all day using automated mode? > although our platform must constantly run on your laptop / PC, if you want it to work while you are away, it is not necessary to leave your

Fractal 358 Plus is a predictive indicator that provides the clearest sight of price movements. Identifying graphic patterns such as Caixote (Crate), Pivot and Inside Candle , it shows entries and exits spots, as well as threats to your trades in the markets. It comes ready to use with B3 Mini Index (WIN$ series) and can be adjusted to use with any asset and timeframe. Fractal 358 unravels price movement
Based on the Fibonacci sequence, Fractal 358 is a new and different way of reading and und
Индикатор паттерн 28 и 29 ("Рогообразое дно", "Рогообразная вершина") из книги Томас Н. Булковский "Полная энциклопедия графических ценовых моделей". Параметры: Alerts - Включение алертов при появлении стрелки Push - Отправка Push-уведомления при появлении стрелки (требуется настройка в терминале) BarsInsideFrom - Минимальное количество баров между вершин BarsInsideAdd - Количество баров между вершинами может находиться в пределах от BarsInsideFrom до BarsInsideFrom+BarsInsideAdd-1. При знач

A fully featured BB indicator You're no longer limited to the built in default of using BB off a SMA method, now you can choose from: SMA - SMMA - EMA - LWMA - ADAPTIVE - FRACTAL ADAPTIVE - DEMA - TEMA - VARIABLE INDEX DYNAMIC
You now also have up to 5 standard deviation levels, with price labels. Styling wise, there are color gradients provided for deviation filling, candles (bars too), deviation lines and texts.
Options: - MTF - 9 choices of MA to base the BB off
- 5 adjustable deviation lev

Устройство подачи отката проверяет возможности отката после того, как произошло первое движение. Лучше всего работает с 15-метрового графика и выше. В основном он сканирует вторую волну тренда, что делает его более прибыльным. Работает с любым финансовым инструментом, Он не перекрашивает/не меняет цвет или не отменяет стрелки, прост в настройке и использовании. Вступительная цена: СКИДКА 50% MT4 version: https://www.mql5.com/en/market/product/67443
Как это работает Индикатор основан на м
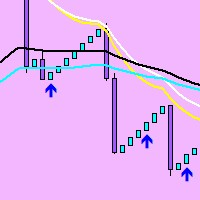
modification of the Rsi ma indicator. Added a filter-the trend indicator iMA (Moving Average, MA). You can also now set the character code (from the Wingdings font) for the arrows and the offset of the arrows.
The 'Rsi ma' indicator draws two indicator buffers using the DRAW_ARROW drawing style. The 'Oversold' buffer is drawn when the indicator LEAVES the oversold zone and the iMA is under the price, and the 'Overbought' buffer is drawn when the indicator LEAVES the overbought zone and the iMA
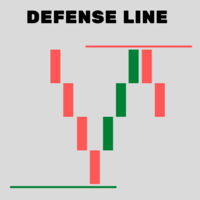
Indicator that determines very accurately "future" where BUYERS and SELLERS will defend their positions.
DOES NOT use moving averages, Fibonacci or any other underlying indicators.
SIMPLE AND EFFICIENT !!
In these defense regions "DEFENSE LINE" is the best region for decision making to buy / sell.
1- Place the indicator on the chart
2 - Move the Vertical lines to the period to be analyzed
3 - The Defense Line will be drawn automatically
4 - To erase the Defense Line, press the "R" key

1. What is it The classic Bollinger Bands and the Bollinger Bands indicator built into the system, they have the same mean period and deviation period. And the method of average is just the simple moving average method. The deviation method used is just the standard deviation method. All this limits our research because: Sometimes we would like to have longer period averages + shorter period deviations. Sometimes we want moving averages that are not limited to simple moving averages but als
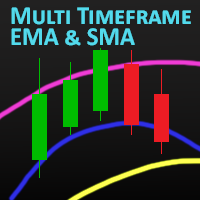
MT Moving Average
MT Moving Average is an easy to use multi time frame moving average indicator. It shows moving averages (SMA or EMA) of current symbol from all time frames (higher and lower). No need to switch between time frames anymore. With help of the indicator panel you can select which timeframe should be shown on the chart. I.e. your current timeframe is M5 and you can turn on M15 to see the the moving average of period M15. Indicator settings
Dark interface --> Set to true to use dar

The Half ma arrow indicator for the MetaTrader 5 trading terminal is a simple but effective tool that gives a signal about a change in the current trend. The Half ma indicator looks like a solid dynamic line that changes color at the points where the trend changes. At these points, the indicator draws arrows of the corresponding color and direction.The Half ma arrow indicator for the MT5 terminal is not an independent source of input signals. It will be most effective to use it as a trend filte

El Super Suavizador Inteligente es la culminación de la evolución de los suavizadores en funcion del precio, funciona en todos los pares de divisas, es fácil de usar, y puedes usarlo varias veces en un mismo par, afin de darte una idea de hacia donde va el precio, muy util para ver la tendencia a largo plazo. El SSI trata siempre de formar ondas de subidas y bajadas a fin de poder mostrar el máximo y/o mínimo de la tendencia del precio.

ToolBox 360 is the swiss knife of all indicators. It is full packed with useful tools to help you with your trading. It can be used to find best entry and exit points and help you to decide if you should open a trade or not. It shows market trends, candlestick formations outside / inside bars and you can sett time based allerts.
Main features:
Time based Fibonacci lines Choose a start and end time and the indicator shows you Fibonacci lines within the selected time range including range high a

Индикатор паттернов 24 и 26 ("Голова и плечи") из книги Томас Н. Булковский "Полная энциклопедия графических ценовых моделей". Параметры: Alerts - Включение алертов при появлении стрелки Push - Отправка Push-уведомления при появлении стрелки (требуется настройка в терминале) PeriodBars - Период индикатора K - Дополнительный параметр влияющий на точность распознавания и форму паттерна ArrowType - Значок: от 1 до 17 ArrowVShift - Сдвиг значков по вертикали в пикселях ShowLevels - Показывать

Индикатор паттерна 30 ("Островной разворот") из книги Томас Н. Булковский "Полная энциклопедия графических ценовых моделей" (два гэпа, второй гэп по направлению первого). Параметры: Alerts - Включение алертов при появлении стрелки Push - Отправка Push-уведомления при появлении стрелки (требуется настройка в терминале) GapSize - Минимальный размер гэпа в пунктах ArrowType - Значок: от 1 до 17 ArrowVShift - Сдвиг значков по вертикали в пикселях ShowLevels - Показывать уровни ColUp - Цвет лини
Индикатор гэпа (паттерн 23 из книги Томас Н. Булковский "Полная энциклопедия графических ценовых моделей".
Параметры: Alerts - Включение алертов при появлении стрелки Push - Отправка Push-уведомления при появлении стрелки (требуется настройка в терминале) GapSize - Минимальный размер гэпа в пунктах ArrowType - Значок: от 1 до 17 ArrowVShift - Сдвиг значков по вертикали в пикселях Auto5Digits - Автоматическое умножение GapSize на 10 при работе на 5-ти и 3-хзначных котировках. Примечание.

A flexible 2-Line MACD indicator The default MACD indicator inside MT4, limits you to using the MACD with a fast-EMA, slow-EMA. This MACD indicator allows you to set your own MA-Method choices for these 2 components, separately! You can select from SMA, EMA, SMMA, LWMA, ADAPTIVE MA, FRACTAL MA, DEMA, TEMA, VARIABLE INDEX DYNAMIC MA, and can even use a separate method for each 2 fast-slow. The signal line has options from SMA-EMA-SMMA-LWMA. On-chart colored candles, with drawing condition types i

Индикатор паттерна 21, 22, 34 ("Флаг") из книги Томас Н. Булковский "Полная энциклопедия графических ценовых моделей". Параметры: Alerts - Включение алертов при появлении стрелки Push - Отправка Push-уведомления при появлении стрелки (требуется настройка в терминале) PeriodBars - Период в барах K - Дополнительный параметр влияющий на точность распознавания и форму паттерна. Действие параметра будет заметно, если включенны не все варианты паттерна (не все три параметра Expanding, Tapered, Para

- This Indicator will automatically plot 13 support/resistance reference lines base on Fibonacci level calculation for timeframe M30 and above. - Not available for charts with timeframe lower than M30 due to noisier (high fluctuation) nature.
- The reference lines are plotted from a maximum and minimum levels derived automatically from a custom algorithm. - The 13 reference lines are at 123.6%, 111.8%, 100%, 88.2%, 76.4%, 61.8%, 50%, 38.2%, 23.6%, 11.8%, 0%, -11.8% & -23.6%. - It will also plot
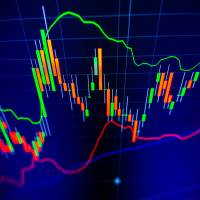
The indicator calculates reversal points based on the past trend and forms a channel (outer) on this basis. This elapsed time span from which the reversal points are determined can be specified in the settings.
An inner channel is also drawn in white. The trend continues in this channel, if there is a sideways trend. Here the upper / lower line form the possible turning point.
The indicator is suitable for all trading areas, whether forex, crypto, metals, indices or futures. All areas traded
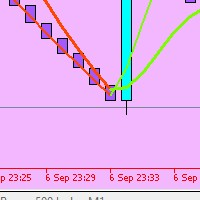
The marik_moving average signal indicator for the MetaTrader 5 trading terminal is built on the interaction of the fast and slow moving Hull.
The moving average is known for the fact that the lag of the indicator, characteristic of moving averages, is minimized in it. The marik_moving average signal indicator for MT5 at the intersection of the "Fast" and "Slow" lines displays a signal that is regarded as a likely price reversal.
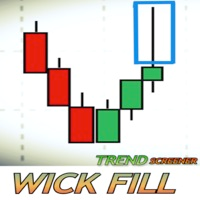
Что такое фитиль в трейдинге? Как работает этот скринер? Фитиль в свече отражает отклонение цены. Данный скринер пытается определить фитили с большим потенциалом для заполнения. Данный скринер ориентирован на фитили, которые происходят на трендовом рынке.
Скринер отображает приборную панель, которая предлагает общий вид потенциальных фитилей, торгуемых в реальном времени. Он показывает ВСЕ пары/инструменты, упорядоченные по таймфреймам. Возможности для покупок называются "UP-W". Они отображаю

Данный индикатор показывает свечную комбинацию, основанную на додж, додж и пин-бар. Логика паттерна состоит в том, чтобы стать на стороне силы, после неопределенности. Индикатор универсален и пригодится для торговли бинарными опционами, форекс, ETF, криптовалютой, акциями. Индикатор поддерживает таймфреймы от М5 до МN включая нестандартные ТФ, представленные в МТ5.(М5,М6,М10,М12, М15, М20, М30, Н1, Н2, Н3, Н4, Н6, Н8, Н12, D1, W1, MN). Реализована возможность включения и отключения ТФ. Звуковые

This is an original, agile, and excellent trending system. Whether you are a beginner trading novice or a professional trader, this set of indicators can help you quickly and timely track the latest changes in market trends. It has the following characteristics: The method of use is extremely simple, plug and play, and the display of all trend analysis results is clear at a glance; There is no need to configure any functional parameters, the trend tracking indicator will automatically analyze th

Moving Average Crossover with Alert is a indicator that can show buy and sell arrow types of alerts supported by the platform based on the crossover of two moving averages according to the parameters given by the trader. You can change inputs by yourself. This indicator only show the arrows to buy or sell to execute the trade you have to do it by yourself. For more information see the screenshot.

This Advanced Pivots Point is a MT5 Indicator and the essence of this technical indicator is to transform the accumulated history data. Pivot Point Indicator provides for an opportunity to detect various peculiarities and patterns in price dynamics which are invisible to the naked eye. Pivot Points Fibonacci retracements Previous day’s open, high, low, and close.
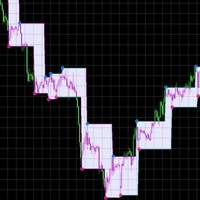
Ставший уже обычным и привычным для любого трейдера индикатор ZigZag приобрёл новые формы и получил дополнительное усиление, включив в свою команду результаты анализа Parabolic SAR. Тандем этих двух индикаторов показывает великолепную точность в определении направления тренда и своевременного получения сигнала о его развороте. Основными сигналами на графике служат стрелки-маркеры красного и зелёного цвета. Зелёная стрелка-маркер - начинаем продажи, красная - покупки. В дальнейшем данный индикато

Описание: Индикатор Wall of Worry позволяет оценить настроение рынка и возможные развороты. Индикатор представляет три линии, которые отображаются в отдельном окне. Черная линия (тренд)- количество объемов в теле свечи. Красная линия (медведи)- количество объемов в верхней тени свечи. Синяя линия (быки)- количество объемов в нижней тени свечи. Идея основана на " Wall of Worry" - это периодическая тенденция финансовых рынков преодолевать множество негативных факторов и продолжать расти. Индикат
Индикатор паттернов 52 и 53 ("Падающий/растущий клин") из книги Томас Н. Булковский "Полная энциклопедия графических ценовых моделей".
Параметры: Alerts - Включение алертов при появлении стрелки Push - Отправка Push-уведомления при появлении стрелки (требуется настройка в терминале) PeriodBars - Период индикатора K - Дополнительный параметр влияющий на точность распознавания и форму паттерна ArrowType - Значок: от 1 до 17 ArrowVShift - Сдвиг значков по вертикали в пикселях ShowLevels - По

Real Trend Zigzag shows the real trend of a market, u nlike the default Zigzag indicator. It calculates the trend in real time and shows green lines for upwards trends, red lines for downward trends and blue lines for no trends. Regarding the old slogan "the trend is your friend" it helps you to decide if should open a buy or sell position. If you are looking for a multi timeframe zigzag, take a look at the PRO version: https://www.mql5.com/en/market/product/72071 MT4 version can be found her
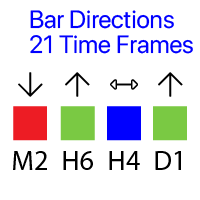
Показывает направление баров на всех 21 таймфреймах. Многофункциональная утилита : 65+ функций, включая этот индикатор | Свяжитесь со мной по любым вопросам | версия для MT4
Значение визуальных сигналов ( квадраты):
Красный : Цена закрытия ниже цены открытия: Close < Open; Зеленый : Цена закрытия выше цены открытия: Close > Open; Синий : Цена закрытия равна цене открытия: Close = Open; Вы можете установить Сдвиг рассчитываемого бара относительно текущего бара: Сдвиг

High Probability Reversal Arrow Indicator The indicator looks for trend exhaustion areas, and plots Buy/Sell arrow after on confirmation of trend exhaustion. Signals can also be shown as popup alerts, or be sent as e-mail or mobile phone notification. Trades can be taken on breakout of the signal candle. Inputs
Signal Type: Aggressive/Normal History Bars : Can be set to 0 (zero) to show all historical signals, or can be set to a limited number of bars for faster execution. Show Alert : True/Fa
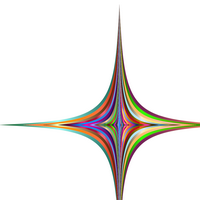
Для сглаживания временных рядов можно использовать различные оконные функции. Оконные функции могут довольно сильно отличаться друг от друга по своим характеристикам – уровнем сглаживания, подавлением шумов и т.д. Этот индикатор позволяет реализовать основные оконные функции и оценить их работу на финансовых временных рядах. Параметры индикатора: iPeriod – период индикатора. iPeriod >= 2 iCenter – индекс отсчета, на котором будет находиться центр оконной функции. По умолчанию этот параметр
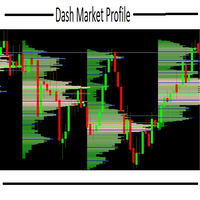
this indicator is essential when it's necessary to identify trade locations on chart. You can initially get an idea of the candlestick's direction with other graphical tools and then identify the best regions with the DMP. The Dash Market Profile is a statistical indicator, that mean it is an indicator that is based on mathematical calculations, identifying the best regions and observing the candles of the best regions to trade. The financial market is not as easy as it seems, it is necessar
100 % PER MONTH PROFIT---- MY NEW SIGNAL HERE -------> https://www.mql5.com/en/signals/2162238?source=Site+Signals+My#
What Is the Average True Range (ATR)? The average true range (ATR) is a technical analysis indicator, introduced by market technician J. Welles Wilder Jr. in his book New Concepts in Technical Trading Systems, that measures market volatility by decomposing the entire range of an asset price for that period. The true range indicator is taken as the greatest of the foll

GannRS Trend Scalper GannRS is an advanced trading tool based on Gann Law and Supports and Resistances. designed to have an active trading at any time not lagging Indications are given at the beginning of a new candle
Please watch the full tutorial video.
How to use GannRS Very easy to set up... Put it on your chart Adjust inputs
Inputs Show Resistance and support : [bool] true = Shows R/S on chart false = does not show Show Levels :[bool] true = Shows levels on the chart false = does n

The Spike King Indicator is, as the name suggests, a forex trading tool that recognizes spikes in the market. This is a perfect indicator for reversal traders. A spike often indicates a turn-around moment. The best way to use that gauge is to apply it to your favourite trading system as a filter. ONGOING PROMO!!! The indicator is displayed in a separate window placed just below the main trading chart, as well as a confirmation arrow with shows us in the chart fr every new signal. HAS AN INBUILT

V Band is a technical analysis tool that helps smooth out price action by filtering out the “noise” from random price fluctuations. It is calculated by taking the average of a market’s price over a set period of time.
It can be applied to stocks equity indices, commodities and Forex . V Bands is used to identify trends or support and resistance levels.
They can also be used to generate buy and sell signals.
Choose a trading style and start trading!

Hi there! Since I am starting commercial and non-commercial product publishing I would highly appreciate: If you like this product, please rate it. That will help to promote not only this product, but indirectly another ones. So, such promotion will help to make some money from commercial products. Thus, I will have opportunity to fund my another directions of trading researches like bot development using mql4 and mql5 programming languages as well as python written products like crypto bots. If

MT4 indicator version https://www.mql5.com/en/market/product/72342
I personally use this indicator to scalp. Accurate for accessing extremes and supports for buy positions primarily for 1 minute time frames. Other time frames can be used but the levels are different. Its a better oscillator and compare with others to see the difference. Day trade using neuro network concepts. This indicator uses elementary forms of neuro networks to generate signals to buy and sell. Use the indicato

Логика работы Важность данного индикатора заключается в том что он позволяет понять сколько “топлива еще осталось у инструмента”. Представьте ситуацию, вы выехали на машине с полу- разряженной батареей, в среднем обычно такого количества энергии машине хватает на 250 км, соответственно при всем желании путь в 700 км, вам не преодолеть. Так и у каждого инструмента, есть определенный дневной ход цены, и в результате статистических наблюдений было выявлено что 95% времени актив проходит 1 ATR в де

Индикатор iPump это универсальный индикатор, совмещающий в себе преимущества трех категорий индикаторов. одновременное определение тренда на нескольких ТФ определение зон сопротивление и поддержки определение зон перекупленности и перепроданности Функции индикатора: Определение тренда Данная функция будет необходима всем трейдерам, которые хотят объективно оценивать текущее направление рынка и избежать субъективизма. Вы за доли секунды сможете сравнить направление тренда на самых главных тайм

Automatic fibonacci with alerts is an indicator that automatically plots a fibonacci retracement based on the number of bars you select on the BarsToScan setting in the indicator. The fibonacci is automatically updated in real time as new highest and lowest values appear amongst the selected bars. You can select which level values to be displayed in the indicator settings. You can also select the color of the levels thus enabling the trader to be able to attach the indicator several times with d
Индикатор паттерна 5 и 6 ("Расширяющийся восходящий клин" и "Расширяющийся нисходящий клин") из книги Томас Н. Булковский "Полная энциклопедия графических ценовых моделей".
Параметры: Alerts - Включение алертов при появлении стрелки Push - Отправка Push-уведомления при появлении стрелки (требуется настройка в терминале) PeriodBars - Период индикатора ArrowType - Значок: от 1 до 17 ArrowVShift - Сдвиг значков по вертикали в пикселях ShowLevels - Показывать уровни ColUp - Цвет стрелок вве

Ing (inguz,ingwar) - 23-я руна старшего футарка ᛝ, Unicode+16DD. Добавьте немного рунической магии в ваши торговые стратегии. Правильная разметка дневного чарта обозначит вам удачные моменты для контр-трендовой торговли. Просто использовать, имеет высокую эффективность в волатильных участках. Будьте осторожны в боковых движениях. Сигналы ᛝ генерируются при пересечении основных линий построения. Красная стрелка вниз - рекомендованы продажи Синяя стрелка вверх - рекомендованы покупки редкие фиоле

Данный индикатор определяет флэт и закрашивает найденный участок цветным прямоугольником. Основная идея данного индикатора, определять флэт в виде заполненности ценой определенной площади на графике. Входные параметры: Color rectangle - цвет закрашиваемого прямоугольника. Bars in rectangle - минимально допустимое количество баров в прямоугольнике. Density in % - плотность флэта, задается в процентах от площади прямоугольника.
Индикатор паттернов 1 и 4 ("Расширяющееся дно" и "Расширяющаяся вершина") из книги Томас Н. Булковский "Полная энциклопедия графических ценовых моделей". Вариант 1: низ, верх, низ, верх, прорыв верха. Вариант 2: верх, низ, верх, низ, прорыв верха.
Параметры: Alerts - Включение алертов при появлении стрелки Push - Отправка Push-уведомления при появлении стрелки (требуется настройка в терминале) Variant1 - Отображать вариант 1 паттерна Variant2 - Отображать вариант 2 паттерна PeriodBars -
Индикатор паттернов 2 и 3 ("Расширяющаяся формация прямоугольная и восходящая" и "Расширяющаяся формация прямоугольная и нисходящая") из книги Томас Н. Булковский "Полная энциклопедия графических ценовых моделей".
Параметры: Alerts - Включение алертов при появлении стрелки Push - Отправка Push-уведомления при появлении стрелки (требуется настройка в терминале) PeriodBars - Период индикатора K - Дополнительный параметр влияющий на точность распознавания и форму паттерна. Чем меньше значение
Индикатор паттернов 13 - 20 ("Двойная вершина" и "Двойное дно" тип Адам-Адам, Адам-Ева, Ева-Адам, Ева-Ева) из книги Томас Н. Булковский "Полная энциклопедия графических ценовых моделей". Адам - острые вершины/впадины, Ева - пологие. Параметры: Alerts - Включение алертов при появлении стрелки Push - Отправка Push-уведомления при появлении стрелки (требуется настройка в терминале) PeriodBars - Период индикатора K - Дополнительный параметр влияющий на точность распознавания и форму паттерна. Че

ChannelVM - канальный индикатор, переделанный из индикатора для МТ4 в индикатор для работы в МТ5. Помимо отображения ценовых каналов на графике, распознает простейшие паттерны - "треугольник" и "флаг". Помогает определить дальнейшее движение цены. Имеет простые и понятные настройки, не нуждающиеся в описании. При переделке под торговый терминал МТ5, были максимально сохранены логика работы и внешний вид исходного индикатора.

Реализует канал на основе индикатора скользящей средней с улучшенным функционалом.
Скользящая средняя, скользящее среднее (англ. Moving average, MA) - общее название для семейства функций, значения которых в каждой точке определения уровне некоторого среднего значения исходной функции за предыдущий период. Канал отсупає вверх и в низ относительно скользящей средней на заданное количество пунктов.
Данный индикатор подойдет для тех, кого интересует классический метод расчета но с улучшенным фун

Реализует осциллятор на основе простого сравнения двух последних значений скользящих средних с улучшенным функционалом. Как результат на графике отображается дельта двух значений скользящих средних. В случае единичного значения скользящей дельта рассчитывается относительно двух последних свечей, какая именно цена сравнения будет указано в параметре Price. Дельта двух значений часто используется для определения тренда в зависимости от длинны скользящих средних может идти речь о более длинном или

Реализует канал на основе интегрированного сравнения значений скользящих средних с улучшенным функционалом. Как результат на графике отображается канал из дельт значений скользящих средних в центральной линии и отступом границ канала по заданному диапазону.
Что же представляет из себя канал? Это и есть диапазон цены (ограниченный), в котором и происходит вся ее динамика (движение) на протяжении некого времени. Данный метод является очень старым, канальная стратегия Форекс берет свое начало из
Скользящая средняя, скользящее среднее (англ. Moving average, MA) - общее название для семейства функций, значения которых в каждой точке определения уровне некоторого среднего значения исходной функции за предыдущий период.
Данный индикатор подойдет для тех, кого интересует классический метод расчета но с улучшенным функционалом. Существует версия как для MT4 так для MT5.
Скользящие средние обычно используются данным временных рядов для сглаживания краткосрочных колебаний и выделение основны

This indicator is an oscillators that shows the real strength of 8 main currencies in the Forex market. It recreates a basket of the main currencies and applied a True Strength Indicator on each of them. The calculated real currencies are: EUR - USD - GBP - CHF - JPY - AUD - CAD - NZD. It clearly identifies overbought and oversold ares. From reading the oscillator you can choose the right Forex symbol to trade.
Future versions: I am working on adding alarm and a real buy sell signal, choosin
MetaTrader Маркет - единственный магазин, где можно скачать демоверсию торгового робота и подвергнуть его проверке и даже оптимизации на исторических данных.
Прочитайте описание и отзывы других покупателей на заинтересовавший вас продукт, скачайте его прямо в терминал и узнайте, как протестировать торгового робота перед покупкой. Только у нас вы можете получить представление о программе, не заплатив за неё.
Вы упускаете торговые возможности:
- Бесплатные приложения для трейдинга
- 8 000+ сигналов для копирования
- Экономические новости для анализа финансовых рынков
Регистрация
Вход
Если у вас нет учетной записи, зарегистрируйтесь
Для авторизации и пользования сайтом MQL5.com необходимо разрешить использование файлов Сookie.
Пожалуйста, включите в вашем браузере данную настройку, иначе вы не сможете авторизоваться.