Смотри обучающее видео по маркету на YouTube
Как купить торгового робота или индикатор
Запусти робота на
виртуальном хостинге
виртуальном хостинге
Протестируй индикатор/робота перед покупкой
Хочешь зарабатывать в Маркете?
Как подать продукт, чтобы его покупали
Платные технические индикаторы для MetaTrader 5 - 38
The Traders Dynamic Index indicator is the only technical indicator you need to scalp the market successfully. The TDI is the only technical indicator that can read the market sentiment, market volatility, and momentum at the same time. The advantage of combining the qualities of several indicators into one indicator is that it can be the “holy grail” you are looking for. Let’s break down the Traders Dynamic Index indicator and go through it a little bit. As you can see, this scalping indicator

Distinctive это трендовый стрелочный индикатор форекс для определения потенциальный точек входа. Нравится он, прежде всего, тем, что в нём заложен простой механизм работы, адаптация ко всем временным периодам и торговым тактикам. СОздан на основе канала регрессии с фильрами. Отображаем сигналы индикатора Lawrence на графике функции цены используя математический подход.
Принцип работы - при пробитии цены в зоне перекупленности/перепроданности (уровней канала) генерируется сигнал на покупку ил
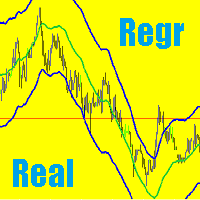
Реализация канала регрессии на МetaТrader 5, с реальным остаточным изображением линий. Сам канал регрессии состоит из двух линий, равноудалённых сверху и снизу от линии тренда регрессии. Расстояние между границами канала и линией регрессии равно значению отклонения максимальной цены закрытия от линии регрессии, только это определение соответствует самим свежым точкам регресии. Как все замечали, линии канала регресии с каждым баром перерисовываются, актуальными остаются только самые свежые точки,
Unlike a standard moving average, trendy traders unique algorithm will show you a less choppy signal resulting in a smoother and easier trend to follow thereby making your trading decisions more confident. Put simply when price moves above the average it signals a bullish trend and when price moves below the average it signals a bearish trend. The trader is then given 2 levels of take profit and a stop loss on each new signal. It can also be added to other trend-following systems for better pe

Этот индикатор на панели инструментов зоны спроса и предложения с несколькими временными рамками и несколькими символами отправляет предупреждения, когда цена достигает зоны спроса / предложения. Также можно использовать его для предупреждения об обычных двойных вершинах / основаниях вместо зон. Его можно использовать на всех таймфреймах от M1 до MN. Одновременно на панели управления может отображаться не более 9 таймфреймов. Можно использовать фильтры RSI, дивергенции (MACD, RSI или Awe

Тестирование на истории и оптимизация со скоростью
Индикатор Impulse Pro — это сильный индикатор Фибоначчи, предназначенный для построения анализа Фибоначчи по нескольким таймфреймам на одном графике.
с функцией оповещения
Коды оптимизированы для более быстрого тестирования и оптимизации как на MT4, так и на MT5. В обоих направлениях можно торговать или анализировать, например.
Импульсный сигнал на покупку можно торговать в противоположном направлении, как и на продажу.
Импульс сигнал

Технический индикатор Фильтр рыночного шума (Market Noise Filter, MNF) показывает канал волатильности цен. Чем ниже волатильность, тем уже канал. Горизонтальные участки канала означают флетовое или шумовое движение цены для рассчитанного уровня волатильности. Все изменения цен происходят внутри канала, где нижняя граница работает как линия поддержки, а верхняя - как линия сопротивления". Если цена выходит за горизонтальную границу, это означает увеличение волатильности и часто начало нового тре

Индикатор кумулятивной дельты Как считает большинство трейдеров, цена движется под давление рыночных покупок или продаж. Когда кто-то выкупает стоящий в стакане оффер, то сделка проходит как "покупка". Если же кто-то наливает в стоящий в стакане бид - сделка идет с направлением "продажа". Дельта - это разница между покупками и продажами. А кумулятивная дельта - разница между покупками и продажами накопленным итогом за определенный период времени. Она позволяет видеть, кто в настоящий момент конт

Индикатор для графического анализа. Отмечает на графике основные комбинации японских свечей. На текущий момент трейдеру доступны следующий набор паттернов: - Bearish/Bullish Abandoned Baby; - Bearish Advance Block; - Bearish Deliberation; - Bearish/Bullish Belt Hold; - Bearish/Bullish Engulfing; - Bearish Shooting Star; - Bearish Evening Star; - Bearish Evening Doji Star; - Bearish/Bullish Doji Star; - Bearish/Bullish Tri-Star; - Bearish Hanging Man; - Bearish/Bullish Harami; - B
[ MT4 Version ] How to trade using the Fear and Greed Indicator: Click here Uncertain about when to take total or partial profits? The Fear and Greed is your reliable companion for making confident trading decisions. This innovative tool offers unparalleled insights into market sentiment, helping you identify key pivot zones and optimize your trading strategy. Why Choose Fear and Greed? Revolutionary Market Insight: Sentiment Analysis: The first indicator for that reveals the market's Fea

the indicator will show signal arrows on the graph at the crossing of Awesome Oscillator base level it has push and audible alerts and Email alert. By crossing above base level , a blue arrow will come out for the BUY, at the same time an audible signal will sound. By crossing Below base level, a red arrow will come out for the SELL, at the same time an audible signal will sound. Possibility to deactivate push and audible alerts.
MT4 version : Buy the 'Awesome cross' Technical Indicator for

There are no limits!
Golden Limit is the ultimate indicator to get clear and easy readings of price movements on charts. It projects support and resistance ranges, calculated by statistical models involving Price Action and the Fibonacci sequence, revealing in advance the behavior of prices and the best places to trade and not to trade. It also has two moving averages to help choose the best entries. The Golden Limit method was created from a proven model. In summary: We use the names of preci

Индикатор "Tiger" показывает развороты рынка. Основан на индексе относительной бодрости (RVI).
Представлен в виде осциллятора, который показывает энергию текущего ценового движения и отражает уверенность ценового движения от цены открытия к цене закрытия в диапазоне максимальных и минимальных цен за данный период. Это, в свою очередь, даёт трейдеру возможность находить точки разворота с большой вероятностью.
Не перерисовывает!
Хорошо показывает себя на боковом движении рынка, которое п
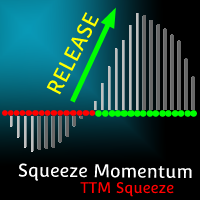
MT4 Version TTM Squeeze Momentum TTM Squeeze Momentum is an enhanced indicator ideal for recognizing consolidation periods in the market and the start of the next explosive move. This improved version is a volatility indicator based on John Carter's "TTM Squeeze" in which the histogram is based on a linear regression rather than a simple momentum indicator. Red dots on the middle line indicate that the market has entered a "Squeeze" zone or consolidation period, indicated in this enhanced versio

Brief description The ContiStat indicator calculate statistic frequency of green (up) and red (down) movement in the chart and determine movement dynamics (silver curve). There are two key parameters to understand the ContiStat principle: Block height and Block count . The ContiStat engine convert instrument price chart move to Blocks of constant height (price) regardles of how much time it take. Example 1: Block height is set to 50. DE30 index price make move from 15230 to 15443 in an hour. 4 g

Created by trader and journalist Larry Williams, Setup 9.1 is a simple strategy that is easy to understand and execute, which is why it is so well known and popular in the world of traders and technical analysis. It is a REVERSION setup, where operations are sought when the moving average changes direction.
Setup Logic
With the open candlestick chart, at any time chart, it is only necessary to add the 9-period Exponential Moving Average (MME9). That done, we look for assets in which the MME
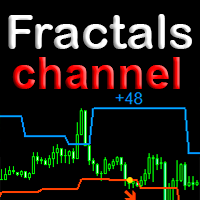
Трендовый индикатор с уникальным алгоритмом определения смены тренда. Для определения тренда использует Price Action и собственный алгоритм фильтрации. В основе алгорима используется ценовой канал по фракталам графика. Такой подход помогает точно определять точки входа и текущий тренд на любом таймфрейме. Без задержек распознать новый зарождающийся тренд с меньшим количеством ложных срабатываний. Особенности
Преимущество индикатора заключается в том, что его период динамический. Так как привяза

DESVIO DE MARCON (Desvio Dinâmico de VWAP) O Desvio de Marcon é um indicador desenvolvido com o intuito de fornecer ao TRADER uma ferramenta capaz de antecipar pontos relevantes de suporte e resistência através de canais de desvios de VWAP traçados no gráfico. Mas qual a diferença entre o Desvio de Marcon e os canais de desvio padrão da VWAP já existentes? O Desvio de Marcon utiliza um algoritmo estatístico desenvolvido por Luiz Antonio de Sousa Marcon, que lhe dá a capacidade de se auto calib

Info: marcobarbosabots
Pivot lines are an easy way to see market trend. The indicator provides the pivot line and three first support and Resistance lines.
Calculations used was:
Resistance 3 = High + 2*(Pivot - Low) Resistance 2 = Pivot + (R1 - S1) Resistance 1 = 2 * Pivot - Low Pivot point = ( High + Close + Low )/3 Suport 1 = 2 * Pivot - High Suport 2 = Pivot - (R1 - S1) Suport 3 = Low - 2*(High - Pivot)
You can use the calculated values on an EA too, just make sure the indicator

The Qv² Trend is an indicator that aims to identify trends.
Buying trend signals are indicated by arrows pointing up.
Selling trend signals are indicated by arrows pointing down.
It can be used in all deadlines.
It can be used in all pairs.
I use it on the H1 with a period of 24. Important Recommendation: Make sure you trade in trend market. Good Trades, in trend market
DeepL Translation - онлайн-перевод
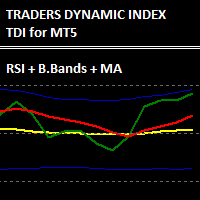
Traders Dynamic Index - это комбинация нескольких индикаторов в сложный набор сигналов, которые можно интерпретировать для поведения рынка.
Он объединяет RSI, полосы Боллинджера и скользящую среднюю. Впервые разработанный Дином Мэлоуном, он получил широкое распространение, поскольку объединяет часто используемые стратегии в одном индикаторе.
RSI определяет фазу перекупленности или перепроданности для инструмента, которая сглаживается и фильтруется MA
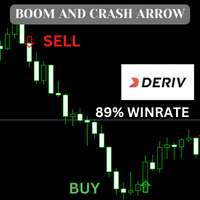
This indicator is based on an advanced strategy primarily for trading spikes on Boom and Crash Indices. Complex algorithms were implanted to detect high probability entries only. It alerts on potential Buy and Sell entries. To trade spikes on the Deriv or Binary broker, only take Buy Boom and Sell Cash alerts. It was optimized for 5-minute timeframe. the indicator will tell you were to sell and buy its good for boom and crash and currency pairs ,EURUSD ,GBPUSD,NAS100, 89% no repaint Feature
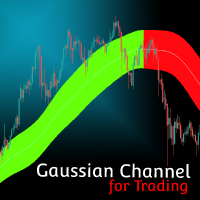
MT4 Version Gaussian Channel MT5 Gaussian Channel MT5 is the first indicator in the market that uses Ehlers Gaussian Filter methods to define trends. Nowadays, this Gaussian Channel is highly known as a method to support HOLD techniques in crypto. If the price is above the channel the trend is strong, if it comes back to the channel this can react as a resistance and indicate the beginning of a bear market (or Winter) if the price breaks below it. Eventhough the use of this channel focuses on hi

Bella - один из наиболее популярных индикаторов, который позволяет своевременно определить разворот тренда, получить раннюю точку входа и точно определить место фиксации прибыли. Индикатор Bella реализует главную идею трейденра и генерирует точку входа в рынок в сторону тренда.
Bella используется при наличии дополнительных индикаторов. Для фильтрации таких сигналов можно использовать этот же индикатор на более старших таймфреймах. Таким образом усовершенствуется работа с индикатором, при этом
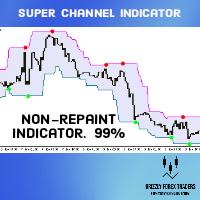
Super Signals Channel Indicator Its channel is a non-repaint indicator that reacts more with recent price movements. For this reason, the Super Signals Channel Indicator is a better match for short-term or day trading strategy. The Super Signals Channel only plots swing trading opportunities. So most of its trade signals appear during consolidation or sidelined periods of the market. Super Signals Channel Indicator for MT5 Explanation The green band below the price shows the dynamic support le
MT4 Version
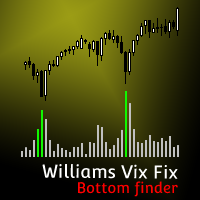
Williams Vix Fix MT5 Need help trying to time the bottoms in the market? Williams Vix Fix MT5 is based on the volatility of the market and grants a huge support for finding out when a correction is comming to its end. TRY IT FOR FREE NOW! Williams Vix Fix MT5 derivates from Larry Williams's VixFix indicator addapted for fitting every asset class . VIX reprensents the fear and greed in the market based on its volatility. A high VIX value shows fear in the market, this is usually a g

Your Pointer - это не обычный форекс канал. Этот коридор выстраивается на основании анализа нескольких свечей, начиная от последней, в результате чего определяются экстремумы исследуемого промежутка. Именно они и создают линии канала. Он как и все каналы имеет среднюю линию а также линию максимума и минимума. Этот канал стоит внимания из-за своего необычного поведения. Применение индикатора Your Pointer позволяет трейдеру вовремя отреагировать на выход цены за границы установленного для нее кан

Я хочу еще раз, что свет клином на всех индикаторов не сошелся. Как бы вы упорно не искали, вы все равно не найдете индикатор, который всегда и во всех условиях будет вам давать исключительно прибыльные сигналы. Как вы видите, все достаточно просто, и вам даже по сути, ничего и анализировать не надо. В целом, я бы сказал, что индикатор Signal No Problem может стать прекрасной помощью для создания своей торговой системы. Само собой, что только лишь по стрелочкам торговать не надо, добавить какие

Фундаментальный технический индикатор,который позволяет дать оценку текущей рыночной ситуации,чтобы в войти в рынок выбранной валютной пары в тренд и с минимальным риском.
Данный индикатор был создан на основе оригинальных индикаторов поиска экстремумов, индикатор хорошо подходит для определения разворота или большого резкого рывка в одну из сторон благодаря ему вы будете знать когда такое произойдет он вас уведомит появлением точки синего цвета на покупку красного на продажу.
Использует в
KF CROSS 3MA
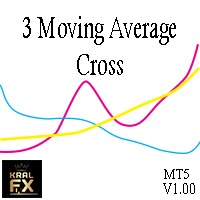
This indicator show the collision points of moving averages in a separate window. so we will have a solitude chart. Features indicator: Show alert in Meta Trade Send notification to mobile Adjustable 3 MA (Fast-Middle-Slow) Can be used on all symbols Can be used in all time frames
Attention, the application does not work in the strategy tester
You can download the Demo version on the comments page : https://www.mql5.com/en/market/product/81152?source=Site
or cotact us : ht
Calculated Trend - трендовый индикатор создает вдоль графика двухцветные точки соединенные между собой линиями. Это трендовый индикатор, представляет из себя алгоритмический индикатор. Прост в работе и понимании при появлении синего кружка необходимо покупать, при появлении красного - продавать. Индикатор хорошо указывает точки начала тренда и его завершения или разворота. Работа на валютном рынке Форекс без трендовых индикаторов практически не возможна. Приминяя в работе индикатор Calculated T

Indicator basic idea is buy strong currency and sell weak currency. If A/B currency pair is in an uptrend, it shows if it is due to A strength or B weakness.On these signals one can choose the most optimal pair to trade. You can use Currency Power System for pattern trading as well, among basic patterns which can be used are: cross trend break divergencies So much for theory. I searched for a ready-made indicator (Currency Strength) to support my trade but did not find one. Well. I have to wr

Перед вами индикатор, который совершит революцию в торговле синтетическими индексами BOOM на торговой платформе Deriv mt5.
Бог Спайк Бум .
Основные характеристики:
Работает только в индексах BOOM. Есть трендовый фильтр. Отправляйте оповещения только тогда, когда рынок растет. Звуковые оповещения. Вы можете отправлять оповещения на мобильный.
Как пользоваться:
Применять во временных диапазонах m1 и m5. Дождитесь звукового оповещения. Проанализируйте, есть ли сильный тренд или
Основная цель данного индикатора это определение моментов входов и выходов из сделок, поэтому индикатор Calc Revers отображат только линию тренда и точки входа, тоесть отображает показывают места входа в рынок.
Несмотря на всю видимую простоту индикатора, внутри у него сложные аналитические алгоритмы, при помощи которых система определяет моменты входов. Индикатор дает точные и своевременные сигналы на вход и на выход из сделки, которые появляются на текущей свече.
Пользоваться индикат

An customize Indicator by which you can have Triple moving averages at close prices and send push notification on each crossing. This indicator is especially useful when you are doing manual trading. Notes: Cation: forex trading is a very risky business,... don't invest the money you cannot bear to lose. the probability of losing is high ... more high aaaand exponentially high.... something like EMA enjoy losing with us...

The Outside The Box (OTB) is a complete trading system that provides the user with immense trading ability by highlighting on the chart areas where the trader should prepare to Re-enter the trend after pullbacks (Pullback trading strategy) Take partial/complete profit(Profit taking strategy), and Trade breakouts (Stock breakout strategy) - We have updated the indicator to show/hide Micro breakout areas around the major breakouts (Micro Breakouts). The above is supported by an alert system to no

Indicador que calcula o volume real e a porcentagem da agressão vencedora num determinado período de tempo. Podendo o usuário escolher entre as opções : 3 vezes por segundo ; 2 vezes por segundo ; 1 vez por segundo ; 1 vez a cada 2 segundos ; Exemplo 1: Se o usuário optar pela opção 2 vezes por segundo, o indicador vai mostrar na tela 2 vezes em um segundo a quantidade de contratos negociados (volume real) e quantos por cento a agressão vencedora foi superior a perdedora nesse período. Ou seja,

This is a multi-symbol and multi-timeframe table-based indicator designed for a candlestick patterns detection with 46 patterns for META TRADER 5. Each formation has own image for easier recognition. Here you find most popular formations such as "Engulfing", "Hammer", "Three Line Strike", "Piercing" or Doji - like candles. Check my full list of patterns on my screenshots below. Also you can not only switch all bearish or bullish patterns from input, but also select formation for a specified symb

Интеллектуальный алгоритм индикатора Godfather с точностью определяет тренд, отфильтровывает рыночный шум и генерирует входные сигналы и уровни выхода. Индикатор поможет в поиске точек входа при анализе графика цены. Программа сначала получает «снимок» графика, затем анализирует его. Результаты сообщаются трейдеру в виде сигналов. Основная цель данного индикатора это определение моментов входов и выходов из сделок, поэтому индикатор отображает только линию тренда и точки входа, тоесть отображае

Основное применение индикатора Rwanda заключается в генерации сигналов на покупку и продажу. Отображает сигналы индикатор Rwanda на графике функции цены используя математический подход. Индикатор определяет долгосрочный и краткосрочный тренд. Наилучший результат дает сочетание индикатора с фундаментальными новостями, он может выступать в качестве фильтра новостей, то есть показывать насколько реагирует рынок на ту или иную новость.
При помощи этого индикатора можно прогнозировать будущие зна
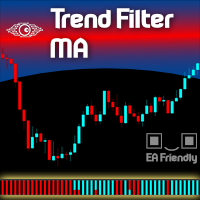
One of the best tools category for an Expert Advisor is the Filtering System . Using a filter on your entries will take your metrics to the good side. And even when you trade manually a filtering system is more than welcome. Let us present a commonly used filtering system based on Exponential Moving Averages - in fact, you can choose the type of the MAs as you wish and also mix them all up - we called this indicator Filter Trend MA . We present this indicator as a colored strip you can use at th

Основной целью индикатора Deathly является оценка рынка. Красные точки указывают на то, что в приоритете должно быть открытие позиций на SELL. Синий цвет говорит том, что настало время для сделок на BUY. Пользоваться индикатором очень удобно и легко. Индикатор является универсальным. Его применяются на любых временных интервалах. Использовать индикатор можно для торговли разными активами. Инструмент прекрасно подходит для торговли на Forex. Его активно применяют для трейдинга на сырьевых, товар

С помощью алгоритма форекс индикатора Elephant, вы можете достаточно быстро понять, какая именно тенденция в данный момент развивается на рынке. Индикатор указывает на графике основную тенденцию в текущий момент на рынке. Смена направления, с точки зрения рыночного фундамента, означает смещение торгового интереса в сторону продавцов или покупателей.
Если не учитывать спекулятивные броски, которые в результате не сказываются на общем тренде, то моменту реального «перелома» всегда предшествует

Преимущество работы по сигнальному индикатору Special Agent заключается в том, что трейдеру не нужно самостоятельно проводить технический анализ графика. Определение рыночного тренда является важной задачей трейдеров, а инструмент выдает уже готовые сигналы в виде направленных стрелок. Данный инструмент является стрелочным (сигнальным).
Special Agent это индикатор тренда, инструмент для технического анализа, который помогает определить точное направление тренда: или восходящее, или нисходящ

Прекрасно дополнит актуальной информацией ваш работающий советник или торговлю вручную.
Предусмотрено звуковое оповещение превышения установленных лимитов прибыли и убытка открытых ордеров SELL и BUY. Причем для каждой валютной пары EURUSD, GBPUSD, XAUUSD, и остальных выводятся различные звуковые оповещения на английском языке.
Показатели выводятся на специальной панели на графике с момента активации индикатора: Прошедшее время Накопленная прибыль
Текущая прибыль Максимальная просадка Текуща

Индикатор Bridge отображает на графике сигналами потенциальные точки на вход (точки абсолютного разворота по тренду).
Алгоритм форекс индикатор Bridge был создан на основе оригинальных индикаторов поиска экстремумов, индикатор хорошо подходит для определения разворота или большого резкого рывка в одну из сторон благодаря ему вы будете знать когда такое произойдет он вас уведомит появлением точки синего цвета на покупку красного на продажу. Индикатор по определенному алгоритму квалифицирует на
New to Binary Options Trading? You are not able to win while trading binary options? Need help with your trading? You have come to the right place! This indicator provides Put (SELL) and Call (BUY) signals for binary options on the M1-M15 timeframes.
Advantages Ability to easily recognize impulsive moves. Effective and flexible combination to different trading strategies. Advanced statistics calculation following the entry point. Signals strictly on the close of a bar. Works in all symbols and

MT4 Version MA Ribbon MT5 MA Ribbon is an enhanced indicator with 8 moving averages of increasing periods. MA Ribbon is useful to recognize trend direction, reversals and continuation points in the market as well as potential entry, partial take profit and exit points. Entry points for long and shorts position can be found when the price entries or leaves the Ribbon, at retest or a defined number of MA crossovers. It offers a good combination with mostly any volume or momentun indicators to
This indicator is based on the same famous fractal indicator with a slight difference:
MetaTrader version 4 click here
Advantages:
Works on all instruments and time series,
Does not redraw its results,
Comparison depth is adjustable,
Works well with any popular strategy,
Adjust the power of fractals
Input settings:
Number of comparisons - The number of candles that each side selects for comparison.
Marker distance from the candlestick
You

This is an advanced Trend Indicator, specifically designed to detect market trends, This MT5 indicator can be used on any symbol . It draws two types of Clouds Buyers & Sellers. A New Trend is then plotted in a break from an older trend. This Powerful indicator is an excellent tool for scalpers or swing Traders. it does not redraw nor Repaint, it's Most reliable when applied on higher timeframes... Tried and Tested on Volatility 75 Index https://t.me/ToyBoyLane
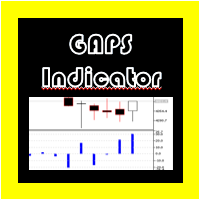
Индикатор GAPS для Метатрейдера 5
Для некоторых стратегий, используемых в индексах, акциях и других активах, обычно измеряется GAP каждой свечи, но если мы хотим сделать это вручную, это может привести к ошибкам в расчетах.
По этой причине был создан «Индикатор GAP», который автоматически показывает значение PIPS каждого из GAPS, представленных между каждой из свечей, и генерирует сигнал тревоги при их появлении, если опция активирована.

(Автоперевод) Большинству трейдеров известен знаменитый японский индикатор Хейкин-Аши , созданный в 1700-х годах Мунехисой Хоммой . Иногда его пишут Heiken-Ashi , но его значение остается прежним, а именно «средний бар» по-японски. Это реализация очень известного индикатора Heikin Ashi , но с несколькими дополнительными функциями. Во-первых, он позволяет взвешивать его значения по объему , будь то объем тиков , реальный объем или псевдообъем на основе истинного диапазона. Основное преимущество з

MT4 Version Wave Trend MT5 Wave Trend is an oscillator, which helps identifing in a extremely accurate manner market reversals. The Oscillator being obove the overbought level and a cross down of the fast into the slow MA usually indicates a good SELL signal. If the oscillators is below the oversold level and the fast MA crosses over the slower MA usually highlights a good BUY signal. The Wave Trend indicator can be also used when divergences appear against the price, indicating the current move

This indicator simplifies your entry zones by displaying the areas where you can plan your entry that potentially could give you high risk/reward ratios. Other than picking the most optimal entry points, the Hot Zone indicator can act as your typical support/resistance indicator for pullbacks for all timeframes. You can use this indicator as the only trading indicator or use it with another indicator for reentry purposes. Besides, when using Hot Zones, the risk/reward ratio should be well abov

Ронал Кутрим в течение 14 лет был увлеченным математиком с более чем 10-летним опытом работы на финансовом рынке.
Концепция теории проста - найти дисбаланс между покупателями и продавцами. В этом есть большой смысл, потому что ничто не растет вечно, ничто не падает вечно. Когда вы находите актив с математической вероятностью неравновесного равновесия, это отличный способ заняться трейдингом: Включите субтитры, видео сопровождается субтитрами

Indicator that shows you at any time the current number of closed deals as well as profit and loss totals of the closed deals of the account that you're logged into for a configurable period.
To do this, it is best to load Deals and "Complete history" in the account history in the terminal and then enter the desired period in the indicator (e.g. 2022.01.01-2023.01.01 would be for calendar year 2022).
Input options:
- Period (Attention: corresponding data must be loaded into the account h
This indicator is based on ParabolicSAR. This indicator does not change the trend easily and does not change the trend until it receives a clause and approval. This indicator can be used for trail stop or trend detection.
MT4 Version
benefits:
Works on all instruments and time series,
Does not redraw its results,
Comparison depth is adjustable,
Works well with any popular strategy,
The power of the areas is adjustable,
We assure you that we we
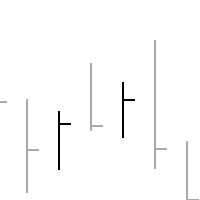
Данный индикатор выполняет единственную задачу - отображает график в виде HLC-баров (бары без цен открытия). Также данные бары имеют две особенности: цвет бара определяется путем сравнения цены закрытия текущего бара с ценой закрытия предыдущего бара, таким образом не происходит путаницы из-за ценовых разрывов (гэпов). Пример подобной ситуации показан на скриншотах (стандартные свечи сравниваются с представленными барами); цвета баров и их толщину можно редактировать.

Hello Traders
I have created this indicator to Catch SPIKES on Crash1000, Crash500 and Crash300. Follow the below mention instruction for better Result
1. When Red arrow pop up on the Chart, Take a Sell entry
2. Stay in trade until price break below from entry
3. Do not hold trades after all trades went in Blue
4. Keep adding position until spike cross below from intial entry
See Example for more assistance

Индикатор помогает зайти в сделку по тренду, при этом, после некоторой коррекции. Он находит сильные трендовые движения валютной пары на заданном количестве баров, а также находит уровни коррекции к этому тренду. Если тренд достаточно сильный, а коррекция становится равной заданной в параметрах, то индикатор сигнализирует об этом. Можно устанавливать разные значения коррекции, лучше подходят значения 38, 50 и 62 (уровни Фибоначчи). Кроме этого, можно настраивать минимальную длину тренда, колич

Система для визуализации популярных шаблонов ценовых формаций. После подключения индикатор автоматически отобразит на графике следующие формации: Пиноккио бар (“пинбар”) - свеча с небольшим телом и длинным “носом”, очень известный разворотный шаблон; Внутренний бар - свеча, диапазон которой лежит внутри диапазона предыдущей свечи. Такая формация представляет неопределённость рынка; Внешний бар - свеча, диапазон которой превышает диапазон предыдущей свечи. Такая формация представляет неопре

This simple, yet powerful indicator is very good way to determine actual S/R levels. It's main purpose is making your overview on markets much better.It has built-in arrow signal system, which should be used along with MT indicators for best results.Just try it.
Recommended MT indicators to use along:
Bollinger Bands (default) RSI (period 3, levels 10/90)
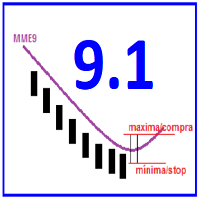
Translate from "Brazil"("PT-BR") Baseado no Setup 9.1 de Larry Williams, Wdi 91 se Adequa a Qualquer Média com o Mesmo Gatilho de Entrada. Experimente.
Como funciona?
Nesse indicador o sinal de compra ou venda acontece quando o fechamento da vela vira a média móvel(Por padrão é MME de 9 períodos) e fica do outro lado da média.
Como usar?
A proposta por Larry Williams é entrar no trade com uma ordem stop um tick acima da máxima do candle com sinal de compra, colocando a ordem de stop loss
Bollinger Band is one if the most useful indicators if used properly. Trend Guard used the parameters based on Bollinger to create a tool that can help traders enter trades at most optimal level. The indicator is useful to all traders since it checks for retracements and changing trend direction. With this indicator, you get the opportunity to open trades early and also lock your profits based on the dotted trend lines that form after a certain level of Bollinger band. We have simplified the ind
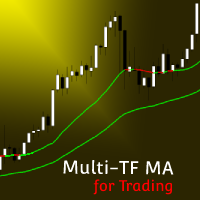
MT4 Version Multi Timeframe MA MT5 Multi Timeframe MA MT5 is an indicator that offers the representation of up to 3 MAs with different Periods and Timeframes. This allows the user to reprensent in one chart and timeframe information coming from other timeframes and get notified as any of the MAs crosses another one. Multi Timeframe MA is the first indicator in the market that offers Multi Timeframe interactions and a high customization level from up to 7 different MA types (SMA, EMA, WMA, Smooth
KT Bollinger Shots works using a striking blend of the slingshot pattern and the mean-reversion phenomenon applied to financial markets.
In addition, a mathematical algorithm is used with variable deviation to fine-tune the indicator's signals on a different level.
Winning Trade: After a signal, if price touches the middle band in profit, it is considered a winner. Losing Trade: After a signal, if price touches the opposite band or touches the middle band in loss, it is considered a loser.

Introduction to Support Resistance Risk Management Support Resistance is the most trusted technical analysis. However, the risk management for the support and resistance is not practiced often. Hence we provide one effective risk managment method for the support and resistance trader. In the book: Scientific Guide To Price Action and Pattern Trading (Wisdom of Trend, Cycle, and Fractal Wave), how to use Support Resistance is described as well as Fibonacci Analysis, Harmonic Pattern, Elliott Wave
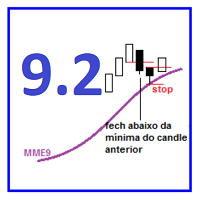
Translate from "Brazil"("PT-BR") Baseado no Setup 9.2 de Larry Williams, Wdi 92 se Adequa a Qualquer Média com o Mesmo Gatilho de Entrada. Experimente.
Como funciona? Nesse indicador o sinal de compra ou venda acontece quando com a continuidade da média móvel(Por padrão é MME de 9 períodos).
Para compra tanto o fechamento quando a abertura da vela precisam estar acima da média, o fechamento precisa ser menor que a mínima anterior e a média precisa estar subindo.
Para venda tanto o fechament
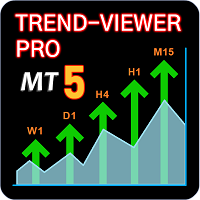
SEE THE TREND ON EVERY TIME FRAME. INTELLIGENT INDICATOR READS PRICE ACTION TO SPOT TRUE MARKET CYCLES AND TREND. This advanced multi-currency and multi-time frame indicator, reads trend in real-time so you always know the trends of the markets you want to trade.
Trend-Viewer Pro has been specifically designed to read the trend of every time frame and every market , simultaneously, making it much easier for you to find markets with time frame correlation , so you can focus on t
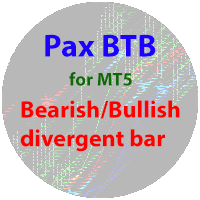
PAX BDB Trade Chaos system of Bill Williams (Bearish/Bullish divergent bar). One of the signals of the "Trade Chaos" system of Bill Williams. (First wiseman)
When bar moving away from the "Alligator" indicator and there is divergence on the Awesome Oscillator indicator, it shows a potential point of movement change.
It is based on the opening/closing of the bar, the position relative to the previous ones, the Alligator and AO.
When trading, the entrance is at the breakthrough of the bar(sh
Узнайте, как легко и просто купить торгового робота в MetaTrader AppStore - магазине приложений для платформы MetaTrader.
Платежная система MQL5.community позволяет проводить оплату с помощью PayPal, банковских карт и популярных платежных систем. Кроме того, настоятельно рекомендуем протестировать торгового робота перед покупкой, чтобы получить более полное представление о нем.
Вы упускаете торговые возможности:
- Бесплатные приложения для трейдинга
- 8 000+ сигналов для копирования
- Экономические новости для анализа финансовых рынков
Регистрация
Вход
Если у вас нет учетной записи, зарегистрируйтесь
Для авторизации и пользования сайтом MQL5.com необходимо разрешить использование файлов Сookie.
Пожалуйста, включите в вашем браузере данную настройку, иначе вы не сможете авторизоваться.