Смотри обучающее видео по маркету на YouTube
Как купить торгового робота или индикатор
Запусти робота на
виртуальном хостинге
виртуальном хостинге
Протестируй индикатор/робота перед покупкой
Хочешь зарабатывать в Маркете?
Как подать продукт, чтобы его покупали
Новые технические индикаторы для MetaTrader 5 - 55

Sinal com base no indicador RSI, que indica compra marcando com uma seta verde quando o preco sai da região de sobrevendido, e sinaliza venda quando o preco sai da regiao de sobrecomprado. A sinalizacão é feita com uma seta verde para compra e seta rosa para venda. Permite configurar o nível de sobrecompra e de sobrevenda, além do período do RSI. Funciona em qualquer período gráfico.

Elliot Waves Analyzer Pro calculates Elliot Waves to Help Identify Trend direction and Entry Levels. Mainly for Swing Trading Strategies. Usually one would open a Position in trend direction for Wave 3 or a Correction for Wave C . This Indicator draws Target Levels for the current and next wave. Most important Rules for Elliot Wave Analysis are verified by the Indicator. The Pro version analyzes Multiple Timeframes and shows the Subwaves and Target-Levels. For an Overview " Elliot Waves Anal

Описание
Bitcoin Manager - лучший индикатор для торговли на криптовалюте Биткоин. Он рассчитывается на базе отклонения цены от канала скользящих средних линий. Восходязие и нисходящие стрелки указывают потенциальные точки и уровни для открытия позиций на покупку и продажу.
Как использовать?
Настоятельно рекомендуем использовать этот индикатор на таймфрейме H1. Стрелка вверх указывает на уровень для покупки. Стрелка вниз - уровень для продажи.
Параметры
Maximum History Bars - максима

Инструмент для торговли бинарными опционами Отличный и надежный помощник в достижении ваших целей, этот инструмент не требует дополнительных фильтров, поскольку уже обладает всем необходимым для успеха на рынке. Отображается в виде свечей под графиком, предоставляя четкие сигналы для торговли бинарными опционами. Основная особенность: Сигнал изменения цвета свечи: Сигналы генерируются на основе изменения цвета свечи при ее открытии. Время экспирации: Экспирация в 2 минут или 2 свечей, в зависим

The indicator measures the accumulated balance of aggression.
The formula is as follows: Accumulated = Previous Candle Accumulated + Purchase Volume - Sales Volume. Know our products
*** Did you like the product? Then, help us doing review in the " Reviews " tab.
The indicator sends information to your email or cell phone when the accumulated balance changes direction. Example : Accumulated seller becomes a buyer.
Note : It is recommended to use the default configuration and VPS

нота: Рекомендуется использовать значения конфигурации и VPS по умолчанию. На Форексе не работает, так как использует флаги TICK_FLAG_BUY, TICK_FLAG_SELL и TICK_FLAG_LAST. Индикатор отображает объемы покупок и продаж на графике. Формируются две строки, соответствующие средним объемам покупки и продажи. Пересечение средних значений, увеличение их расстояния - хорошие индикаторы движения рынка. Параметры: Агрессия Количество дней до текущего для расчета; Разделитель объема e; Включает расчет текущ

Elliot Waves Analyzer calculates Elliot Waves to Help Identify Trend direction and Entry Levels. Mainly for Swing Trading Strategies. Usually one would open a Position in trend direction for Wave 3 or a Correction for Wave C . This Indicator draws Target Levels for the current and next wave. Most important Rules for Elliot Wave Analysis are verified by the Indicator. This free version is limited for Analyzing one Timperiod Waves. Waves are Shown only in PERIOD_H4 and above. Not Useful for Intr
FREE

Индикатор выделяет цветом места на графике, где цена движется в одном направлении непрерывно от выбранного количества свечей. Можно указать количество пунктов от начала движения, чтобы выделять только движения от этого количества. Может быть полезно для поиска разворотов или резких импульсов.
Так же рекомендую приобрести эту утилиту, для определения локальных недельных/месячных трендов и линий поддержек и сопротивлений. https://www.mql5.com/ru/market/product/61401
FREE

The indicator measures the balance of aggression.
The formula is as follows: Aggression = Purchase Volume - Sales Volume.
Note : It is rec ommended to use the default configuration and VPS values. It does not work in Forex.
Meet Our Products
Parameters : Numbers of days prior to the current one for calculation; Volume Divider e; Enables calculation of the current candle; Histogram Line style and; Size; Line Line style and; Size;
Follow us on our website to check the next new

If You Are Discretionary Trader This Tool Is A Must Chart Switcher ------> Linking Multi-Time Frame Charts / Syncing Indicators And Drawings. Main USP Of This Indicator: Is Opening Multi-Time Frame Multiple Charts {Up To 10 Charts} Of A Symbol With Just 1 Click. You Do not Have To Save Any Template As It has Been Save Auto When You Click Same Symbol Or Move To Another Symbol. It Is Divided Into 2 Parts: 1} COMMON MODE and 2} SYMBOL MODE 1} COMMON MODE: Under This Mode, You Can Sync Commo

Anchored VWAP (with no Volume) Уникальное развитие одного из самых полезных индикаторов VWAP. Данный продукт позволяет уйти от использования основы VWAP, а именно от объема. Все рассчитывается без него. Дополнительно разработана удобная система выбора точек старта - перемещая "стартовое поле", Вы указываете скрипту область, в которой следует искать экстремум, от которого будет начинаться расчет. Основные преимущества данной разработки: удобная система выбора точки старта расчета VWAP с помощью и

Upgraded - Stars added to indentify Areas you can scale in to compound on your entry when buying or selling version 2.4 Upgraded Notifications and alerts added version 2.3 *The indicator is suitable for all pairs fromm Deriv pairs (Vix,jump,boom & crash indices) , Currencies, cryptos , stocks(USA100, USA30 ), and metals like gold etc. How does it work?
Increasing the period make it more stable hence will only focus on important entry points However lowering the period will mean the indica

Profit Loss Meter For the serious trader this fun easy to use indicator allows you to measure Profit and Loss of current, closed or future trades on your forex account chart. It measures Currency Pairs And Indices plus estimates margin levels at the trade close point. The Profit/Loss indicator is based on MT5 native Crosshair instrument. TO ACTIVATED USE "HOT KEYS" ctrl+f just as you would for activating the Crosshair. left click and hold then drag in the direction in which you would like to m

Добрый день. Сегодня добавили вспомогательный индикатор тренда DveMashkiTompson, идея взята из аналога МТ4 и перенесена на МТ5, используется совместно с индикаторами Тренда ТМА и МА, рисует красные и зеленые области в зависимости от направления рынка. Тренд вверх -зеленые области, тренд вниз -красные.Области основываются на пересечении индикатора МА, таким образом данный индикатор дает информацию графического содержания для более быстрой оценки ситуации и принятия решения.
FREE

根据高开低收价格确定反转点位,画出的极点折线。 The pole polyline is drawn according to the high opening and low closing price to determine the reversal point.
参数(Args):
1.周期数(Period)。参与界限计算的K柱数量。 2.界限(Divide)。计算方式包括: t1,顺高低价 (Buy min H,Sell max L) t2,逆高低价 (Buy min L,Sell max H) t3,收盘价 (Buy min C,Sell max C) t4,开盘价 (Buy min O,Sell max O) t5,高开低收价的一半 (HOLC/2) t6,高开低收价的一半+1 (HOLC/2+1) t7,高开低收价的一半+2 (HOLC/2+2) 3.跨越界限使用的价格(Price)。包括收盘价(C)和高低价(HL) 4.偏移(

This indicator calculates Correlation among currency pairs (Selected by user) to find the least and/or most correlated symbols in real time. Correlation ranges from -100% to +100%, where -100% represents currencies moving in opposite directions (negative correlation) and +100% represents currencies moving in the same direction.
Note The Correlation more than 80 (Adjustable) between two currency pairs, Shows that they are quite similar in the kind of movement and side. The Correlation less than
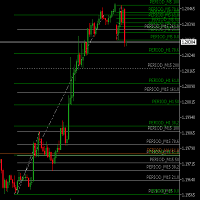
Sets and Updates Fibo-Retracemnet-Levels for Multi Timeframes. Helps to Find TradeZones combined over Multi-Timeframes. M1 M5 M15 H1 H4 D1 are analyzed and shown. Color Changes as soon 161 and 261 Retracements are reached to visualize possible Targets/ TakeProfit Zones . No Settings for Indicator available . Fibonacci retracements are set using a fixed Logic.

Here I present you this awesome indicator I made. This is a nique combination witch puts you in the same level as MM's. So you can surf a lot of waves and identify the rally time, breakouts, and the perfect time to get in the market. ----
The SSL Channel is a great all-rounder based on 2 Simple Moving Averages, one of recent Highs, one of recent Lows. The calculation prints a channel on the chart consisting of 2 lines. This strategy gives a Long signal when price closes above the top of the

Hi-Lo - это индикатор, цель которого - более точно определять тенденции данного актива, указывая, таким образом, на возможное лучшее время для покупки или продажи.
Что такое хай-лоу?
Hi-Lo - это термин, полученный из английского языка, где Hi связано со словом High, а Lo - со словом Low. Это индикатор тренда, используемый для оценки торговли активами на финансовом рынке.
Следовательно, его использование дается для определения того, показывает ли конкретный актив восходящий или понижательн
FREE

Данный индикатор вычисляет формулу MACD для объемо-ориентированных индикаторов Accumulation/Distribution и OnBalance Volumes . Помимо тиковых объемов он поддерживает расчеты со специальными псевдо-реальными объемами, эмулируемыми для символов Форекс, где реальные объемы не известны. Подробности о данных "суррогатных" объемах можно узнать в описании других индикаторов - TrueVolumeSurrogate и OnBalanceVolumeSurrogate (алгоритм последнего используется внутри MACDAD для подготовки значений AD и OBV

Investment Castle Support and Resistance Indicator has the following features: 1. Dictates the direction of Buy or Sell trades based on Support and Resistance Levels automatically . 2. Candles stick colors will change to Red for Sell and Blue for Buy (Default settings, user can change from the inputs). 3. This indicator is built-in the Support & Resistance based Investment Castle EA which works with Psychological Key Levels "Support & Resistance".
FREE

Plucking Machine
Plucking Machine is a trend indicator designed specifically for gold and can also be used on any financial instrument. The indicator does not redraw and does not lag. Recommended time frame H1. The current setting is applicable for all time periods. It shows the current direction of the market based on price movements. Corresponding products of indicators: https://www.mql5.com/zh/market/product/61388?source=Site+Market+Product+Page#description
The brother Indicator :

Plucking Machine I Plucking Machine I is a trend indicator designed specifically for gold and can also be used on any financial instrument. The indicator does not redraw and does not lag. Recommended time frame H1. The current setting is applicable for all time periods. It shows the current direction of the market based on price movements. Corresponding products of indicators: https://www.mql5.com/zh/market/product/61388?source=Site+Market+Product+Page#description

**Инструмент для определения потенциальных точек разворота и направления тренда**
Этот инструмент отлично подходит для выявления возможных точек разворота и направления тренда на рынке. Он хорошо совместим с такими подтверждающими индикаторами, как MACD, Stochastic, RSI - стандартные индикаторы, доступные на всех платформах MT5. Вместе с ними он формирует надежную стратегию. В настройках можно регулировать расстояние и период канала.
Рекомендуется входить в сделку, когда сигнальная линия пе

This is a bufferless indicator which can display classical X and O columns if applied on custom symbol charts built by Point-And-Figure-like generator PointFigureKagiCharts or its DEMO . The indicator will enforce a fixed price-scale on the chart to make sure the marks keep correct aspect ratio. The marks are shown only if the chart time-scale is large enough to hold them in the space allocated per bar (if the horizontal scale is one of 3 smallest ones, the indicator draws nothing and outputs a
FREE

PROMOTIONAL OFFER. NEXT PRICE WOULD BE 125 USD.
HAWA is pleased to introduce Price Action Setup indicator for all symbols with high success rate. It's advanced algorithm finds the spots for you where smart money is moving in or out of the market. Indicator will produce signals with pre-calculated entry and exit levels keeping money management in place. The system aims to achieve small, steady and consistent profits and reduce losses.
Unique Features: High Probability Success rate. Steady p

GIVE A LOOK TO MY OTHER PRODUCTS ! 100 % PER MONTH PROFIT---- MY NEW SIGNAL HERE -------> https://www.mql5.com/en/signals/2162238?source=Site+Signals+My# Double MA Cross Alert,is a cool indicator that notificate you directly on your telephone or email when 2 Moving average ( you choose the parameters ) crosses. This is very important when you want to know a change of trend and you can't stay in front of your pc! The indicator give you the alert just when the next bar opens ,so give you a more

Automatic Fibonacci Tool Fibonacci retracements is a popular instrument used by technical analysts to determine potential Support and Resistance areas. In technical analysis, this tool is created by taking two extreme points (usually a peak and a minimum) on the chart and dividing the vertical distance by the key Fibonacci coefficients equal to 23.6%, 38.2%, 50%, 61.8%, and 100%. Our Automatic Fibonacci Tool is programmed to make thigs easier. Using this tool, there is no need to explicitly set

Advanced Support and Resistance Support and resistance levels are widely used in trading. They are important as they show some key price levels. Before applying any strategy, one may consider it necessary to draw support and resistance. However, this process can take much time especially if one is to analyse a lot of currency pairs, commodities or indices. This Advanced Support and Resistance tool was designed for traders at any level, amateur to professional. It plots key support and resistance

MACD Intraday Trend - это индикатор, разработанный на основе адаптации оригинального MACD, созданного Джеральдом Аппелем в 1960-х годах.
За годы торговли было замечено, что, изменяя параметры MACD с пропорциями Фибоначчи, мы достигаем лучшего представления непрерывности движений тренда, что позволяет более эффективно определять начало и конец ценового тренда.
Благодаря своей эффективности в обнаружении ценовых тенденций, также можно очень четко идентифицировать расхождения вершин и основани
FREE
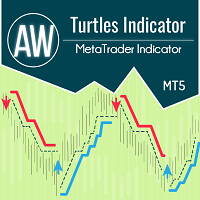
Индикатор работает по системе Черепах и классически предполагает временной интервал 20 и 55 свеч. На заданном временном интервале отслеживается тренд. Вход осуществляется в момент пробоя уровня поддержки или сопротивления. Сигнал выхода – пробой цены в обратном направлении тренда того же временного интервала. Преимущества:
Инструменты: Валютные пары, акции, сырьевые товары, индексы, криптовалюты Таймфрейм: Классически D1, также подходит для работы с любыми таймфреймами Время торговли: круглос
FREE

TOPOS INDICATOR AND HISTORIC BACKGROUNDS The Indicator of historical tops and backgrounds is based on the monthly chart where sharks hide so it was developed to facilitate the identification of these regions. The available features are the Incoming Triggers alerts and notifications that are sent to the mobile phone. Parameters 1-) Tops and Bottoms: You can change the color of the lines and the period in years and the filter range between the top and bottom and the median and consider
FREE
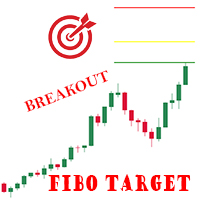
Indicator shows 3 Fibonacci expansion levels, based on the last pivot breakout. Pivots are calculated based on volatility (ATR), works on every Timeframe and Symbol. Lines are displayed only after the pivot breakout. A comment on the upper left side shows the minimum calculated value (in points) for pivots. Parameters: Variation: minimum variation for the pivot. ATR multiplication factor. (default 3) ATR Period: Period for ATR value calculations. (default 60)
Ex.: ATR on TimeFrame H1 = 100po
This indicator is based on the system of three moving averages where: First is the fast average (MA1); Second is the intermediate average (MA2) and; T hird is the slow average (MA3). The theory covered in the technical analysis books informs us that when the first average exceeds the second average it is an alert for the trader, however the movement occurs when the second average exceeds the third. The indicator will insert the check s Parameters : Averages : Period Fast Moving Average(FMA); Smo

KT Candlestick Patterns finds and marks the 24 most dependable Japanese candlestick patterns in real-time. Japanese traders have been using the candlestick patterns to predict the price direction since the 18th century.
It's true that not every candlestick pattern can be equally trusted to predict the price direction reliably. However, when combined with other technical analysis methods like Support and Resistance, they provide an exact and unfolding market situation. KT Candlestick Patterns

FXC iMACD-DivergencE MT5 Indicator
This is an advanced MACD indicator that finds trend-turn divergences on the current symbol. The indicator detects divergence between the MACD and the price movements as a strong trend-turn pattern.
Main features: Advanced divergence settings
Price based on Close, Open or High/Low prices Give Buy/Sell open signals PUSH notifications
E-mail sending Pop-up alert Customizeable Information panel Input parameters: MACD Fast-EMA: The Fast-EMA variable of the MACD

Leave a review for this product, and receive another "Free" product that you choose. You can see my other products here: https://www.mql5.com/en/users/zakri/seller
Harmonic Patterns Detector indicator draws harmonic patterns on chart. Harmonic patterns have a high hit-rate of around 80% and are excellent for trade entries. They are used as price reversal points. Some of them have a long history of usage and were created by famous traders like H. M. Gartley. Many harmonic patterns are included

This indicator displays breakouts on Point-And-Figure-like or Kagi-like custom symbol charts, generated by special expert advisers, such as PointFigureKagiCharts . This indicator is applicable only for custom instruments generated in appropriate way (with time-invariant bars which are multiples of a predefined box size). It makes no sense to apply it to other charts. The breakouts in up or down direction are marked by arrows. The breakout price is found at crossing of one of imaginary lines of
FREE

This indicator is a basic RSI but comes up with a useful feature.
You can set zones within the RSI and these zones can be displayed with different background colours. (You can see on the pictures below) You need to set the zone ranges and their colours at the input parameters. Six different zones can be set.
Should you have any questions or comments, feel free to contact me.
FREE

The patterns of 3 (three) Candles:
Three White Soldiers; Three Black Crows; These are reversal patterns widely used by traders, as they have a high probability of showing the inversion of the current market movement. For example, if in a bullish trend there are three black crows, there is a high probability of reversing the current bullish movement.
The Three White Soldiers have the following characteristics: There are 3 consecutive candles with a good body, that is, the difference between

При анализе финансовых временных рядов исследователи чаще всего делают предварительное допущение о том, что цены распределены по нормальному (гауссовскому) закону. Такой подход обусловлен тем, что с помощью нормального распределения можно моделировать большое число реальных процессов. Кроме того, вычисление параметров этого распределения не представляет больших трудностей. Однако в применении к финансовым рынкам нормальное распределение работает далеко не всегда. Доходности финансовых инструмен

Индикатор IndicateMe был специально создан, чтобы убирать как можно больше шума из сигналов, которые он подает.
Индикатор был объединен с несколькими другими хорошо известными индикаторами. Использованные индикаторы: «Скользящая средняя, стоастический индикатор, индекс относительной силы, скользящая».
Все используемые индикаторы можно настроить самостоятельно. По умолчанию установлены те значения, которые мне нравятся.
Легко настраивайте оповещения, чтобы всегда быть в курсе сигналов

Описание
Money Zones - индикатор, определяющий зоны накопления/распределения на рынке. Зеленые зоны позволяют искать точки входа в покупку или точки выхода из продажи. Красные зоны, напротив, определяют возможность продажи или закрытия покупок. Индикатор имеет возможность определять денежные зоны для двух временных интервалов одновременно на одном графике.
Как использовать?
Используйте этот индикатор, чтобы определить рыночные зоны как зоны поддержки/сопротивления, чтобы определить наилуч

CANDLESTICK_MT5
Очень интересный индикатор свечных паттернов, конвертированный из бесплатной версии индикатора CANDLESTICK для терминала MetaTrader4 в версию для терминала MetaTrader5. Помимо свечных паттернов, он рисует линии поддержки и сопротивления, которые отлично отрабатываются ценой на графике. Может работать на любом таймфрейме. Имеет простые настройки. При конвертировании были максимально сохранены логика работы и дизайн оригинального индикатора CANDLESTICK для терминала МТ4.
FREE

The Market Thermometer can be used to help traders identify sleepy or turbulent periods. It helps beginners to check when is the ideal time to enter operations, that is, when the value of the thermometer is below its average for several periods, identifying a peaceful market. When the market is heated, that is, the thermometer is above three times its average, it is time to make profits. The Thermometer measures the extent to which the end of a period, maximum or minimum price, projects out
FREE
You probably won't see the power of the indicator in the backtest, because it uses 3 windows, something you can't do, in the DEMO version that the site offers. I trust 100% on my work and on my indicator, if you want a test version, send me a message, different from other sellers, who just want to "sell", I want whether you have a full version before renting and deciding. Christmas Discount 30% off until the 25th As you can imagine, it was a failure, I'm not saying that any indicator doesn't w

This indicator displays volume delta (of either tick volume or real volume) encoded in a custom symbol, generated by special expert advisers, such as RenkoFromRealTicks . MetaTrader does not allow negative values in the volumes, this is why we need to encode deltas in a special way, and then use CustomVolumeDelta indicator to decode and display the deltas. This indicator is applicable only for custom instruments generated in appropriate way (with signed volumes encoded). It makes no sense to ap
FREE

The Market Sessions Indicator for MT5 helps you predict market turnarounds by detecting major supply and demand areas. These pivot points tend to occur after a new session has started and the previous one is still open. It is also used to gauge how many points or pips the market moves on average during a session. This helps us to place better our take profits and stop losses. The indicator works on all forex pairs, gold, silver, commodities, stocks, indices and any other instrument that your

GIVE A LOOK TO MY OTHER PRODUCTS ! 100 % PER MONTH PROFIT---- MY NEW SIGNAL HERE -------> https://www.mql5.com/en/signals/2162238?source=Site+Signals+My# MACD Cross Alert is a tool indicator that notificate directly to your phone whenever the signal line crosses the base line. For more accurate signals,crosses are filtered like this : Buy Signal : SIGNAL LINE CROSSES ABOVE BASE LINE AND BOTH ARE ABOVE THE 0 VALUE Sell Signal : SIGNAL LINE CROSSES BELOW BASE LINE AN

GIVE A LOOK TO MY OTHER PRODUCTS ! 100 % PER MONTH PROFIT---- MY NEW SIGNAL HERE -------> https://www.mql5.com/en/signals/2162238?source=Site+Signals+My# Breakout Wall is a very cool indicator. It paints a resistance and a support in the chart given by a " n " number of candles ( you can choose the parameter ),and give you an alert when a candle closes below a support or above a resistance.Very important tool if you trade daily candles for example..... Just close your pc and don'

Trend Line Finder will project forward a support and resistance lines using 2 previous highs for resistance and 2 previous lows for support. It will then signal to the trader by alert making the trader more aware that a possible good move is about to happen. This is not a stand-alone trading system but is very useful in finding key areas of support resistance levels where price will usually either rebound from or breakthrough. Its down to the trader to decide what to do with use of other s
Мультивалютный индикатор в отдельном окне отображает движение валютных пар в пунктах с расхождением от начала дня. Во время работы, динамически возможно включать и отключать различные пары прямо на графике. При первом запуске, возможно, потребуется продолжительное время, пока загрузиться история для основных валютных пар. Для валют CAD, CHF, JPY - график перевернут.
При повторном открытии, все настройки индикатора восстанавливаются автоматически.
FREE
Мультивалютный индикатор в отдельном окне отображает движение валютных пар в пунктах с расхождением от начала дня. Во время работы, динамически возможно включать и отключать различные пары прямо на графике. При первом запуске, возможно, потребуется продолжительное время, пока загрузиться история для основных валютных пар. Расчет всех кроссов происходит на основе мажоров. Для валют CAD, CHF, JPY - график перевернут. При повторном открытии, все настройки индикатора восстанавливаются автоматически.
FREE

Это инновационный индикатор измерения силы валют от INFINITY является незаменимым помощником для скальперов и трейдеров торгующих в долгую.
Система анализа Силы/слабости валют давно известна и применяется на рынке ведущими трейдерами мира. Любая арбитражная торговля не обходится без этого анализа.
Наш индикатор легко определяет силу базовых валют по отношению друг к другу. Он выводит линейные графики по всем или по текущей паре валют, позволяя проводить мгновенный анализ и поиск наиболее силь
Индикатор Channel Forex разработан с учетом экстремальных ценовых значений за определенный период.
Индикатор состоит из трех четко окрашенных линий, которые напоминают полосы Боллинджера.
Основные торговые сигналы
Сигнал на покупку: открывайте длинную позицию, когда цена открывается и закрывается выше средней средней линии индикатора, и торгуется вдоль верхней границы канала.
Сигнал на продажу: открывайте короткую позицию, когда цена открывается и закрывается ниже средней средней синей
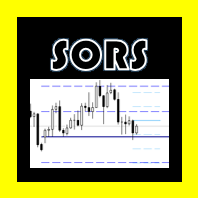
КОМПЛЕКСЫ СОРС (для Metatrader 5)
Этот индикатор предназначен для рисования линий SORS на графике, это современный способ расчета рыночных точек, который он обычно уважает, они состоят из поддержек и сопротивлений, но в отличие от классических, они рассчитываются на основе эндогенной волатильности и стандартного отклонения,
В конфигурации вы можете изменить цвет каждого уровня линейно и скрыть те, которые не нужны.
A = Годовой.
M = Ежемесячно.
W = еженедельно
D = Ежедневно.

RSI ALARM (для Metatrader 5)
Этот индикатор работает как обычный RSI со всеми его настройками (периодичность, цвета, уровни и т. Д.),
но, кроме того, сигналы тревоги могут быть установлены на верхнем и нижнем уровнях (Примеры 70 и 30), с возможностью регулировки этих уровней, перемещая синюю и красную линии, чтобы установить верхний и нижний уровни.
Вы также можете включать и выключать дополнительную функцию, которая создает стрелку на графике при достижении ожидаемого верхнего или нижнег

Индекс Относительного Равновесия, REi — индикатор технического анализа, показывающий направление и силу тенденции и указывающий на вероятность еe смены. Он показывает отношение среднего прироста цены к среднему падению за определенный период времени. Величина индекса позволяет оценить, покупатели или продавцы сильнее влияли на цену за установленный период времени и предположить дальнейшее развитие событий. Индикатор отличается простотой интерпретации и качеством подаваемых сигналов. Точки входа,
FREE

Технический индикатор Trend Strength Analyzer измеряет отклонение цены инструмента от средних значений за определенный период времени. В основе индикатора лежит сравнительный анализ относительной силы быков и медведей. Если быки преобладают, то наблюдается восходящий тренд. Если медведи сильнее - это нисходящий тренд.
Настройки:
Strike Energy (2 сплошные линии) = 14.
Influence Power (2 пунктирные линии) = 50.
Осциллятор TSA эффективен на активном рынке. Наиболее часто используемыми ин
FREE

The Market Thermometer can be used to help traders identify sleepy or turbulent periods.
It helps beginners to check when is the ideal time to enter operations, that is, when the value of the thermometer is below its average for several periods, identifying a peaceful market. When the market is heated, that is, the thermometer is above three times its average, it is time to make profits. The Thermometer measures the extent to which the end of a period, maximum or minimum price, projects outsi
FREE

Leave a review for this product, and receive another "Free" product that you choose. You can see my other products here: https://www.mql5.com/en/users/zakri/seller
Trend Detective is an advanced trend detection indicator which shows accurate entry points in direction of trend. It uses smart technology in order to detect entry points, trend changing points, and TP points. It also shows hit rate for current chart using selected parameters. Hit rate for this indicator on different charts can be
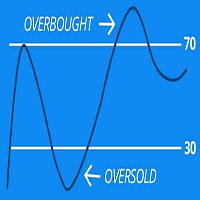
Scan all your favorite pairs with RSI, and get notified on your preferred time frames.
Settings are Customizable
Click to change time frame or open new pairs
Notification: Phone/Popup/Email The relative strength index (RSI) is a technical indicator used in the analysis of financial markets. It is intended to chart the current and historical strength or weakness of a pair/stock based on the closing prices of a recent trading period. The RSI is most typically used on a 14 period, measured on

GIVE A LOOK TO MY OTHER PRODUCTS !
100 % PER MONTH PROFIT---- MY NEW SIGNAL HERE -------> https://www.mql5.com/en/signals/2162238?source=Site+Signals+My# BROKEN TRENDLINE ALERT IS A SIMPLE TOOL INDICATOR. JUST DRAW IN YOUR CHART A DYNAMIC OR STATIC TRENDLINE,AND THE INDICATOR WILL SEND YOU ALERT WHENEVER THE PRICE CROSSES BELOW OR ABOVE YOUR DRAWN TRENDLINE. IT WORKS IN ANY TIMEFRAME AND ANY CHART YOU WANT.JUST GOT A VPS AND DON'T STRESS IN FRONT OF YOUR COMPUTER.
FOR ANY KIND OF QUESTION
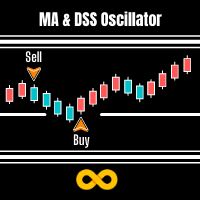
MA & DSS Oscillator is a simple system that overcomes all the market confusion by looking at the Moving Average and Double Smoothed Stochastic Oscillator. A Signal is made when the Oscillator is under 50 (A default value) and heading in same direction as the Moving Average.
The moving average is arguably the simplest but most effective tool when trading larger timeframes. We use this and the Double Smoothed Stochastic Oscillator to time our market entry.
Double Smoothed Stochastic is simila

>>> Comment ajouter des indicateurs personnalisés ou des EA à MT5 <<< > Ouvrez MT5, > allez dans Fichier> Ouvrir le dossier de données, > puis sélectionnez MQL / 5> 'Experts' ou 'Indicateurs' > et collez votre fichier MQL4 / EX4 ou MQL5 / EX5 dans ce dossier.
Lorsque vous redémarrez la plate-forme, vous devriez maintenant voir votre EA / indicateur personnalisé dans la fenêtre du navigateur.
Vous pouvez le faire glisser et le déposer sur le (s) graphique (s) de votre choix.
>>> Pour

Этот индикатор решает проблему масштабирования графика, при котором бар становится слишком тонким и становится трудно определить цены открытия и закрытия бара.
Индикатор Thick Bar - позволит менять толщину линий и цвет обводки, за счет чего можно получить более толстый бар на графике. Индикатор по умолчанию имеет толщину бара равную 2 и предустановленные цвета, которые можно менять в настройках
FREE

Добрый день. Сегодня мы предлагаем индикатор MaxlotTomson для определения максимального объема, который вы можете выставить на покупку или продажу, если смотреть на ваш уровень депозита. Данный индикатор удобно использовать для Новостной торговли, когда нужно определить точку входа на скоростном движении и рассчитать уровень риска в процентах от депозита, Индикатор MaxlotTomson показывает максимальное значение объема ЛОТА для вашего депозита который выы можете использовать для торговли.
FREE

Индикатор определяет состояние рынка: тренд или флэт.
Состояние рынка определяется с учётом волатильности.
Жёлтым цветом отображается флэт(торговый коридор).
Зелёным цветом отображается тренд вверх.
Красным цветом отображается тренд вниз.
Высота метки соответствует волатильности на рынке.
Индикатор не перерисовывается .
Настройки History_Size - размер рассчитываемой истории.
Period_Candles - количество свечей для расчёта индикатора. Send_Sound - звуковое оповещение. Send_Mail

The Supertrend indicator is a very versatile and and accurate trend detection system. It can also be used an an reversal indicator. Therefor you can use it either as entry or as an exit signal. Depending on your settings it is also good for trend confirmation. This version is slightly enhanced from the original version from mladen. The Supertrend of Averages Histogram Version contains: 11 different price options Averaging period
18 different averaging types ATR period and ATR multiplier Shows r
FREE
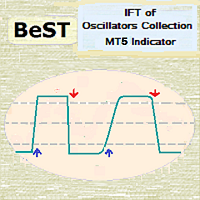
BeST_IFT of Oscillators Collection is a Composite MT4/5 Indicator that is based on the IFT ( Inverse Fisher Transformation ) applied to RSI , CCI , Stochastic and DeMarker Oscillators in order to find the best Entry and Exit points while using these Oscillators in our trading. The IFT was first used by John Ehlers to help clearly define the trigger points while using for this any common Oscillator ( TASC – May 2004 ). All Buy and Sell Signals are derived by the Indicator’s crossings of the Bu
MetaTrader Маркет предлагает каждому разработчику торговых программ простую и удобную площадку для их продажи.
Мы поможем вам с оформлением и подскажем, как подготовить описание продукта для Маркета. Все продаваемые через Маркет программы защищаются дополнительным шифрованием и могут запускаться только на компьютере покупателя. Незаконное копирование исключено.
Вы упускаете торговые возможности:
- Бесплатные приложения для трейдинга
- 8 000+ сигналов для копирования
- Экономические новости для анализа финансовых рынков
Регистрация
Вход
Если у вас нет учетной записи, зарегистрируйтесь
Для авторизации и пользования сайтом MQL5.com необходимо разрешить использование файлов Сookie.
Пожалуйста, включите в вашем браузере данную настройку, иначе вы не сможете авторизоваться.