Смотри обучающее видео по маркету на YouTube
Как купить торгового робота или индикатор
Запусти робота на
виртуальном хостинге
виртуальном хостинге
Протестируй индикатор/робота перед покупкой
Хочешь зарабатывать в Маркете?
Как подать продукт, чтобы его покупали
Новые технические индикаторы для MetaTrader 5 - 57

Phi Cubic Fractals Pack1A with FuTuRe PACK 1A é uma melhoria sobre o Pack 1 que inclui a possibilidade de selecionar as linhas LINE 4/8/17/34/72/144/305/610 individualmente. Este produto contém os indicadores do PACK 1A (Lines + LineSAR + Channels + BTL + Ladder) + MODO FUTURO Phi Lines - medias moveis especiais, semelhantes às MIMAs do Phicube, capazes de indicar com muita clareza tanto a tendencia como a consolidação; Phi LineSAR - apaga ou destaca as Phi Lines para mostrar apenas as linha
Индикатор отображает биржевой график нестандартного вида, в котором цена и время имеют одинаковое значение.
В обычном графике японских свечей не учитывается вся информация, которую может дать анализ времени. В графиках Ренко не используется весь объем информации, который может дать цена в соотношении с временем. Индикатор "Chart Price and Time" в равной степени учитывает цену и время и показывает преобладание цены или времени.
Учёт в равной степени цены и времени даёт представление о скор
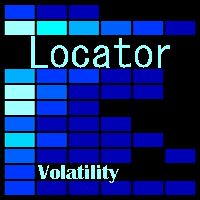
Индикатор отслеживает резкую волатильность (моменты, в которые рынок проявил повышенную активность и может зародиться движение), н а выбранных инструментах и временных периодах.
Информация отображается в виде цветных прямоугольников. Таким образом, можно одним взглядом оценить, какому инструменту стоит уделить первостепенное внимание.
Индикатор окажется полезен "скальперам", когда нужна быстрая реакция или трейдерам, работающим с большим количеством инструментов.
Индикатор не перерисовывае

VJ Sniper - MT5 Buy / Sell Indicator: This Indicator is as simple as Buy in Up Trend & Sell in Down Trend. There are Support / Resistance Graphic levels for choosing the best Entries. Background: Any in-built indicator of MT5 does not work as stand alone such as Stochastic, CCI or DeMarker etc. But combination of them with trend projection work & give the best results for Trading entries. So this Indicator is blended to give the best

Индикатор выводит на график размер спреда по текущему инструменту. Очень гибок в настройках. Есть возможность задать максимальное значение спреда, по превышении которого, сменится цвет надписи спреда, и прозвучит сигнал (если включено в настройках). Индикатор будет очень удобен людям, которые торгуют на новостях. Вы никогда не войдете в сделку с большим спредом, так как индикатор вас об этом уведомит как визуально так и звуком. Входные параметры: AlerT - true - включен звуковой сигнал при превыш
FREE

"2nd To NoneFX Scalper" is one powerful indicator which you can use on any timeframe. The accuracy is in between 90% - 95% can be more. The indicator is 100% non repaint so it doesn't repaint at all. When the arrow comes out wait for the candlestick to close the arrow won't repaint/recalculate or move. The indicator works with all volatility indices,step index, Boom & Crash(500 & 1000) and all currency pairs. You can change settings of the indicator. For great results find the trend of the pair,

This indicator saves the chart as a template when you change the symbol. It also loads the template from the new symbol. Therefore you are able to save all objects that you have drawn on the chart. It is an addition to the Watchlist Indicator.
How to use it: - Pull the indicator to the chart - The first parameter defines which timeframes are saved into one file. An example: If you do not want to see a drawn object (e.g. line) from D1 in M1 you need to specify the timeframes.
- The default v
FREE

All-in-one trading powerhouse: trend, reversal, and exhaustion detection
This indicator is a personal implementation of the famous Traders Dynamic Index, which uses RSI, moving averages and volatility bands to find trends, reversals and price exhaustions. However, this particular implementation supports not only RSI, but many others. It is suitable for scalping, day trading, and swing trading and aims to provide a full picture of the current market conditions. [ Installation Guide | Update Gui

Индикатор скорости. Определяет скорость движения цены. Незаменимый инструмент для скальперов. Благодаря его скоростным качествам, сейчас нам представляется возможность оценить текущую ситуацию на рынке и успеть войти в сделку в точное время. Этим индикатором можно пользоваться абсолютно на любом таймфрейме, на любом торговом инструменте и на совершенно любом рынке ценных бумаг. Им можно определять скорость движения цены за конкретный период. В его настройках также входит дополнительный фильтр о

It is an indicator for high quality scalper signals that can be used in any timeframe.
The indicator has an alarm that can alert the trader to the trading starts, and has a proactive system that can be used to improve risk management and also to alert the trader in the trading starts.
The indicator suggests only entry point and take profit, leaving the stop loss to the trader's discretion, its recommended at the last top or bottom, or at a point in accordance with the risk management.
I

An indicator to draw a graph of account current and historical state such as Balance, Equity, Margin, Free Margin, Margin Level, Drawdown, Account Profit, Deposit and Withdrawals.
Indicator Inputs : Draw Balance Graph Draw Equity Graph Draw Margin Graph Draw Free Margin Graph Draw Margin Level Graph Draw Drawdown Graph Draw Account Profit Graph Hide Data on Chart and Buffers Connect Gaps by Lines Sign of DDs on Profit Sign of DDs on Loss
Tips : The Indicator will draw historical balance gra
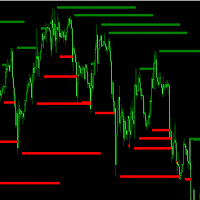
Previous High and Previous Low in the charts usually forms an area of interest for trading on the chart. Price usually move quickly then stall around these areas. This indicator identify Bars which are highest or lowest of the surrounding bars and extend a line out to visualize it. Extend line for how many bars: Define how many bars to extend the bars to the right of the extreme bar. Width of Extreme: Define how many bars it should be the highest/lowest to the left and right of the bar Keep line

----< High Accuracy Trend Channel and Entry Signals >----
RSChannel could tell you the trend direction, resistance and support, when to open orders and where to set stoploss & takeprofit. this is a multifunctional indicator, can work well on all symbols and timeframes.
Features:
real-time analysis of trend direction filter out all the minor waves show resistance and support along as price goes give highly accurate entry signals frequently send alert in popup, email, notification way at e

----< High Accuracy Ichimoku Cloud Entry Signals >----
CloudEntry could tell you the trend direction, resistance and support, when to open orders and where to set stoploss & takeprofit. this is a multifunctional indicator, can work well on all symbols and timeframes.
Features: real-time analysis of trend direction filter out all the minor waves show resistance and support along as price goes give highly accurate entry signals frequently send alert in popup, email, notification way at every
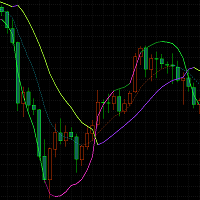
A cross - track indicator that visually shows the current bullish/bearish trend of the market through the midline (mid track), main line (upper track), and sub-lines (lower track). Intersections or upper rail turns can be used as buying and selling positions.
Parameter description: period:10 price: WEIGHTED //HIGH //LOW //OPEN //CLOSE //MEDIAN //TYPICAL //AVERAGE //WEIGHTED method:Linear weighted //Simple //Exponential //Smoothed // Linear weighted main offset:1.5 sub offset:1 base:2 counts ad
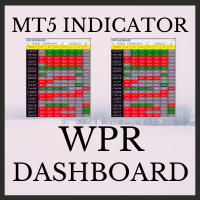
WPR Dashboard uses the value of William's Percent Range indicator. The parameters can be adjusted via the Edit boxes of this dashboard. The monitoring pairs will be selected by adding to the Market Watch (no need to set prefixes or suffixes) , you can monitor many pairs as you like. This dashboard will check almost popular time frame (M1,M5,M15,M30,H1,H4 and D1). The colors can be customized. We can have a look at many pairs and many time frames without opening the chart. In addition, we can
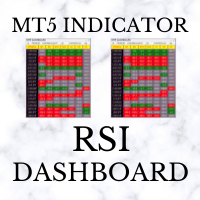
RSI Dashboard uses the value of Relative Strength Index indicator. The parameters can be adjusted via the Edit boxes of this dashboard. The monitoring pairs will be selected by adding to the Market Watch (no need to set prefixes or suffixes) , you can monitor many pairs as you like. This dashboard will check almost popular time frame (M1,M5,M15,M30,H1,H4 and D1). The colors can be customized. We can have a look at many pairs and many time frames without opening the chart. In addition, we can

A simple and highly effective Strength and Weakness currency indicator that can be used to aid your fundamental and technical analysis for winning trade decisions.
The indicator is very easy to use and can be applied to all time frames.
FX Tiger uses an advanced algorithm to calculate a score table for all major currencies. Green indicates currency strength and red indicates currency weakness. Once you have identified the strong and weak currencies, pair strong versus weak currencies and co
FREE
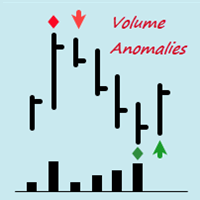
Индикатор VolumeAnomalies показывает аномальное поведение цены при увеличении объема. Эти аномалии могут привести, как минимум, к торможению и, как максимум, к развороту Рынка. Индикатор VolumeAnomalies включает в себя 3 варианта аномалий: 1. Support and Resistance - Поддержка и Сопротивление. При увеличении объема (усилия) уменьшается результат (расстояние между закрытиями баров/свечей). 2. Attenuation UP and DOWN - Затухание вверх и вниз. При увеличении объема (усилия) результат не соразмере

Индикатор разворота ADR сразу показывает, где в настоящее время торгуется цена относительно своего нормального среднего дневного диапазона. Вы будете получать мгновенные оповещения через всплывающие окна, электронную почту или push-уведомления, когда цена превышает свой средний диапазон и уровни выше него по вашему выбору, чтобы вы могли быстро переходить к откатам и разворотам. Индикатор рисует на графике горизонтальные линии на экстремумах среднего дневного диапазона, а также расширения выше

Версия данного продукта на русском языке расположена по этой ссылке:
https://www.mql5.com/ru/market/product/124312 Данный индикатор рисует торговые зоны по фракталам со старших периодов, что упрощает торговлю по уровням.
На одном графике данный индикатор рисует два типа торговых зон. Например если текущий период - H1, то торговые зоны будут искаться по фракталам с H4 и с D1. В стандартных настройках фрактальные зоны с H4 будут рисоваться желтым цветом, а с D1 - зеленым. При наложении зон, про
FREE

Бесплатный индикатор для быстрого обнаружения прорыва трендовой линии, а также максимума или минимума ценового диапазона. Он отображает линии по максимумам и минимумам цены, а также находит и показывает наклонные трендовые линии. Как только цена выходит за линию, и свеча закрывается, то индикатор сигнализирует об этом стрелкой (также, можно включить алерт). Этот индикатор прост в использовании, а также бесплатен. Количество свечей для определения трендовых линий, а также максимума и минимума т
FREE
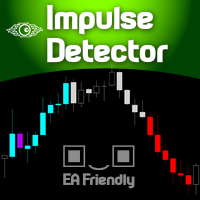
Imagine a support tool that Colors Up the candlesticks on your chart according to the market behavior, based on Trend , Momentum , Price Behavior, and/or Volume . You choose what to use! Well, welcome to the Minions Labs creation called Impulse Detector ! This flexible indicator is designed to give visual support on your chart using just colored candlesticks, so you can continue to draw your studies, use any other indicators in auxiliary sub-windows without affecting your screen real state. It d
Fractal 358 + Caixote
This 'two in one' indicator combines Caixote , a graphic pattern that defines entries, and Fractal 358 , a new way to read and forecast price movements on chart, that shows both exits and threats to operations in the mini-index (WIN) and B3 shares.
Operational Strategy
This indicator can be used with almost any asset and period, but it is more assertive with some than others. By default, it is configured for the Brazilian B3 mini-index (WIN). User can adjust only one p

Индикатор рисует цветную гистограмму из сравнений значений сил быков и медведей. Работает следующим образом: Берутся значения двух индикаторов Bears и Bulls, сравнивается кто сильнее на свече, заполняется столбец. Это всё.
.
FREE

Индикатор преобразует две скользящие средние в гистограммы и закрашивает их область пресечения. Есть настройка shift trick она используется для сглаживания результата расчетов. Можно увидеть изменения, если уменьшить этот параметр до 1(минимальное значение). Доступные средние: MA Simple MA Exponential MA LinearWeighted MA Smoothed DEMA TEMA и RSI - как бонус По умолчанию в верхней части гистограммы отображается быстрая MA, внизу - медленная. Можно поменять их местами, если хочется. sh
FREE

Trend and Signals MT5 indicator scans 30 trading Instruments (Forex, Metals and Indices). It uses special algorithm on the current market based on Pure Price Action and display the overall trend and signal on the dashboard. When signals are produced the indicator sends alert and notification. Strategy for Signals This indicator uses the daily timeframe to determine the direction of the trend. The hourly timeframe is used to identify possible entries. Main trend and is determined by

MACD divergence signals MACD is called Convergence and Divergence Moving Average, which is developed from the double exponential moving average. The fast exponential moving average (EMA12) is subtracted from the slow exponential moving average (EMA26) to get the fast DIF, and then 2× (Express DIF-DIF's 9-day weighted moving average DEA) Get the MACD bar. The meaning of MACD is basically the same as the double moving average, that is, the dispersion and aggregation of the fast and slow moving a

Индикатор для синхронизации и позиционировании графиков на одном и более терминалах одновременно. Выполняет ряд часто необходимых при анализе графиков функций: 1. Синхронизация графиков локально - в пределах одного терминала при прокрутке, изменении масштаба, переключении периодов графиков, все графики делают это одновременно. 2. Синхронизация графиков глобально - тоже самое, но на двух и более терминалах, как МТ5, так и МТ4. 3. Позиционирование графика на заданном месте при переключении периодо
FREE

The Keltner Channel is a volatility-based technical indicator composed of three separate lines. The middle line is an exponential moving average (EMA) of the price. Additional lines are placed above and below the EMA. The upper band is typically set two times the Average True Range (ATR) above the EMA, and the lower band is typically set two times the ATR below the EMA. The bands expand and contract as volatility (measured by ATR) expands and contracts. Since most price action will be encompasse
FREE
Статистический индикатор спреда.
Незаменимый инструмент для каждого трейдера. Подходит как для ручной, так и для алгоритмической торговли.
Ключевые показатели:
maximum - максимальное значение спреда за указанный период medium - среднее значение спреда за указанный период minimum - минимальное значение спреда за указанный период current - текущее значение спреда Его можно использовать абсолютно на любом торговом инструменте. Данный индикатор показывает пределы спреда за установлен
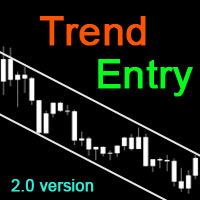
----< High Accuracy Entry Signals and Trend Indicator >----
TrendEntry could tell you the trend direction, resistance and support, when to open orders and where to set stoploss & takeprofit. this is a multifunctional indicator, can work well on all symbols and timeframes.
Features:
real-time analysis of trend direction filter out all the minor waves show resistance and support along as price goes give highly accurate entry signals frequently send alert in popup, email, notification way a

Se você já ouviu falar do Método de Wyckoff, Análise de dispersão de volume, etc., com certeza chegou até aqui para buscar o indicador que lhe faltava!! Nosso indicador é capaz de lhe mostrar a dispersão de volume negociado pelos grandes players durante todo o período de negociação!
E o grande diferencial deste tipo de abordagem é a capacidade que este indicador possui de lhe mostrar onde está armado o "ACAMPAMENTO" dos BigPlayers e, assim, tirar o melhor proveito em seus trades, entrando jun

Dark Oscillator is an Indicator for intraday trading. This Indicator is based on Counter Trend strategy, trying to intercept changes in direction, in advance compared trend following indicators. We can enter in good price with this Indicator, in order to follow the inversion of the trend on the current instrument. It is advised to use low spread ECN brokers. This Indicator does Not repaint and N ot lag . Recommended timeframes are M5, M15 and H1. Recommended working pairs: All. I nst

VR Pivot - это индикатор ключевых разворотных точек пивотов (pivot). Точки Пивот – это специальный тип уровней поддержки (support) и сопротивления (resistance) , которые используются с целью определения наиболее сильных ценовых зон. Профессиональные трейдеры использую уровни пивотов для определения цен на которых существует большая вероятность разворота цены. Уровни рассчитываются по специальным математическим формулам, в расчет идут цены закрытия, открытия, максимума, минимума предыдущего време
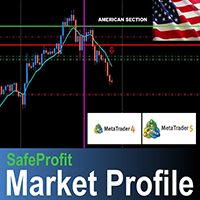
Профиль рынка SafeProfit - это самый продвинутый индикатор отслеживания на рынке Форекс. Он был разработан для отслеживания рыночного профиля каждой сессии дня: азиатской, европейской и американской. С помощью этого индикатора вы будете работать в течение дня, улыбаясь ... точно зная, где находятся крупные игроки и в какой момент они собираются. Индикатор простой, быстрый и объективный, он отслеживает каждое движение крупных игроков в цене. Выйдите из 95% статистики, которая только проигрывает,
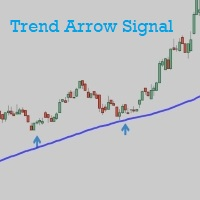
Trend Arrow Signal gives buy/sell signals and alerts with up and down arrow at potential reversal of a pullback or a trend continuation pattern. As the name indicated, this is an indicator which gives signals based on trend => It works best in trend market with the principle is to ride on the trend not trade against the trend. The main trend is determined by EMA 50 and can be changed manually to suit your preference. Trend arrow signal can work on all time frames. It gives signal at close of th
FREE

Прорыв трендовой линии, а также максимума или минимума обычно сообщает о смене (или продолжении) тренда. Данный и ндикатор отображает линии по максимумам и минимумам цены, а также находит и показывает наклонные трендовые линии. Как только цена выходит за линию, и свеча закрывается, то индикатор сигнализирует об этом стрелкой (также, можно включить оповещения). Этот индикатор прост в использовании, при этом, существует много торговых стратегий, которые основаны на прорыве трендовых линий. Количес

Ichimoku Map (м гновенный взгляд на рынки ) - построен на базе легендарного индикатора Ichimoku Kinko Hyo.
Задача Ichimoku Map давать информацию о силе рынка на выбранных временных периодах и инструментах, с точки зрения индикатора Ишимоку .
Индикатор отображает 7 степеней силы сигнала на покупку и 7 степеней силы сигнала на продажу.
Чем сильнее тренд, тем ярче сигнальный прямоугольник в таблице.
Таблицу можно перетаскивать мышью.
Размер таблицы зависит от размера шрифта, выбранного
Fundamental Signals Indicator is a Non-Repaint Indicator with a powerful calculation engine that can predict market movement over 3000 pips (30000 points). The indicator does not analyze the market fundamentally, it is named fundamental because it can predict trends with large movements, no complicated inputs and low risk. Also Indicator can alert on market trend changes.
Using Indicator :
The Indicator is very simple and without complicated input parameters. (No need to optimize anythin
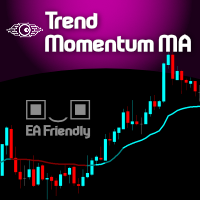
Imagine a simple and powerful line that gives you everything you need: Trend and Momentum . Welcome to the Trend Momentum Moving Average ! Visually it seems like a very simple Moving average, but in fact it is a VIDYA ( Variable/Volatility Index Dynamic Average ) type of moving average - originally created by Tushar Chande - and the main purpose of this special Moving Average is to understand and interpret the current volatility of the market and apply it as a smoothing factor for a traditional
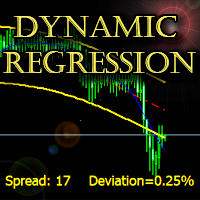
Индикатор строит динамический канал регрессии с высокой точностью без запаздывания. Отклонение канала рассчитывается по уникальной формуле и отображается на графике. Support: https://www.mql5.com/en/channels/TrendHunter Возможно использование на любом таймфрейме и любом инструменте. MT4-версия: https://www.mql5.com/ru/market/product/64252 Можно использовать как готовую торговую систему, как и дополнение к существующей. Настройки:
Fast Period - Период быстрого сглаживания; Slow Period - Пе
AoMA is an indicator based on analytical geometry calculations, where the average price angle of a given period is calculated.
Being a powerful indicator of reversal points and supports, supports and resistances become objective with the formation of well-defined "plateau" areas.
It can be used for trend monitoring and the anticipation of trend reversal points.
Two levels of periods are available, a short and a long one, and period crossings can be used as indicative of buying and selling

Setup 9.1 strategy created by the North American trader Larry Williams . SIMPLE setup, effective, with a good level of accuracy and excellent return. Attention : The Demo version only works on the tester, if you are interested in running it in real time, please contact me and I will provide another version. Buy Signal:
Exponential moving average of 9 (MME9) is falling, wait it to TURN UP (in closed candle). Place a buy stop order 1 tick above the HIGH of the candle that caused the turn to occur

Этот многосимвольный индикатор приборной панели может отправлять оповещения при обнаружении сильного тренда. Это можно сделать, создав информационную панель с использованием следующих индикаторов/осцилляторов (далее упоминаемых только как индикаторы): RSI, Stochastics, ADX, CCI, MACD, WPR (процентный диапазон Вильямса, также называемый Williams %R), ROC (ценовой диапазон). скорость изменения) и осциллятор Ultimate. Его можно использовать со всеми таймфреймами от M1 до MN (он может показывать тол

Индикатор Supply Demand RSJ PRO рассчитывает и строит на графике зоны «Предложение» и «Спрос», определяя тип Зоны (Слабая, Сильная, Проверенная, Проверенная) и в случае повторных проверок Зоны показывает, сколько раз она был повторно протестирован. Зоны "предложения" - это ценовые зоны, в которых предложение превышает спрос, что приводит к снижению цен. Зоны «спроса» - это ценовые зоны, в которых наблюдается больший спрос, чем предложение, что приводит к росту цен.
Обязательно попробуйте нашу

https://www.mql4.com Индикаторы тенденций цен отражают изменение рыночных цен точно так же, как и будущие тенденции рыночных цен. Этот показатель не перекрашен, не запоздалый. Рекомендуется время не меньше, чем H1. Когда рыночные цены находятся в светло-зеленом диапазоне, рынки растут, а когда рыночные цены находятся в светло-зеленом диапазоне, рынки падают. Рекомендую использовать параметры по умолчанию.
Индикатор строит "психологические уровни": уровни круглых чисел и промежуточные уровни круглых чисел.
Круглые числа играют важную роль в формировании уровней поддержки и сопротивления. Существует закономерность, при которой спад или рост цены может остановится на круглых числах.
Уровень, цена которого заканчивается на 0, является уровнем круглого числа первого порядка.
Промежуточный уровень, это уровень между двумя круглыми уровнями, например, между 10 и 20 это уровень 15.

Вычисляет уровни pivot. В зависимости от расположения цен относительно этих уровней закрашивает гистограмму. Значения параметров: style - выбор типа отображения (Histogram, Line, Arrow) price - цена, мало влияет на конечный вид, но это можно настроить timeframe - выбор таймфрейма для расчета уровней. color over pivot line - цвет всего что выше уровня pivot color under pivot line - цвет всего что ниже уровня pivot pivot line intersection color - цвет, когда тело свечи пересекает центральную ли
FREE

Индикатор Checkpoints реализует усовершенствованный алгоритм для визуализации рыночного тренда. сновное применение индикатора заключается в генерации сигналов на покупку и продажу.
Определение рыночного тренда является важной задачей трейдеров. Наверное, почти каждый трейдер хоть раз, но мечтал про незапаздывающие МА. Я воплотил эту мечту в своем индикаторе. При помощи этого индикатора можно прогнозировать будущие значения.
Индикатор предназначен для определения либо тренда, либо краткоср

Индикатор Interesting Thing визуально разгружает ценовой график и экономит время анализа: нет сигнала – нет сделки, если появился обратный сигнал, то текущую сделку стоит закрыть. Это стрелочный индикатор для определения тренда.
Индикатор реализует стратегию для торговли по тренду, фильтрация и все необходимые функции, встроенные в один инструмент! Принцип работы индикатор заключается в том, чтобы при размещении на график автоматически определять текущее состояние рынка, анализировать истори
3-BAND VWAP (Volume Weighted Average Price)
Fully customized and EA-friendly VWAP Bands Indicator
MAIN FEATURES:
Choose the period of the VWAP calculation reset (Daily, Weekly or Monthly): For day trading use the Daily VWAP, and for longer term analysis use the Weekly or Monthly calculations.
Fine adjustment of the deviation of the bands: Find the best band’s deviation for the instruments you trade and adjust accordingly.
Customize line colors, style and width according to you

Find out in real time which side, buy or sell, is putting the most pressure through a simple and efficient visualization of Depth of Market. The indicator calculates the amount of offers at the specified depths and displays the percentage on each side in relation to the total. PressureBook Indicator is fully customizable, in which you can: Select which symbol you want to track. By default, the selected symbol is the same as the graph in which the indicator was inserted; Define the amount of pri

Description: TrendAccess can optimize your trading time by showing you the trend via two different calculation modes quick and easy.
No more searching for Trends. Just open the chart and look at the trend display.
Features: Shows Uptrend, Downtrend and "No Trend" indicator
Shows the calculated ZigZag Profile
Works on all timeframes Two different calculation Modes (MACD and Candle-based calculation)
Settings: Variable
Standard Value Description
Calculation Mode
Candle based
C

Точки входа Our Trend нужно использовать как точки потенциального разворота рынка. Индикатор работает используя функцию циклично-волновой зависимости. Таким образом, все точки входа будут оптимальными точками, в которых изменяется движение.
Самым простым вариантом использования индикатора является открытие сделки в сторону существующего тренда. Наилучший результат дает сочетание индикатора с фундаментальными новостями, он может выступать в качестве фильтра новостей, то есть показывать наско

Индикатор Trend Complete является сигнальным и обладает интересными свойствами. Нужно принять во внимание что данный индикатор отражает экстремумы и его следует использовать как дополнительный, а для точки входа использовать другой инструмент. Ищет и отображает на графике цены точки разворота. Индикаторы тренда являются одним из основных инструментов анализа тенденций на валютном рынке Форекс. Индикатор умеет передать все виды сигналов пользователю: сообщения, E-mail и Push!
Целью, которая

https://www.mql5.com A double moving average indicator This indicator uses the system's own two different time period of moving average indicators to reflect the movement of market prices. It is recommended that you use the default parameter Settings, which you can set according to your own experience to get the best predictive power. I hope it can provide some help for your trading.
FREE

MACD indicators https://mql5.com This MACD indicator looks slightly different from the MACD indicator found in many other charting software. When the value of the signal line parameter is greater than the value of the MACD parameter, the indicator will give a buy prompt, and when the signal line parameter is less than the value of the MACD parameter, the indicator will give a sell prompt.
FREE
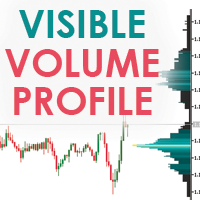
Visible Market Profile graphically represents the amount of trades made on each price level. This indicator in particular, unlike the daily market profile , is calculated on the visible area of the chart.
Visible Market Profile cannot be considered an indicator of operational signals, but it can be a good support for reading the market, in addition to what is already used by every trader in his work process. The Visible Market Profile is able to determine with a good approximation the pric

This MT5 indicator, Bull Bear Visual MTF V2, summarize the strength color graphic and percentages of power for both Bull and Bear in current market emotion stage which will show you in multi timeframes (21) and sum of the total Bull and Bear power strength which is an important information for traders especially you can see all Bull and Bear power in visualized graphic easily, Hope it will be helpful tool for you for making a good decision in trading.
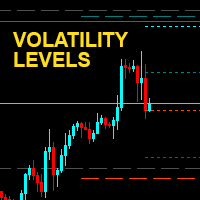
Transfer volatility levels to the chart to understand the nature of the ongoing movements. The levels are calculated based on the volatility recorded in the last few sessions. Easily identify possible targets or swing points for intraday , daily and weekly trading. In addition, the round price levels considered most important are also visible, here the highest trading volumes are usually concentrated. NO REPAINT

MCDX is an indicator based on specific formula to detect Buy and Sell momentum Red Bar means Price go up and Buy momentum. Green Bar means Price go down and Sell momentum" Height of RED bar > 50% means Bull is in control. i.e. RED more than GREEN to go buy. Lower of Green bar < 50% means Bear is in control. i.e. GREEN more than RED to go sell. DARKER RED COLOR - STRONG Up Trend or Strong Bullish Power
LIGHTER RED COLOR - WEAK Up Trend or Weak Bullish Power
LIGHTER GREEN COLOR - STRONG Down

Pivot Point Multi Method MT5 Pivot Point Multi Method MT5 is a fully automatic pivot point indicator and indicate support and resistances (S1,S2,S3,S4,R1,R2,R3,R4) based on four Methods that you can select on of them Pivot point detection and drawing support resistances Methods( Classic ,Camarilla ,Woodie ,Fibonacci)
Pivot Point Multi Method Mt5 is working on all time frames and all currency pairs and gold silver and crypto currencies .
Recommended Setting : Pivot_Method select one of
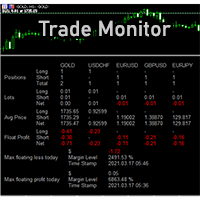
DSProFx Trade Monitor (iExposure) gives you detail information of all trades in your account including total positions, lot size, average price level (Breakeven Level), floating profit, and today's maximum profit/loss. The display is simple. Each data will be separated for every symbol/chart. This indicator will help you monitoring your trades especially if you are working with multiple symbols/charts and open many orders. Just attach DSProFx Trade Monitor in one chart, and it will show all deta

MA Bounce стратегия - это стратегия, которая направлена на открытие длинных позиций по валютным парам при сильном восходящем тренде, когда они отскакивают от своей поддержки в виде скользящей средней, и короткие позиции валютных пар при сильном нисходящем тренде, когда они отскакивают от сопротивления в виде скользящих средних. Лучшими подходящими периодами скользящих средних для этой стратегии являются 18, 30, 50. Этот индикатор помогает идентифицировать и находить место для потенциального вхо

Dark Absolute Trend is an Indicator for intraday trading. This Indicator is based on Trend Following strategy but use also candlestick patterns and Volatility. We can enter in good price with this Indicator, in order to follow the main trend on the current instrument. It is advised to use low spread ECN brokers. This Indicator does Not repaint and N ot lag . Recommended timeframes are M5, M15 and H1. Recommended working pairs: All. I nstallation and Update Guide - Troubleshooting

В торговой системе "Masters of Risk" один из основных концептов связан с местами, где рынки меняют направление. По сути, это смена приоритета и нарушение структуры тренда на экстремумах рынка, где предположительно находятся или находились бы стоп-лоссы "умных" участников, которые стоят за границами накоплений объема. По этой причине называем их "Разворотные фигуры" - места с большим весом для начала нового и сильного тренда.
Некоторые из важных преимуществ индикатора заключаются в следующем:
Ч

Наиболее важным ценовым уровнем в любом "Профиле объема" является "Точка контроля" . Это ценовой уровень с наибольшим торговым объемом. И в основном это уровень, на котором крупные игроки начинают свои позиции, так что это уровень накопления/распределения для умных денег.
Идея индикатора возникла после того, как сделали индикатор "MR Volume Profile Rectangles" . При создании индикатора "MR Volume Profile Rectangles" мы потратили много времени на сравнение объемов с объемами из профиля объемов

"Профиль объема" - это расширенный индикатор, отображающий общий объем торгов на каждом ценовом уровне за указанный пользователем период времени. Основными составляющими профиля объемов являются POC ( Point Of Control - уровень цены, при котором за выбранный период было исполнено максимальное количество контрактов), VAH ( Value Area High - самая высокая цена в области Value Area) и VAL ( Value Area Low - самая низкая цена в Value Area).
Когда мы остановились на исходном индикаторе, мы долго с

" Торговый диапазон возникает, когда финансовый инструмент торгуется между постоянными высокими и низкими ценами в течение определенного периода времени. Верхняя часть торгового диапазона финансового инструмента часто обеспечивает ценовое сопротивление, в то время как нижняя часть торгового диапазона обычно предлагает ценовую поддержку. Трейдеры могут входить в направлении прорыва или пробоя из торгового диапазона... "
Это понимание диапазонов "Классической теории". У нас разное понимание пр
Узнайте, как легко и просто купить торгового робота в MetaTrader AppStore - магазине приложений для платформы MetaTrader.
Платежная система MQL5.community позволяет проводить оплату с помощью PayPal, банковских карт и популярных платежных систем. Кроме того, настоятельно рекомендуем протестировать торгового робота перед покупкой, чтобы получить более полное представление о нем.
Вы упускаете торговые возможности:
- Бесплатные приложения для трейдинга
- 8 000+ сигналов для копирования
- Экономические новости для анализа финансовых рынков
Регистрация
Вход
Если у вас нет учетной записи, зарегистрируйтесь
Для авторизации и пользования сайтом MQL5.com необходимо разрешить использование файлов Сookie.
Пожалуйста, включите в вашем браузере данную настройку, иначе вы не сможете авторизоваться.