Смотри обучающее видео по маркету на YouTube
Как купить торгового робота или индикатор
Запусти робота на
виртуальном хостинге
виртуальном хостинге
Протестируй индикатор/робота перед покупкой
Хочешь зарабатывать в Маркете?
Как подать продукт, чтобы его покупали
Новые технические индикаторы для MetaTrader 5 - 48

VWAP, or volume-weighted average price, helps traders and investors observe the average price that major traders consider the "fair price" for that move. VWAP is used by many institutions to set up large operations.
In this indicator, you can enjoy the following features:
Daily VWAP, with option to display your current price next to the chart VWAP Weekly, with option to display your current price next to the chart Monthly VWAP, with option to display your current price next to the chart
FREE
MT4 Version
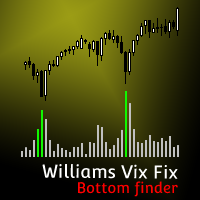
Williams Vix Fix MT5 Need help trying to time the bottoms in the market? Williams Vix Fix MT5 is based on the volatility of the market and grants a huge support for finding out when a correction is comming to its end. TRY IT FOR FREE NOW! Williams Vix Fix MT5 derivates from Larry Williams's VixFix indicator addapted for fitting every asset class . VIX reprensents the fear and greed in the market based on its volatility. A high VIX value shows fear in the market, this is usually a g

Your Pointer - это не обычный форекс канал. Этот коридор выстраивается на основании анализа нескольких свечей, начиная от последней, в результате чего определяются экстремумы исследуемого промежутка. Именно они и создают линии канала. Он как и все каналы имеет среднюю линию а также линию максимума и минимума. Этот канал стоит внимания из-за своего необычного поведения. Применение индикатора Your Pointer позволяет трейдеру вовремя отреагировать на выход цены за границы установленного для нее кан
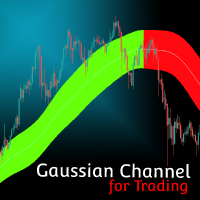
MT4 Version Gaussian Channel MT5 Gaussian Channel MT5 is the first indicator in the market that uses Ehlers Gaussian Filter methods to define trends. Nowadays, this Gaussian Channel is highly known as a method to support HOLD techniques in crypto. If the price is above the channel the trend is strong, if it comes back to the channel this can react as a resistance and indicate the beginning of a bear market (or Winter) if the price breaks below it. Eventhough the use of this channel focuses on hi

Bella - один из наиболее популярных индикаторов, который позволяет своевременно определить разворот тренда, получить раннюю точку входа и точно определить место фиксации прибыли. Индикатор Bella реализует главную идею трейденра и генерирует точку входа в рынок в сторону тренда.
Bella используется при наличии дополнительных индикаторов. Для фильтрации таких сигналов можно использовать этот же индикатор на более старших таймфреймах. Таким образом усовершенствуется работа с индикатором, при этом

This indicator shows current major support and resistance, if one exists. And as a support or resistance is broken it shows the new current, if any. To identify support and resistance points it uses the high and low points identified on the current chart. Allows too you to inform the maximum number of bars used to consider a support or resistance point still valid.
FREE

Я хочу еще раз, что свет клином на всех индикаторов не сошелся. Как бы вы упорно не искали, вы все равно не найдете индикатор, который всегда и во всех условиях будет вам давать исключительно прибыльные сигналы. Как вы видите, все достаточно просто, и вам даже по сути, ничего и анализировать не надо. В целом, я бы сказал, что индикатор Signal No Problem может стать прекрасной помощью для создания своей торговой системы. Само собой, что только лишь по стрелочкам торговать не надо, добавить какие
Calculated Trend - трендовый индикатор создает вдоль графика двухцветные точки соединенные между собой линиями. Это трендовый индикатор, представляет из себя алгоритмический индикатор. Прост в работе и понимании при появлении синего кружка необходимо покупать, при появлении красного - продавать. Индикатор хорошо указывает точки начала тренда и его завершения или разворота. Работа на валютном рынке Форекс без трендовых индикаторов практически не возможна. Приминяя в работе индикатор Calculated T

Фундаментальный технический индикатор,который позволяет дать оценку текущей рыночной ситуации,чтобы в войти в рынок выбранной валютной пары в тренд и с минимальным риском.
Данный индикатор был создан на основе оригинальных индикаторов поиска экстремумов, индикатор хорошо подходит для определения разворота или большого резкого рывка в одну из сторон благодаря ему вы будете знать когда такое произойдет он вас уведомит появлением точки синего цвета на покупку красного на продажу.
Использует в
KF CROSS 3MA
This indicator show the collision points of moving averages in a separate window. so we will have a solitude chart. Features indicator: Show alert in Meta Trade Send notification to mobile Adjustable 3 MA (Fast-Middle-Slow) Can be used on all symbols Can be used in all time frames
Attention, the application does not work in the strategy tester
You can download the Demo version on the comments page : https://www.mql5.com/en/market/product/81152?source=Site
or cotact us : ht
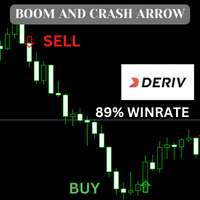
This indicator is based on an advanced strategy primarily for trading spikes on Boom and Crash Indices. Complex algorithms were implanted to detect high probability entries only. It alerts on potential Buy and Sell entries. To trade spikes on the Deriv or Binary broker, only take Buy Boom and Sell Cash alerts. It was optimized for 5-minute timeframe. the indicator will tell you were to sell and buy its good for boom and crash and currency pairs ,EURUSD ,GBPUSD,NAS100, 89% no repaint Feature

This indicator draws the highest and the lowest prices of the previous periods on the chart. And If you want, Indicator can alert you when the current price arrives these levels. For example: If you are watching the H1 timeframe, Indicator shows you the lowest and the highest prices of H4, D1, W1 and M1 periods. So you don't need to open the other periods of chart windows. Alert Options: Send Mobil Message, Send E-mail, Show Message, Sound Alert Time Periods: M1, M5, M15, M30, H1, H2, H3, H
FREE

Highly configurable Awesome Oscillator (AO) indicator. Features: Highly customizable alert functions (at levels, crosses, direction changes via email, push, sound, popup) Multi timeframe ability Color customization (at levels, crosses, direction changes) Linear interpolation and histogram mode options Works on strategy tester in multi timeframe mode (at weekend without ticks also) Adjustable Levels Parameters:
AO Timeframe: You can set the current or a higher timeframes for AO. AO Bar Shift:
FREE
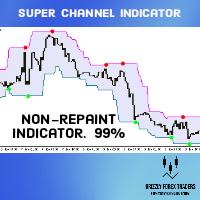
Super Signals Channel Indicator Its channel is a non-repaint indicator that reacts more with recent price movements. For this reason, the Super Signals Channel Indicator is a better match for short-term or day trading strategy. The Super Signals Channel only plots swing trading opportunities. So most of its trade signals appear during consolidation or sidelined periods of the market. Super Signals Channel Indicator for MT5 Explanation The green band below the price shows the dynamic support le

Если вам нравится этот проект, оставьте 5-звездочный обзор. Следуйте на instagram: borelatech Как институционалы торгуют большими объемами, для них не должно пытаться
защищать свою позицию на определенных процентных уровнях. Эти уровни будут служить естественной поддержкой и устойчивостью, которую вы
можете использовать
либо войти в торговлю или быть в курсе возможных опасностей против вашей
позиции. Этот осциллятор покажет вам вариацию процент для: День. Неделя. Месяц. Квартал. Год. В под
FREE

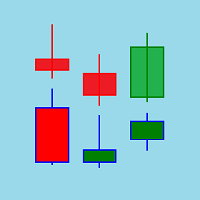
Индикатор для графического анализа. Отмечает на графике основные комбинации японских свечей. На текущий момент трейдеру доступны следующий набор паттернов: - Bearish/Bullish Abandoned Baby; - Bearish Advance Block; - Bearish Deliberation; - Bearish/Bullish Belt Hold; - Bearish/Bullish Engulfing; - Bearish Shooting Star; - Bearish Evening Star; - Bearish Evening Doji Star; - Bearish/Bullish Doji Star; - Bearish/Bullish Tri-Star; - Bearish Hanging Man; - Bearish/Bullish Harami; - B

Stargogs Spike Catcher V3.12 This Indicator is Developed To milk the BOOM and CRASH indices . Send me Message if you need any help with the indicator. CHECK OUT THE STARGOGS SPIKE CATCHER EA/ROBOT V3: CLICK HERE ALSO CHECK OUT SECOND TO NONEFX SPIKE CATCHER: CLICK HERE STARGOGS SPIKE CATCHER V3.12 WHATS NEW! Brand New Strategy. This is the Indicator you need for 2023. The Indicator Gives you an Entry at a time when conditions are met enter on every arrow and exit when it gives an X. New Tren

Do you know VWAP Bands? It is an indicator used to identify support and resistance points from the daily VWAP and you can use it to check the best entry and exit points. This indicator does not use the principle of bollinger bands. There is a difference in the calculation method. Use it according to your strategy. See the applications and what results you can get. The indicator is free and can be used on any account.
FREE

We at Minions Labs consider ATR ( Average True Range ) one of the most fantastic and most underrated indicators of Technical Analysis. Most of the traders really don't give a sh* about the True Range of the market and this probably can be because they could not apply the data right away in a practical way over their charts or over their own strategy, leaving this indicator in the land of obscurity and doubt. Well, this indicator, Bigger Than ATR , is a step forward to show you what is possible t

Highly configurable Macd indicator.
Features: Highly customizable alert functions (at levels, crosses, direction changes via email, push, sound, popup) Multi timeframe ability Color customization (at levels, crosses, direction changes) Linear interpolation and histogram mode options Works on strategy tester in multi timeframe mode (at weekend without ticks also) Adjustable Levels Parameters:
Stochastic RSI Timeframe: You can set the lower/higher timeframes for Stochastic RSI. Stochastic RSI
FREE
DeepL Translation - онлайн-перевод
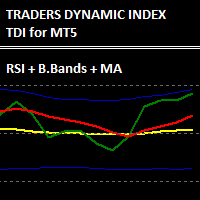
Traders Dynamic Index - это комбинация нескольких индикаторов в сложный набор сигналов, которые можно интерпретировать для поведения рынка.
Он объединяет RSI, полосы Боллинджера и скользящую среднюю. Впервые разработанный Дином Мэлоуном, он получил широкое распространение, поскольку объединяет часто используемые стратегии в одном индикаторе.
RSI определяет фазу перекупленности или перепроданности для инструмента, которая сглаживается и фильтруется MA
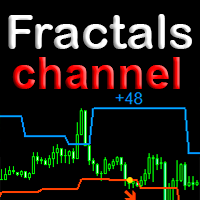
Трендовый индикатор с уникальным алгоритмом определения смены тренда. Для определения тренда использует Price Action и собственный алгоритм фильтрации. В основе алгорима используется ценовой канал по фракталам графика. Такой подход помогает точно определять точки входа и текущий тренд на любом таймфрейме. Без задержек распознать новый зарождающийся тренд с меньшим количеством ложных срабатываний. Особенности
Преимущество индикатора заключается в том, что его период динамический. Так как привяза

The Qv² Trend is an indicator that aims to identify trends.
Buying trend signals are indicated by arrows pointing up.
Selling trend signals are indicated by arrows pointing down.
It can be used in all deadlines.
It can be used in all pairs.
I use it on the H1 with a period of 24. Important Recommendation: Make sure you trade in trend market. Good Trades, in trend market

Info: marcobarbosabots
Pivot lines are an easy way to see market trend. The indicator provides the pivot line and three first support and Resistance lines.
Calculations used was:
Resistance 3 = High + 2*(Pivot - Low) Resistance 2 = Pivot + (R1 - S1) Resistance 1 = 2 * Pivot - Low Pivot point = ( High + Close + Low )/3 Suport 1 = 2 * Pivot - High Suport 2 = Pivot - (R1 - S1) Suport 3 = Low - 2*(High - Pivot)
You can use the calculated values on an EA too, just make sure the indicator

Royal Wave is a Trend-Power oscillator which has been programmed to locate and signal low-risk entry and exit zones. Its core algorithm statistically analyzes the market and generates trading signals for overbought, oversold and low volatile areas. By using a well-designed alerting system, this indicator makes it easier to make proper decisions regarding where to enter and where to exit trades. Features Trend-Power Algorithm Low risk Entry Zones and Exit Zones Predictions for Overbought and Over

Этот индикатор на панели инструментов зоны спроса и предложения с несколькими временными рамками и несколькими символами отправляет предупреждения, когда цена достигает зоны спроса / предложения. Также можно использовать его для предупреждения об обычных двойных вершинах / основаниях вместо зон. Его можно использовать на всех таймфреймах от M1 до MN. Одновременно на панели управления может отображаться не более 9 таймфреймов. Можно использовать фильтры RSI, дивергенции (MACD, RSI или Awe

Meta Trend Indicator is an efficient way to forecast and detect the trend in any market. It reveals the trend, support and resistance levels, volatility and the maximum potential target, all in one indicator. To adapt to the price and to decrease consecutive trend failures, the internal trend detector algorithm studies the market and dynamically chooses the right values for the internal parameters. This indicator is a perfect trend filter for any strategy or expert advisor. Features Super Adapti

Developed by Chuck LeBeau, the Chandelier Exit indicator uses the highest high / lowest low -/+ a multiple of the ATR value to draw trailing stop lines (orange under buys, magenta over sells) that advance with the trend until the trend changes direction.The value of this trailing stop is that it rapidly moves upward in response to the market action. LeBeau chose the chandelier name because "just as a chandelier hangs down from the ceiling of a room, the chandelier exit hangs down from the high
FREE
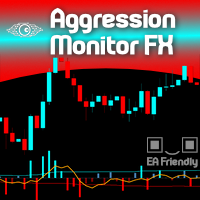
Would you like to monitor the aggression between Buyers and Sellers, minute by minute? Now you can! Welcome to the Aggression Monitor FX ! The Aggression Monitor FX indicator was developed for those markets that do not provide REAL data Volume, i.e. like the Forex market. We developed a way to use 1-minute Tick Volume data generated by Forex (and other) Brokers and manipulate it into "aggression" information in a very visual histogram with additional analysis lines. And it worked! (but hey! you
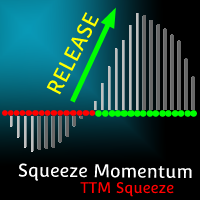
MT4 Version TTM Squeeze Momentum TTM Squeeze Momentum is an enhanced indicator ideal for recognizing consolidation periods in the market and the start of the next explosive move. This improved version is a volatility indicator based on John Carter's "TTM Squeeze" in which the histogram is based on a linear regression rather than a simple momentum indicator. Red dots on the middle line indicate that the market has entered a "Squeeze" zone or consolidation period, indicated in this enhanced versio

There are no limits!
Golden Limit is the ultimate indicator to get clear and easy readings of price movements on charts. It projects support and resistance ranges, calculated by statistical models involving Price Action and the Fibonacci sequence, revealing in advance the behavior of prices and the best places to trade and not to trade. It also has two moving averages to help choose the best entries. The Golden Limit method was created from a proven model. In summary: We use the names of preci

Created by trader and journalist Larry Williams, Setup 9.1 is a simple strategy that is easy to understand and execute, which is why it is so well known and popular in the world of traders and technical analysis. It is a REVERSION setup, where operations are sought when the moving average changes direction.
Setup Logic
With the open candlestick chart, at any time chart, it is only necessary to add the 9-period Exponential Moving Average (MME9). That done, we look for assets in which the MME

The Candle High Low Exit indicator uses the highest high and the lowest low of a range to draw trailing stop lines (orange under buys, magenta over sells) that advance with the trend until the trend changes direction. Moreover, the trailing stop lines are generated to support the order’s trend direction (long or short): In an upward trend, the long trailing stop line (orange line under buy) appears and advances upward until the close crosses under the line.
In a downward trend, the short tra
FREE

ContiStat restricted - Free DEMO version of the ContiStat indicator
Free version of the indicator is ment as DEMO of full paid version. Full functionality is available, however The indicator work only on M30 chart period . Find the ContiStat indicator for full functionality
Brief description The ContiStat indicator calculate statistic frequency of green (up) and red (down) movement in the chart and determine movement dynamics (silver curve). There are two key parameters to understand the Conti
FREE

Индикатор "Tiger" показывает развороты рынка. Основан на индексе относительной бодрости (RVI).
Представлен в виде осциллятора, который показывает энергию текущего ценового движения и отражает уверенность ценового движения от цены открытия к цене закрытия в диапазоне максимальных и минимальных цен за данный период. Это, в свою очередь, даёт трейдеру возможность находить точки разворота с большой вероятностью.
Не перерисовывает!
Хорошо показывает себя на боковом движении рынка, которое п

Brief description The ContiStat indicator calculate statistic frequency of green (up) and red (down) movement in the chart and determine movement dynamics (silver curve). There are two key parameters to understand the ContiStat principle: Block height and Block count . The ContiStat engine convert instrument price chart move to Blocks of constant height (price) regardles of how much time it take. Example 1: Block height is set to 50. DE30 index price make move from 15230 to 15443 in an hour. 4 g

Если вам нравится этот проект, оставьте 5-звездочный обзор. Следуйте на instagram: borelatech Как институционалы торгуют большими объемами, для них не должно пытаться
защищать свою позицию на определенных процентных уровнях. Эти уровни будут служить естественной поддержкой и устойчивостью, которую вы
можете использовать
либо войти в торговлю или быть в курсе возможных опасностей против вашей
позиции. Пример общего используемого процента составляет 0,25% и 0,50% на EURUSD для
неделя, вы мо
FREE

Royal Scalping Indicator is an advanced price adaptive indicator designed to generate high-quality trading signals. Built-in multi-timeframe and multi-currency capabilities make it even more powerful to have configurations based on different symbols and timeframes. This indicator is perfect for scalp trades as well as swing trades. Royal Scalping is not just an indicator, but a trading strategy itself. Features Price Adaptive Trend Detector Algorithm Multi-Timeframe and Multi-Currency Trend Low

Индикатор кумулятивной дельты Как считает большинство трейдеров, цена движется под давление рыночных покупок или продаж. Когда кто-то выкупает стоящий в стакане оффер, то сделка проходит как "покупка". Если же кто-то наливает в стоящий в стакане бид - сделка идет с направлением "продажа". Дельта - это разница между покупками и продажами. А кумулятивная дельта - разница между покупками и продажами накопленным итогом за определенный период времени. Она позволяет видеть, кто в настоящий момент конт
[ MT4 Version ] How to trade using the Fear and Greed Indicator: Click here Uncertain about when to take total or partial profits? The Fear and Greed is your reliable companion for making confident trading decisions. This innovative tool offers unparalleled insights into market sentiment, helping you identify key pivot zones and optimize your trading strategy. Why Choose Fear and Greed? Revolutionary Market Insight: Sentiment Analysis: The first indicator for that reveals the market's Fea

Distinctive это трендовый стрелочный индикатор форекс для определения потенциальный точек входа. Нравится он, прежде всего, тем, что в нём заложен простой механизм работы, адаптация ко всем временным периодам и торговым тактикам. СОздан на основе канала регрессии с фильрами. Отображаем сигналы индикатора Lawrence на графике функции цены используя математический подход.
Принцип работы - при пробитии цены в зоне перекупленности/перепроданности (уровней канала) генерируется сигнал на покупку ил
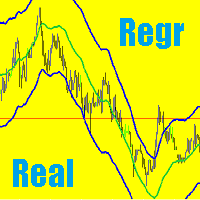
Реализация канала регрессии на МetaТrader 5, с реальным остаточным изображением линий. Сам канал регрессии состоит из двух линий, равноудалённых сверху и снизу от линии тренда регрессии. Расстояние между границами канала и линией регрессии равно значению отклонения максимальной цены закрытия от линии регрессии, только это определение соответствует самим свежым точкам регресии. Как все замечали, линии канала регресии с каждым баром перерисовываются, актуальными остаются только самые свежые точки,

Основное применение индикатора Faradenza заключается в генерации сигналов на покупку и продажу. Индикатор отслеживает рыночный тренд с непревзойденной надежностью, игнорируя резкие колебания рынка и шумы вокруг средней цены. Определение рыночного тренда является важной задачей трейдеров. Индикатор Faradenza реализует усовершенствованный алгоритм для визуализации рыночного тренда. Ловит тренд и показывает благоприятные моменты входа в рынок стрелками. Основной целью индикатора является оценка рын

Индикатор Commissioner, очень чувствительный к текущей ценовой активности, и достаточно хорошо отображает сигналы. Быстро реагирует на изменение тренда, четко показывает движение цены. Цветная версия индикатора сигнализирует об изменении тренда. Индикатор позволяет увидеть растущий или падающий тренд.
Кроме направления тренда индикатор показывает изменение угла наклона, анализ которого позволяет отфильтровать сигналы с помощью фильтров по углу, это можно использовать при построении бота с дан

This indicator demonstrates the probable dynamic support and resistance levels of EMA, Ichimoku lines, and Key OHLC levels for different timeframes on one chart. This can drastically reduce the time and effort needed for switching between different timeframes.
EMA and Ichimoku Levels are drawn for the M1, M5, M15, M30, H1, H4, and D1 timeframes, and the Key OHLC levels of the last periods are drawn for the H4, D1, W1, and MN1 timeframes.
FREE

Технический индикатор Фильтр рыночного шума (Market Noise Filter, MNF) показывает канал волатильности цен. Чем ниже волатильность, тем уже канал. Горизонтальные участки канала означают флетовое или шумовое движение цены для рассчитанного уровня волатильности. Все изменения цен происходят внутри канала, где нижняя граница работает как линия поддержки, а верхняя - как линия сопротивления". Если цена выходит за горизонтальную границу, это означает увеличение волатильности и часто начало нового тре
The Traders Dynamic Index indicator is the only technical indicator you need to scalp the market successfully. The TDI is the only technical indicator that can read the market sentiment, market volatility, and momentum at the same time. The advantage of combining the qualities of several indicators into one indicator is that it can be the “holy grail” you are looking for. Let’s break down the Traders Dynamic Index indicator and go through it a little bit. As you can see, this scalping indicator
Unlike a standard moving average, trendy traders unique algorithm will show you a less choppy signal resulting in a smoother and easier trend to follow thereby making your trading decisions more confident. Put simply when price moves above the average it signals a bullish trend and when price moves below the average it signals a bearish trend. The trader is then given 2 levels of take profit and a stop loss on each new signal. It can also be added to other trend-following systems for better pe

the indicator will show signal arrows on the graph at the crossing of Awesome Oscillator base level it has push and audible alerts and Email alert. By crossing above base level , a blue arrow will come out for the BUY, at the same time an audible signal will sound. By crossing Below base level, a red arrow will come out for the SELL, at the same time an audible signal will sound. Possibility to deactivate push and audible alerts.
MT4 version : Buy the 'Awesome cross' Technical Indicator for

Этот индикатор строит проекцию старшего таймфрейма на текущий таймфрейм. Визуализация в виде свечей. Помогает лучше понять процессы внутри рынка и его масштаб. Упрощает поиск свечных паттернов. Есть возможность включать несколько индикаторов с разными параметрами и видеть одновременно много таймфреймов. В настройках доступны изменение цвета свечей каждого из направлений и их толщина. Важно! Если индикатор ничего не рисует, то либо параметр таймфрейм выбран не верно (он должен быть больше чем те

Потому что стиль имеет значение
Я знаю, как надоедает каждый раз нажимать свойства, чтобы изменить цвет свечи, фон на светлый или темный, поставить или убрать сетку. Вот решение, которое можно найти одним щелчком мыши: Три настраиваемые кнопки для выбора нужного трейдерам стиля свечи. Одна кнопка для переключения между дневным и ночным режимом. Одна кнопка, чтобы показать или скрыть сетку на графиках. *****В настройках вы можете выбрать, где кнопки должны отображаться на экране*****. Пожалуй
FREE

The Investment Castle Chances indicator will show signals on the chart for entering a buy or sell trade. There are 2 types of signals for each direction as follows: Buy / Sell (Orange colored candlesticks) Strong Buy (Green colored candlesticks) / Strong Sell (Red colored candlesticks) You may place a buy trade once you see the Buy arrow or vise versa, or you might prefer to wait for a further confirmation “Strong Buy” / “Strong Sell”. This indicator works best with the high time frames H1,
FREE

Индикатор Urgently создан для быстрого определения ситуации на рынке, отражает состояние рынка и сигнализирует о выгодных уровнях для открытия сделок. Рыночные условия меняются достаточно быстро, требуя постоянной калибровки торговых стратегий. Рекомендуется использовать совместно с любым из осцилляторов. Трендовый индикатор рынка форекс Urgently показывает направление тренда и точки входа. Он сглаживет колебания цены при формирования сигнала путем усреднения данных и сигнала только в определен

'Circle Rising Point' is an indicator based on the cycle theory. No matter whether your trading cycle is short or long, you can use this indicator to find the rise and fall points of different cycles and different bands. Therefore, the signals displayed to you on charts of different cycles are different, and applicable to left side transactions. This indicator is recommended to be used together with the multi cycle window for analysis. Indicator introduction Applicable products This indicator is
FREE
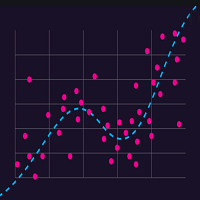
Канал Регрессии состоит из двух линий, равноудалённых сверху и снизу от линии тренда регрессии. Расстояние между границами канала и линией регрессии равно значению отклонения максимальной цены закрытия от линии регрессии, только это определение соответствует самим свежым точкам регресии.
Термин регрессии относится к области статистики. Центральная линия канала является линией тренда. Для ее расчета используется метод наименьших квадратов. Линия, расположенная выше центральной, выступает сопр

Лучший инструмент для ловли стрелы и ударов шипов, как профессионал !!!
Вы хотите стать трейдером с постоянным бумом и крахом Это расширенный индикатор, используемый для предварительного обнаружения всплесков индексов бума и падения. Он предупреждает о входах с высокой вероятностью с удивительной вероятностью успеха. Мы рекомендуем использовать виртуальный частный сервер для круглосуточного получения уведомлений по электронной почте или телефону.
Как торговать с Mega Spikes Max 1.4? Ког

The utility helps to locate in the lower time frames the maximum and minimum of the upper time frame. The length of time frame level line represents the temporal length of the upper time frame. It's possible to OnOff the levels with a button or keys
The indicator draws lines that delimit the upper time frames candle and highlights his high-low price and the pips candle range. How it works:
Firstly . Choose which time frames levels to represent in the lower ones : monthly, weekly, da

The Pirates MACD is a Momentum Indicator that shows us not just the Classical MACD, it also shows us high priority trades. the user has an option of selecting among several options the best settings that suits their trading style, even if one has no trading style, Pirates always find a way to survive hence the Pirates MACD is equipped with easy to understand tools. that reduce the strain on ones analysis giving them visual advantages over classical MACD techniques.
This product is made as an
FREE

Este poderoso indicador analisa o gráfico e mostra zonas de Rejeição de Preços! Isto é, locais onde o preço foi, mas não foi aceito pelo mercado! A visualização desta zona de Rejeição, facilita o entendimento do trader na tomada de decisões de onde operar e como operar!
O indicador é composto por 4 linhas, sendo classificadas em 2 grupos: Linhas Vermelha e Amarela: Denotam os extremos onde o preço conseguiu chegar, mas não foi aceito! Linhas Laranja e Azul: A partir delas, denotam o Início da
FREE

Мультивалютный и мультитаймфреймовый индикатор Moving Average (MA). На панели вы можете видеть текущее состояние индикатора — прорывы и касания (ценой) Быстрой МА и Медленной МА, а также пересечение линий МА между собой. В параметрах можете указать любые желаемые валюты и таймфреймы. Также индикатор может отправлять уведомления о касании ценой линий и о их пересечении. По клику на ячейке будет открыт данный символ и период. Параметры
Fast MA
Averaging period — период усреднения для вычислен

Chart Symbol Changer для MT5 - это индикатор / утилита, которая предлагает вам возможность изменить текущий графический символ, на который прикреплен, одним нажатием кнопки символа на его панели. Chart Symbol Changer для MT5 дает вам возможность настроить кнопки с 32 символами в соответствии с вашими личными предпочтениями, добавив пары, за которыми вы хотите следить и торговать чаще. Таким образом, вы никогда не упустите возможность, потому что вы можете быстрее просматривать рынок на св
FREE

Ценовой канал - это основной инструмент трейдера для анализа текущей ситуации на рынке. С его помощью можно успешно прогнозировать будущее поведение цены, однако основным фактором получения прибыли являются своевременно принятые решения. Зачастую это и является проблемой, потому что постоянно смотреть в монитор просто невозможно. Данный индикатор строит и обновляет автоматически два трендовых канала с разными периодами(быстрый и медленный). Определение тренда осуществляется при помощи линейной

Golden Star MT5 - это профессиональный трендовый индикатор для платформы MT5, разработанный группой профессиональных трейдеров. В основе алгоритма его работы - оригинальный авторский метод, позволяющий с высокой вероятностью находить потенциальные точки разворота тенденции и получать сигналы на вход в рынок в начале формирования тренда. Этот индикатор подойдет для работы на золоте, криптовалюте и валютными парами на Forex. Система оповещений (алерт, уведомления на почту и мобильный телефон) пом
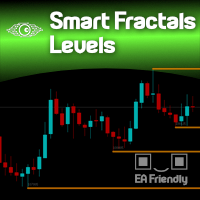
Support & Resistance taken to the next level. The Smart Fractals Levels indicator is based on Bill Williams' theory of identifying Support & Resistance levels through the use of the so-called "fractals". The difference between common Support and Resistance regions drawn on chart and the Smart Fractals Levels is that only NEW and untouched levels will still stay drawn on the chart (if you decide so), and also based on your own set of rules, totally configurable from the "settings" menu of the ind

Hello, This indicator is a unique high reliability 7-in-1 multicurrency indicator comprising these sub-indicator’s: A Trend Power Crossover Indicator. A Percent Change Crossover Indicator. A Currency Overbought/Oversold Indicator. A Currency Deviation Indicator. A Currency Impulse Signal Indicator. A Trend Power Indicator. A Currency Volatility Indicator. The main advantage of this indicator is that it's reasoning by currency and not by currency pair. The values of each sub-indicator are calcula
FREE
Draw Candle Можете ли вы представить себе прямую корреляцию на том же графике, когда вы видите актив и в то же время видите другой актив? Итак, вы нашли нужный индикатор. Этот индикатор будет рисовать актив, который вы выбираете и который у вас есть в брокерской компании, на графике другого актива. Просто откройте график своего торгового актива, которым, например, может быть EURUSD, добавьте этот индикатор на график и в переменной «Correlated Pair» добавьте нужный актив, который в этом примере м

We at Minions Labs love to study, challenge and discover new facts about Price Behavior in current markets. We would NOT call it Price Action because today this is a word totally overused and means, thanks to the False Prophets out there, absolutely NOTHING.
The study hypothesis we propose is this: Some Assets, in certain Timeframes, present a behavior of Price continuity when the candlesticks close without a Wick on them... So the purpose of this indicator is to "color" those candlesticks wh
FREE

1. What is this Rising volatility and falling volatility are not the same, whether it is academic research or actual testing has shown this point. The original ATR indicator is calculated by putting up and down fluctuations together. This indicator is to calculate separately the upward volatility and the downward volatility, which can better help you study the market.
2. Indicator description There are two modes for the calculation of this indicator, as shown in the f

This indicator shows supports and resistences calculated form historical data when market was swing. When market was swing ? When ADX was below 25 for some bars. In fact market can be considered without a trend. I mean and suggest timeframes H4 and Daily. Using that lines in the present you see resistance and support. More lines are distant and best is possible profit. Every ADX parameters can be set, so colors, swing market bars number.
I am available to get feedback or modify code. Thanks Al

The Bolliger Bands On-Off let you control the indicator using the keyboard or a button . You can choose if you want the indicator always shown or always hided while switching among different time frames or financial instruments . ---> This indicator is part of Combo Indicator OnOff
The Bollinger Bands identify the degree of real-time volatility for a financial instruments . A lower amplitude corresponds to a low volatility, conversely a greater bandwidth corresponds to high volatility
FREE
MetaTrader Маркет - лучшее место для продажи торговых роботов и технических индикаторов.
Вам необходимо только написать востребованную программу для платформы MetaTrader, красиво оформить и добавить хорошее описание. Мы поможем вам опубликовать продукт в сервисе Маркет, где его могут купить миллионы пользователей MetaTrader. Так что занимайтесь только непосредственно своим делом - пишите программы для автотрейдинга.
Вы упускаете торговые возможности:
- Бесплатные приложения для трейдинга
- 8 000+ сигналов для копирования
- Экономические новости для анализа финансовых рынков
Регистрация
Вход
Если у вас нет учетной записи, зарегистрируйтесь
Для авторизации и пользования сайтом MQL5.com необходимо разрешить использование файлов Сookie.
Пожалуйста, включите в вашем браузере данную настройку, иначе вы не сможете авторизоваться.