Смотри обучающее видео по маркету на YouTube
Как купить торгового робота или индикатор
Запусти робота на
виртуальном хостинге
виртуальном хостинге
Протестируй индикатор/робота перед покупкой
Хочешь зарабатывать в Маркете?
Как подать продукт, чтобы его покупали
Новые технические индикаторы для MetaTrader 5 - 53

The Market Sessions Indicator for MT5 helps you predict market turnarounds by detecting major supply and demand areas. These pivot points tend to occur after a new session has started and the previous one is still open. It is also used to gauge how many points or pips the market moves on average during a session. This helps us to place better our take profits and stop losses. The indicator works on all forex pairs, gold, silver, commodities, stocks, indices and any other instrument that your

GIVE A LOOK TO MY OTHER PRODUCTS ! 100 % PER MONTH PROFIT---- MY NEW SIGNAL HERE -------> https://www.mql5.com/en/signals/2162238?source=Site+Signals+My# MACD Cross Alert is a tool indicator that notificate directly to your phone whenever the signal line crosses the base line. For more accurate signals,crosses are filtered like this : Buy Signal : SIGNAL LINE CROSSES ABOVE BASE LINE AND BOTH ARE ABOVE THE 0 VALUE Sell Signal : SIGNAL LINE CROSSES BELOW BASE LINE AN

GIVE A LOOK TO MY OTHER PRODUCTS ! 100 % PER MONTH PROFIT---- MY NEW SIGNAL HERE -------> https://www.mql5.com/en/signals/2162238?source=Site+Signals+My# Breakout Wall is a very cool indicator. It paints a resistance and a support in the chart given by a " n " number of candles ( you can choose the parameter ),and give you an alert when a candle closes below a support or above a resistance.Very important tool if you trade daily candles for example..... Just close your pc and don'
Мультивалютный индикатор в отдельном окне отображает движение валютных пар в пунктах с расхождением от начала дня. Во время работы, динамически возможно включать и отключать различные пары прямо на графике. При первом запуске, возможно, потребуется продолжительное время, пока загрузиться история для основных валютных пар. Расчет всех кроссов происходит на основе мажоров. Для валют CAD, CHF, JPY - график перевернут. При повторном открытии, все настройки индикатора восстанавливаются автоматически.
FREE
Мультивалютный индикатор в отдельном окне отображает движение валютных пар в пунктах с расхождением от начала дня. Во время работы, динамически возможно включать и отключать различные пары прямо на графике. При первом запуске, возможно, потребуется продолжительное время, пока загрузиться история для основных валютных пар. Для валют CAD, CHF, JPY - график перевернут.
При повторном открытии, все настройки индикатора восстанавливаются автоматически.
FREE

Это инновационный индикатор измерения силы валют от INFINITY является незаменимым помощником для скальперов и трейдеров торгующих в долгую.
Система анализа Силы/слабости валют давно известна и применяется на рынке ведущими трейдерами мира. Любая арбитражная торговля не обходится без этого анализа.
Наш индикатор легко определяет силу базовых валют по отношению друг к другу. Он выводит линейные графики по всем или по текущей паре валют, позволяя проводить мгновенный анализ и поиск наиболее силь
FREE
Индикатор Channel Forex разработан с учетом экстремальных ценовых значений за определенный период.
Индикатор состоит из трех четко окрашенных линий, которые напоминают полосы Боллинджера.
Основные торговые сигналы
Сигнал на покупку: открывайте длинную позицию, когда цена открывается и закрывается выше средней средней линии индикатора, и торгуется вдоль верхней границы канала.
Сигнал на продажу: открывайте короткую позицию, когда цена открывается и закрывается ниже средней средней синей

RSI ALARM (для Metatrader 5)
Этот индикатор работает как обычный RSI со всеми его настройками (периодичность, цвета, уровни и т. Д.),
но, кроме того, сигналы тревоги могут быть установлены на верхнем и нижнем уровнях (Примеры 70 и 30), с возможностью регулировки этих уровней, перемещая синюю и красную линии, чтобы установить верхний и нижний уровни.
Вы также можете включать и выключать дополнительную функцию, которая создает стрелку на графике при достижении ожидаемого верхнего или нижнег
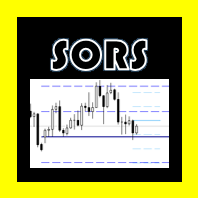
КОМПЛЕКСЫ СОРС (для Metatrader 5)
Этот индикатор предназначен для рисования линий SORS на графике, это современный способ расчета рыночных точек, который он обычно уважает, они состоят из поддержек и сопротивлений, но в отличие от классических, они рассчитываются на основе эндогенной волатильности и стандартного отклонения,
В конфигурации вы можете изменить цвет каждого уровня линейно и скрыть те, которые не нужны.
A = Годовой.
M = Ежемесячно.
W = еженедельно
D = Ежедневно.

Индекс Относительного Равновесия, REi — индикатор технического анализа, показывающий направление и силу тенденции и указывающий на вероятность еe смены. Он показывает отношение среднего прироста цены к среднему падению за определенный период времени. Величина индекса позволяет оценить, покупатели или продавцы сильнее влияли на цену за установленный период времени и предположить дальнейшее развитие событий. Индикатор отличается простотой интерпретации и качеством подаваемых сигналов. Точки входа,
FREE

Технический индикатор Trend Strength Analyzer измеряет отклонение цены инструмента от средних значений за определенный период времени. В основе индикатора лежит сравнительный анализ относительной силы быков и медведей. Если быки преобладают, то наблюдается восходящий тренд. Если медведи сильнее - это нисходящий тренд.
Настройки:
Strike Energy (2 сплошные линии) = 14.
Influence Power (2 пунктирные линии) = 50.
Осциллятор TSA эффективен на активном рынке. Наиболее часто используемыми ин
FREE

The Market Thermometer can be used to help traders identify sleepy or turbulent periods.
It helps beginners to check when is the ideal time to enter operations, that is, when the value of the thermometer is below its average for several periods, identifying a peaceful market. When the market is heated, that is, the thermometer is above three times its average, it is time to make profits. The Thermometer measures the extent to which the end of a period, maximum or minimum price, projects outsi
FREE

Leave a review for this product, and receive another "Free" product that you choose. You can see my other products here: https://www.mql5.com/en/users/zakri/seller
Trend Detective is an advanced trend detection indicator which shows accurate entry points in direction of trend. It uses smart technology in order to detect entry points, trend changing points, and TP points. It also shows hit rate for current chart using selected parameters. Hit rate for this indicator on different charts can be
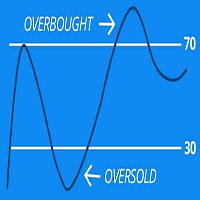
Scan all your favorite pairs with RSI, and get notified on your preferred time frames.
Settings are Customizable
Click to change time frame or open new pairs
Notification: Phone/Popup/Email The relative strength index (RSI) is a technical indicator used in the analysis of financial markets. It is intended to chart the current and historical strength or weakness of a pair/stock based on the closing prices of a recent trading period. The RSI is most typically used on a 14 period, measured on

GIVE A LOOK TO MY OTHER PRODUCTS !
100 % PER MONTH PROFIT---- MY NEW SIGNAL HERE -------> https://www.mql5.com/en/signals/2162238?source=Site+Signals+My# BROKEN TRENDLINE ALERT IS A SIMPLE TOOL INDICATOR. JUST DRAW IN YOUR CHART A DYNAMIC OR STATIC TRENDLINE,AND THE INDICATOR WILL SEND YOU ALERT WHENEVER THE PRICE CROSSES BELOW OR ABOVE YOUR DRAWN TRENDLINE. IT WORKS IN ANY TIMEFRAME AND ANY CHART YOU WANT.JUST GOT A VPS AND DON'T STRESS IN FRONT OF YOUR COMPUTER.
FOR ANY KIND OF QUESTION
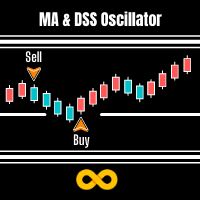
MA & DSS Oscillator is a simple system that overcomes all the market confusion by looking at the Moving Average and Double Smoothed Stochastic Oscillator. A Signal is made when the Oscillator is under 50 (A default value) and heading in same direction as the Moving Average.
The moving average is arguably the simplest but most effective tool when trading larger timeframes. We use this and the Double Smoothed Stochastic Oscillator to time our market entry.
Double Smoothed Stochastic is simila

>>> Comment ajouter des indicateurs personnalisés ou des EA à MT5 <<< > Ouvrez MT5, > allez dans Fichier> Ouvrir le dossier de données, > puis sélectionnez MQL / 5> 'Experts' ou 'Indicateurs' > et collez votre fichier MQL4 / EX4 ou MQL5 / EX5 dans ce dossier.
Lorsque vous redémarrez la plate-forme, vous devriez maintenant voir votre EA / indicateur personnalisé dans la fenêtre du navigateur.
Vous pouvez le faire glisser et le déposer sur le (s) graphique (s) de votre choix.
>>> Pour

Этот индикатор решает проблему масштабирования графика, при котором бар становится слишком тонким и становится трудно определить цены открытия и закрытия бара.
Индикатор Thick Bar - позволит менять толщину линий и цвет обводки, за счет чего можно получить более толстый бар на графике. Индикатор по умолчанию имеет толщину бара равную 2 и предустановленные цвета, которые можно менять в настройках
FREE

Добрый день. Сегодня мы предлагаем индикатор MaxlotTomson для определения максимального объема, который вы можете выставить на покупку или продажу, если смотреть на ваш уровень депозита. Данный индикатор удобно использовать для Новостной торговли, когда нужно определить точку входа на скоростном движении и рассчитать уровень риска в процентах от депозита, Индикатор MaxlotTomson показывает максимальное значение объема ЛОТА для вашего депозита который выы можете использовать для торговли.
FREE

Индикатор определяет состояние рынка: тренд или флэт.
Состояние рынка определяется с учётом волатильности.
Жёлтым цветом отображается флэт(торговый коридор).
Зелёным цветом отображается тренд вверх.
Красным цветом отображается тренд вниз.
Высота метки соответствует волатильности на рынке.
Индикатор не перерисовывается .
Настройки History_Size - размер рассчитываемой истории.
Period_Candles - количество свечей для расчёта индикатора. Send_Sound - звуковое оповещение. Send_Mail
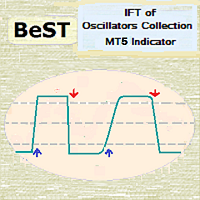
BeST_IFT of Oscillators Collection is a Composite MT4/5 Indicator that is based on the IFT ( Inverse Fisher Transformation ) applied to RSI , CCI , Stochastic and DeMarker Oscillators in order to find the best Entry and Exit points while using these Oscillators in our trading. The IFT was first used by John Ehlers to help clearly define the trigger points while using for this any common Oscillator ( TASC – May 2004 ). All Buy and Sell Signals are derived by the Indicator’s crossings of the Bu
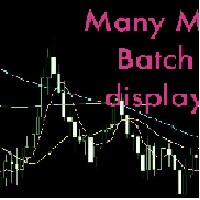
The moving average is the easiest indicator to recognize changes in the price of a currency.
It is excellent to set multiple indicators for each period or type and see the transition.
However, setting multiple moving averages is very troublesome, isn't it?
Moreover, displaying multiple currency pairs will increase the time and effort.
It is an indicator that saves you the trouble.
You can display multiple moving averages at once.
You can freely set up to 4 lines, line thickness,

The Supertrend indicator is a very versatile and and accurate trend detection system. It can also be used an an reversal indicator. Therefor you can use it either as entry or as an exit signal. Depending on your settings it is also good for trend confirmation. This version is slightly enhanced from the original version from mladen. The Supertrend of Averages Histogram Version contains: 11 different price options Averaging period
18 different averaging types ATR period and ATR multiplier Shows r
FREE

A countdown timer for the Volume bar chart generator and Tick chart generator products, which are available for download from the MQL5 Market: Tick chart generator: https://www.mql5.com/en/market/product/29215 Volume bar chart generator: https://www.mql5.com/en/market/product/47197
The counter conveniently displays the number of ticks or transactions (depending on the chart) that need to pass for a new bar to start printing.
The user can set the following indicator inputs.
Volume type
FREE

Привет. Сегодня представляем индикатор корреляции - SynchroWindowTomson. Индикатор в одном окне показывает движение нескольких инструментов, по отношению друг к другу, удобно определять направление и изменение, особенно когда вы работаете с целым портфелем разных инструментов и нужно определить какой из них тянет результат назад и движется в другую сторону. Так же видны точки разворота спреда.
FREE
Market Zones MT5 Este indicador proporciona una lectura fácil del mercado basado en niveles estadísticos de Gauss, al igual que la metodología Market Profile. Utilizando una formula exclusiva el indicador estima dinámicamente las zonas que mejor representan dónde los movimientos del mercado permanecerán la mayor parte del tiempo (aprox. 70% del tiempo). Esto nos permite mirar el mercado de una forma más simple evitando caer en movimientos no relevantes. El precio se mueve despacio dentro de la

Description :
VWAP (Volume-Weighted Average Price) is the ratio of the value traded to total volume traded over a particular time horizon. It is a measure of the average price at which pair is traded over the trading horizon. Read More.
All Symbols and All Timeframes are supported.
Indicator Inputs :
VWAP Mode : Mode of VWAP Calculation. Options can be selected : Single,Session,Daily,Weekly,Monthly
Volumes : Real Volumes,Tick Volumes
Price Type : Used price for cal

QuantXMarketScanner is a multi assets indicator for MT5
- Mathematical model based on 7 custom moving averages indicators - Adaptable on Currencies, Stocks and Crypto - Automatic setup, self optimized
About QuantXsystem Products: – Simple installation & integration into MT5 – Unlimited License after purchase (for one user) – Automatic pattern recognition to identify the best timing and price levels. – Trading indicators are displayed directly and automatica

QuantXSTocks Trading Range Indicator for MT5:
INSTRUCTIONS TO USE OUR INDICATOR:- User needs to take trade on Arrow or after an Arrow CandleStick, You can achieve up-to 35-125 pips target by this Indicator. Best Timeframes for Stocks and Indices are M30 and H1: AMAZON M30 (50 pips) TESLA M30 (50 pips) APPLE M30 (50 pips) ADOBE M30 (50 pips) NASDAQ100 H1 (125 pips) The above are the approximate amount of pips you can achieve by this Indicator, Green arrow appears to be buy arrow while the Red a
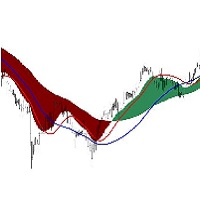
The Visual MACD Indicator is a forex technical analysis tool based on Moving Average Convergence Divergence, but it is plotted directly on the main trading chart with two macd signals. You should look for buy trades after the yellow line crosses the blue line and the MACD wave is blue. Similarly, you should look for sell trades after the yellow line crosses the blue when the MACD wave is red and the price is below the blue line . Go ahead and add it to your best trading system. It fits all
Description:
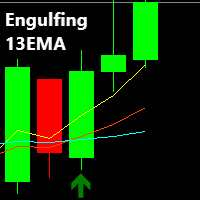
The Engulfing 13EMA is a Multi Timeframe Indicator that scans Multiple Symbols which will help you to identify potential trade set ups. As well as Forex, it can scan Crypto, Exotics, Metals, Indices, Energies or what ever else you have in your Market Watch list. You also have the option to enable/disable the time frames you want to scan. (M1,M5,M15,M30,H1,H4,D1,W1,MN1)
An alert is presented when the 13EMA passes through certain Engulfing candles, based on certain parameters wi

This is a momentum Indicator adapted to work on lower timeframes for Boom and Crash Indeecies. However the indicator can work with other Synthetic Indecies.
The indicator trend colour is set default to Aqua, then sell signal, the colour changes to red and blue signifies buy signals. .
For non Boom nor Crash Indecies use a smaller period and slightly increase the deviation.

TD Combo is better when you have sharp directional moves, because it requires only thirteen price bars from start to finish compared to TD Sequential which needs at least 22 bars. The criteria for a Setup within TD Combo are the same with those required for a Setup within TD Sequential. The difference is that the count starts at bar 1 of the setup and not from bar 9 and TD Combo requires four conditions to be satisfied simultaneously.
Requirements for a TD Combo Buy Countdown
- Close lower

ВВЕДЕНИЕ Индикатор Investment Castle был создан с надеждой на решение следующих проблем:
1. Определите правильное направление тренда на разных таймфреймах.
2. Показывает процент попаданий, процент выигрышей на графике.
3. Этот индикатор не перерисовывает график.
4. Индикатор встроен в советник Investment Castle EA .
* Посетите веб-сайт для получения установленных файлов, обновлений и многого другого: https://www.investmentcastle.com
ОТКАЗ ОТ ОТВЕТСТВЕННОСТИ «Индикатор инвестиционног
FREE

Для эффективного использования индикаторов Long и Short и получения преимуществ из корреляций между различными активами важно следовать нескольким основным этапам. Понимание основ индикатора: Ознакомьтесь с метриками и базовыми расчетами индикаторов Long и Short. Поймите, как они коррелируют валютные пары, индексы или криптовалюты и выявляют положительные или отрицательные корреляции между этими активами. Анализ корреляций между активами: Используйте индикаторы Long и Short для отслеживания корр

Индикатор синхронизирует восемь видов разметки на нескольких графиках одного торгового инструмента.
Этот индикатор удобно использовать вместе с "Multichart Dashboard" или другим похожим помощником, который позволяет работать сразу с несколькими графиками одновременно.
"Multichart Dashboard" можно найти по ссылке на моём youtube-канале.
Настройки:
включение синхронизации Vertical Line
включение синхронизации Horizontal Line
включение синхронизации Trend Line
включение синхрониз
FREE
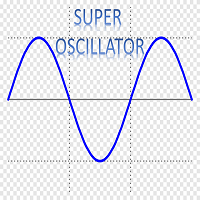
Super Oscillator , is a powerful indicator that vibrates along with the market, resulting in a very useful tool to improve and decide your trading.
You can download the demo and test it yourself.
In a versatile indicator that in a single graph shows us information about four different aspects of the market
1) 4 operational zones. The indicator divides the screen into 4 zones that allows us to properly assess the moment of the market. a) Pullback Buy Trend. If the indicator is ab

Smoothing Oscillator , is a powerful indicator that vibrates along with the market, resulting in a very useful tool to improve and decide your trading. This indicator is a smoothed version of the Super Oscillator MT5 that you can download at this link https://www.mql5.com/es/market/product/59071 The idea of this indicator is to smooth and limit the aggressiveness of the previous indicator, it has less power in terms of pullback points but has more power to detect trends and consolidations Yo

Индикатор строит графический анализ на основании теории Фибоначчи.
Фибо-Веер служит для анализа импульсов и коррекций движения.
Разворотные линии (2 линии у основания веера фибоначчи) служат для анализа направления движений.
Индикатор отображает 4 целевых линии в каждом направлении.
Индикатор учитывает волатильность на рынке.
Если цена выше разворотных линий, имеет смысл рассматривать покупки, если ниже, то продажи.
Открывать позиции можно после пробоя, отбоя или тестировани

Long & Short Indicator, tracks the movements of assets that have positive or negative correlation allowing to explore displacement in advance.
- High Hit Rate With Real Time Information.
- More Safe Entries in Operations.
- Facilitates Short and Long Term Reading.
- Option to trigger alert for the Levels.
Information for Ea
Buffer Symbol 1ª = 0 ;
Buffer Symbol 2ª = 2 ;
* Free version only EURUSD!
FREE

Индикатор строит гибкие уровни поддержки и сопротивления (точками). Для построения используется особая фаза движения. Уровни формируются динамически, то есть, каждая новая свеча может продолжить уровень или завершить.
Уровень может оказывать сопротивление или поддержку цене даже там, где его уже нет. Также уровни поддержки и сопротивление могут меняться ролями.
На значимость уровней влияют: количество времени формирования уровня и количество касаний.
Важность уровней заключается в том,

Control Trading Support And Resistance
Es un indicador independiente del TimeFrame que permite proyectar niveles más relevantes del mercado en función del plazo de tiempo de la operativa. Los colores del indicador están escogidos para diferenciar entre los diferentes tipos de niveles y destacar a los más relevantes. Este indicador permite visualizar en un mismo gráfico los posibles objetivos relevantes que los diferentes traders pueden emplear siguiendo diferentes tipos de operativas en funci

The indicator scans for TD Combo signals in multiple timeframes for the all markets filtered and shows the results on Dashboard. Key Features Dashboard can be used for all markets It can scan for signals on MN1, W1, D1, H4, H1, M30, M15 ,M5, M1 timeframes Parameters UseMarketWatch: Set true to copy all symbols available in market watch MarketWatchCount : Set the number of symbols that you want to copy from the market watch list. CustomSymbols: Enter the custom symbols that you want to be availa
T D Sequential indicator consist of two components. TD Setup is the first one and it is a prerequisite for the TD Countdown – the second component.
TD Setup TD Setup compares the current close with the corresponding close four bars earlier. There must be nine consecutive closes higher/lower than the close four bars earlier.
1- TD Buy Setup - Prerequisite is a bearish price flip, which indicates a switch from positive to negative momentum.
– Af

The indicator scans for TD Sequential signals in multiple timeframes for the all markets filtered and shows the results on Dashboard. Key Features Dashboard can be used for all markets It can scan for signals on MN1, W1, D1, H4, H1, M30, M15 ,M5, M1 timeframes Parameters UseMarketWatch: Set true to copy all symbols available in market watch MarketWatchCount : Set the number of symbols that you want to copy from the market watch list. CustomSymbols: Enter the custom symbols that you want to be a

This utility is a universal meta-indicator that enables you to use any other indicator calculated over the higher timeframe (HTF) data. Now you may find precise entries and exits on working timeframe with no need of switching to a higher timeframe. You no longer need to purchase HTF version of you favorite indicators.
Indicator parameters: inp_ind_name - name of the indicator that should be calculated on the selected timeframe. You can choose from: the list of built-in indicators (e.g. MA for

This utility is a universal meta-indicator that enables you to use any other indicator calculated over the higher timeframe (HTF) data. Now you may find precise entries and exits on working timeframe with no need of switching to a higher timeframe. You no longer need to purchase HTF version of you favorite indicators.
Indicator parameters: inp_ind_name - name of the indicator that should be calculated on the selected timeframe. You can choose from: the list of built-in indicators (e.g. M

Добрый день. Мы подготовили новый продукт для трейдеров и аналитиков рынка. Наш индикатор VolumeSpreadtompson - создан для того, что бы увидеть влияние институциональных игроков рынка на действующую цену. Индикатор показывает уровни изменения спреда в единицу времени при влавающих его значениях. Практика показывает, что изменение объемов связано с предупреждением и опережением спекулятивной активности, особенно в ключевые моменты: новости ФРС, новости нефти, выступления лидеров стран идр. Спаси
FREE

THE SOUND OF MARKET is an indicator designed to detect the sound produced for the market movement. This system detects the background sound produced by market movements in real time to decide in your operation. In addition, by analyzing the sound recorded in the indicator, we can detect operational patterns. You can download the demo and test it yourself.
The indicator has a text help in the upper right corner, in which it shows whether the indicator has a bullish or bearish backgro

This indicator is a simple tool to spot a possible trend.
When the ribbon below the price bars, It will turn to Green color and the trend is seen to be bullish When the ribbon above the price bars, it will turn to Red color and the trend is seen to be bearish. It can be used a either Entry Signal Exit Signal or trailing stop, so it is very versatile. By default color : Green is UP trend and Red is Down trend and this work perfect with Bar4Colors.ex5
FREE

Micro Demo ******************* Секундные графики в Meta Trader 5 ********************** Более точного инструмента для входа в сделку вы не найдёте. Платная полная версия: Micro "Second charts" В демоверсии секундные периоды сменяются случайным образом через случайные интервалы времени. Отсутствует автоматическая настройка периодов бесплатных индикаторов.
Входные параметры: Displayed bars - отображаемые бары Step of price levels, pp, 0-off - шаг отрисовки ценовых уровней, пункты Scale
FREE

Micro ******************* Секундные графики MT5 ********************** Более точного инструмента для входа в сделку вы не найдёте. Входные параметры: Timeframe, sek - период построения графика, секунды Displayed bars - отображаемые бары Step of price levels, pp, 0-off - шаг отрисовки ценовых уровней, пункты Scale points per bar, 0-off - масштаб в пунктах на бар Show lines - отображение текущих уровней Show comment - отображение комментария Standard color scheme - стандартная цветовая сх
Pullback Probability It is an indicator that shows us the probability that the price will t urn around and we can operate that market turn.
The indicator marks a line that oscillates between a percentage of 0% to 100%.
The one indicated in the upper left corner shows us a help in which it informs us of the area in which the price is in real time, as well as the percentage that the candle is open. You can download the demo and test it yourself.
The indicator marks 6 work zones. 1) Above 80

Are you tired of drawing Support & Resistance levels for all charts of the same Symbol while doing Multi-Timeframe analysis? Well, if you are Price Action trader then this indicator will solve your problem. Draw on 1 Timeframe and it will auto-sync with other charts of the same Symbol. You can draw rectangles, lines, arrows, and eclipse. It will give an alert when touched/break on line and arrow. It work's on all Timeframe.
Major Update
Added::
1}Triangle
2}Fibonacci Retracement
3}

Вилка Нео v5, разрабатывалась для торговой системы "Оракул", но постепенно дополнялась, например - углами Ганна и другими опциями... Можно создавать графические объекты с заданным цветом, стилем и толщиной, такие как: прямоугольники с заливкой и без, отрезки трендлиний и нестандартный инструмент - "вилка Нео" в виде трезубца, так же есть возможность интерактивно настраивать цветовую палитру прямо с графика, настраивать видимость объектов для разных ТФ, толщину и стили...
Панель переключается к
FREE

DNA is an indicator that allows us to operate both in favor of a trend and a pullback. You can download the demo and test it yourself.
Trend trading is above zero and pullback trading is below zero.
The direction of the operation is marked by the color of the line.
If the line is green it corresponds to purchases.
If the line is red it corresponds to sales.
For example, if the green line is above zero and growing, we will have an uptrend operation. If the red line is above zero and

You ask yourself the question every time you open your charts: how to win in trading? Will using a lot of indicators work? well know that I also asked myself the same questions when I first started trading. After testing many indicators, I realized that winning trading is simple and accurate trading. after several months of thinking and optimizing I was able to find my solution: Candle Good Setup Candle Good setup is a trend and entry timing indicator analyzing the market in multi-frame to give

MACD ******************** MACD для платформы секундных графиков Micro . ********************* Секундный график на порядок увеличит точность ваших входов и выходов. Секундный период , в привычном формате, позволит увидеть то, что ранее было скрыто. Бесплатные индикаторы, дополнят визуальную картину, что, в совокупности выведет вашу торговлю на новый уровень. Идеально подходит как скальперам, так и трейдерам торгующим внутри дня. Индикатор MACD для платформы Micro. Входные параметры:
FREE

Volumes ******************* Volumes для платформы секундных графиков Micro . ********************* Секундный график на порядок увеличит точность ваших входов и выходов. Секундный период , в привычном формате, позволит увидеть то, что ранее было скрыто. Бесплатные индикаторы, дополнят визуальную картину, что, в совокупности выведет вашу торговлю на новый уровень. Идеально подходит как скальперам, так и трейдерам торгующим внутри дня. Индикатор Volumes для платформы Micro. Входные парам
FREE

Moving Average ******************* Moving Average для платформы секундных графиков Micro . ********************* Секундный график на порядок увеличит точность ваших входов и выходов. Секундный период , в привычном формате, позволит увидеть то, что ранее было скрыто. Бесплатные индикаторы, дополнят визуальную картину, что, в совокупности выведет вашу торговлю на новый уровень. Идеально подходит как скальперам, так и трейдерам торгующим внутри дня. Индикатор Moving Average для платформы Micr
FREE

MOUNTAINS:It is an indicator that detects market consolidations prior to a movement.
The objective of this indicator is to indicate the areas before the market makes a move.
The areas that we are interested in detecting are the PLATEAU, which are between the slopes.
When the system detects a PLATEAU , the trader must place his operation in that area, waiting for the increase in volatility to reach its target.
The best option to carry out the operation of the PLATEAU is th
QXSTREND Our "Support and Resistance" indicator shows the support and resistance levels using the ADX indicator, and create an arrow based on three ADX Periods on different levels.
Recommended TIMEFRAMES:- M15,M30 and H4 (For Long Term Target) 120 pips & Approximately M5 (For 30 Pips target) ENTRY SIGNALS:- You need to take trade based on Arrows if Green Arrow occurs then you need to buy if Magenta Down Arrow occurs then sell trade.
About QuantXsystem Products: – Simple installatio

Prices move for many reasons and these can vary from one operator to another: software, private and institutional traders simultaneously contribute to the formation of the price, making predictive art very difficult. However, there are measurable factors that bind the price to an underlying trend in line with the physical reality that the financial asset represents: these are the macroeconomic indicators. Large investors use this information wisely to set their strategies. Understanding these m

Crash 1000 Alert is an indicator that alerts trader when price is in the CRASH ZONE. The defaults settings work best only on Crash 1000 Index but are also fully customizable.
How to use: When price enters the crash zone, the indicator will send out messages of a potential crash. Traders can use this info to enter sell trades and capitalize on the spike down. Notifications and alerts are sent to your mobile device and platforms respectively. NB: please make sure notifications are enabled

Если вы являетесь активным трейдером и ищете эффективный способ интерпретации движений на финансовом рынке, вам понравится познакомиться с Weis Wave Box. Этот удивительный индикатор разработан для предоставления четкого и точного визуального анализа объемных волн, вместе с построением соответствующих точек разворота. С пятью настраиваемыми формами разворота и другими уникальными функциями Weis Wave Box выделяется как незаменимый инструмент для опытных и новичков трейдеров.
Одной из заметных о

Мультивалютный и мультитаймфреймовый индикатор Канала Стандартных Отклонений (Standard Deviation Channel). Отображает текущее направление рынка. На панели вы можете видеть прорывы и касания (ценой) уровней канала линейной регрессии. В параметрах можете указать любые желаемые валюты и периоды. Также индикатор может отправлять уведомления при касании уровней. По клику на ячейке будет открыт данный символ и период. «Канал стандартных отклонений строится на основе Тренда Линейной Регрессии, которая

Индикатор определяет направление движения цены, обсчитывает по внутренней формуле возможность входа в рынок и отображает сигнал входа на пробой. Сигналы индикатора появляются как при начале трендовых движений, так и в обратном направлении, что позволяет максимально эффективно открывать и закрывать ордера в любом из состояний рынка. Версия для MT4: https://www.mql5.com/ru/market/product/58349 Преимущества: уникальная формула расчета сигнала; высокая точность сигнала; не перерисовывается, не запаз
FREE

The 4 headed dragon is an indicator that has two functions. 1) Set the background trend. 2) Mark the predominant trend. By combining these two indicator signals, we will be able to trade for or against the trend, adapting the signals to your reading of the market.
You can download the demo and test it yourself.
1) Set the background trend.
Define four possibilities of trend that are the four heads of the dragon, marked by colors on the indicator, marking a) Powerful buying trend. b)
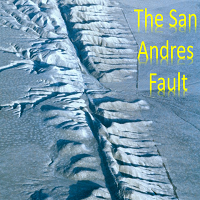
The San Andres Fault is an indicator designed to detect the movements that make the market tremble. This system detects a tremor and marks its intensity in real time to decide in your operation. In addition, the recording of the sismic signal allows us to interpret movement patterns that help us in decision making You can download the demo and test it yourself.
The indicator has a text help in the upper right corner, in which it shows whether the indicator has a bullish or bearish b

This indicator will create bars in 4 deference colors. The Green Bar is Up Trend. The Red Bar is Down Trend. Lite Green Bar is No Trend (corrective or sideway) but still in Up Trend. Pink Bar is No Trend (corrective or sideway) but still in Down Trend. You can just looking at the Bar's Color and Trade in Green Bar for Long Position and Red Bar for Short Position. You can change all the colors in your way. 1. Alert function : Will popup Alert Windows and play sound when the Bar was changed.
MetaTrader Маркет предлагает каждому разработчику торговых программ простую и удобную площадку для их продажи.
Мы поможем вам с оформлением и подскажем, как подготовить описание продукта для Маркета. Все продаваемые через Маркет программы защищаются дополнительным шифрованием и могут запускаться только на компьютере покупателя. Незаконное копирование исключено.
Вы упускаете торговые возможности:
- Бесплатные приложения для трейдинга
- 8 000+ сигналов для копирования
- Экономические новости для анализа финансовых рынков
Регистрация
Вход
Если у вас нет учетной записи, зарегистрируйтесь
Для авторизации и пользования сайтом MQL5.com необходимо разрешить использование файлов Сookie.
Пожалуйста, включите в вашем браузере данную настройку, иначе вы не сможете авторизоваться.