Смотри обучающее видео по маркету на YouTube
Как купить торгового робота или индикатор
Запусти робота на
виртуальном хостинге
виртуальном хостинге
Протестируй индикатор/робота перед покупкой
Хочешь зарабатывать в Маркете?
Как подать продукт, чтобы его покупали
Новые технические индикаторы для MetaTrader 5 - 50

this indicator has the finality of show in graph the size of candle in formation to show the force of market in some moments of the day. This indicator is free and based on example disponible on the comunity. I'm disponibilizing here to anyone who don't know about programing. Please enjoy this indicator and leave a coment or a rate to help this indicator to other people who needs.
FREE

Ichimoku Genius (imG)
is a very Intelligent Indicator for the Perfect Entry & Exit. This is strongly recommended to: Check the Video properly to understand the Indicator setup, how does it work and exactly how to take Entries and Exit according to this Indicator. Please use this Indicator with "Pivot Points" & "Kijun-Sen" to get the Best result. Always give preference to Long Flat area of "KIJUN SEN" Line as this is act like a strong Support -or- Resistance.
Steps to Setup the Indicator: Ins

A simple and efficient indicator that plots and updates the 50% of the current day, for those who use this point as a reference in day trading.
On trend days the 50% region tends to be a good resistance point, ideal for making new entries.
On non-trend days (sideways) the 50% region is great for carrying out positions.
In addition, for study or back-testing criteria, you can define the amount of previous days to be plotted by the indicator.
For questions or suggestions, please contact us. A
FREE
RSI Traffic Lights Dashboard Trend is you friend, one of the classical Trend following is the Relativ Streng Index (RSI). With RSI Traffic Light Dashboard you get an Overview how the current trend is moving for several Pairs. How many pairs you monitor, can be configured in Indicator settings. The order of symbols is equivalent to your Market Watchlist. The RSI Traffic Light Indicator alerts you if the trend is changing for your pair. Alert can be switched on/off
Important: Get informed about n

This Indicator help you to identify trends and patterns. It shows the short-term, medium-term and long-term trend at the same time on the screen. It supports every timeframe except monthly. This indicator NOT implement the ZigZag indicator, but it uses its own algorithm.
Supported markets: - Forex - Metal - Energies Spot - in Energies Futures only o US Crude Oils - in Indices Spot only o US Tech 100 Index o UK 100 Index o US Wall Street 30 In
Tracker Candle Signal est un indicateur simple et pratique, capable de déterminer le mouvement des acheteurs et vendeurs, A savoir, qui aura le dessus à la fin de la chaque bougie en fonction de l'unité de temps choisi. Il est très précis sur les grandes unités de temps 1H, 4H, Daily. En effet, je l'utilises en daily pour comprendre le comportement du marché puis en 1H pour prendre position. Surtout n'hesitez pas à me faire un retour après utilisation.
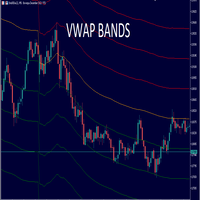
Este indicador contém 6 desvios, ótimo para ativos de alta volatilidade, podendo alterar as cores dos desvios como a largura da linha.
VWAP (Volume Weighted Average Price) nada mais é do que uma média móvel ponderada pelo volume das negociações de um ativo. Esse indicador é um dos mais utilizados pelos grandes investidores – na sua maioria institucionais –, pois permite ampla visualização da liquidez e dos pontos de interesse do ativo em análise. O volume é um dos elementos ma

Индикатор дивергенции 10 разных индикаторов. Поиск и отображение классических и скрытых дивергенций. Индикаторы, в которых производится поиск дивергенций: MACD; MACD Histogram; RSI; Stochastic; CCI; Momentum; OBV; VWmacd; Chaikin Money Flow; Money Flow Index. Это реплика индикатора с ресурса tradingview , адаптированная под терминал MT5. MT4-версия доступна здесь: https://www.mql5.com/en/market/product/87846 Настройки: Bars in history for analysis - количество баров для анализа; Divergence Ty

Are you tired of drawing trendlines every time you're analyzing charts? Or perhaps you would like more consistency in your technical analysis. Then this is for you. This indicator will draw trend lines automatically when dropped on a chart. How it works Works similar to standard deviation channel found on mt4 and mt5. It has 2 parameters: 1. Starting Bar 2. Number of bars for calculation The starting bar is the bar which drawing of the trend lines will begin, while the number of bars for c
FREE

Indicator Introduction: The indicator comes from network ,It is more stable relative to RSI or CCI. You can set the indicator to send emails/notifications/alerts when the previous bar has an up or down arrow, you can specify the text of emails by inputing string into the parameter box of "UpMessages/DownMessages". It can be used to analyze market trend and design new expert that is based on trend. If the indicator below the axis ,this is a buy zone. The trend indicator is suitable for M1 and ab
FREE

Точки входа Trend ML нужно использовать как точки потенциального разворота рынка. Индикатор работает используя функцию циклично-волновой зависимости. Таким образом, все точки входа будут оптимальными точками, в которых изменяется движение.
Самым простым вариантом использования индикатора является открытие сделки в сторону существующего тренда. Наилучший результат дает сочетание индикатора с фундаментальными новостями, он может выступать в качестве фильтра новостей, то есть показывать насколь

The Squeezer indicator simply draws ascending lines with Sell signal in the downtrend and descending lines with Buy signal in the uptrend to catch the pullbacks and sniper entries. This is a common successful trading strategy being used by many successful traders, and the good thing about this strategy is that it works with all time frames. The difference is in the take profit level between them. Buy / Sell signals are triggered at the close of the current candles above / below the ascending or

Trend Hunter использует в своей основе процесс выявления скорости изменения роста цены и позволяет найти точки входа и выхода с рынка.
Индикатор был создан на основе оригинальных индикаторов поиска экстремумов, индикатор хорошо подходит для определения разворота или большого резкого рывка в одну из сторон благодаря ему вы будете знать когда такое произойдет он вас уведомит появлением точки синего цвета на покупку красного на продажу.
Фундаментальный технический индикатор, который позволяет

Promotion $66 lifetime for you.
The principle of this indicator is very simple: detecting the trend with Moving Average, then monitoring the return point of graph by using the crossing of Stochastic Oscillator and finally predicting BUY and SELL signal with arrows, alerts and notifications. The parameters are fixed and automatically calculated on each time frame. Example: If you install indicator on EURUSD, timeframe M5: the indicator will detect the main trend with the Moving Average on this ti

Pivot Point Super trend it can be used to catch price turning points and can show arrows for buying and selling. calculations are based on price peaks . you can control the price turning points by increasing the Pivot point period input on the indicator the ATR factor is for how far apart do you want the bands to be spread apart price break outs are also spotted in their early stages which will make trading much better
FREE
RSI Traffic Light Indicator tracks several RSI ( Relativ Streng Index) Periods and informs you, if the trend is changing. Trend is you friend, one of the classical Trend following is the Relativ Streng Index (RSI). With RSI Traffic Light Indicator you will get information about trendchange. The RSI Traffic Light Indicator alerts you if the trend is changing for your pair. Different trendchange criterials and visualisation themes inclusive. Your can adjust the indicator Trendchange criterials by

Hello;
Tw79 time zone pivot strategy indicator finds important breakdowns and ensures the continuity of the total profit target by maintaining the profit margin in the same direction after the breakdowns.
Indicator input descriptions;
Start Hours: Indicates the start and reference point. Use a number zero or one.
Offset: It expresses the number of bars to be calculated after the reference. Average values are between 55-144.
Number of bar: It represents the last candle to be calculated for

ПОСМОТРИТЕ НАШ НОВЫЙ СОВЕТНИК : : https://www.mql5.com/ru/market/product/95095?source=Unknown#description
Индикатор показывает время до закрытия свечи, а также время сервера на текущем графике. Очень прост в использовании, всего четыре настройки:
Lable Location- расположение таймера на графике; Display server time- показывать время сервера или нет; Sound alert when the candle is closed- использовать звуковой сигнал при закрытии свечи или нет; Colour -цвет цифр таймера. Другие полезные беспла
FREE

Xtrade Trend Detector is an indicator capable of finding the best opportunities to take a position in any stock market. Indeed, it is a great tool for scalpers but also for Daytraders. You could therefore use it to identify areas to trade, it fits easily on a chart. I use it to detect trends on Big timeframes and take positions on Small timeframes. Don't hesitate to give me a feedback if you test it.

Another renko-based indicator. It returns different usable values for an EA, and is directly displayed on the main chart. Its setting is very simple: The size of the renko The number of bars taken into account The falling color The color on the rise Returned values: Buffer 0 : Value of the middle Buffer 1 : Value of the Top Buffer 2 : Value of the Bottom Buffer 3 : Direction of renko (0.0 for top ; 1.0 for bottom) Buffer 4 : Ratio of the renko, for example, if it is twice, 3 times, ro more of

ПОСМОТРИТЕ НАШ НОВЫЙ СОВЕТНИК : : https://www.mql5.com/ru/market/product/95095?source=Unknown#description
Индикатор отображает свечи заданного старшего таймфрейма, на меньших таймфреймах TF_Bar - выбор старшего таймфрейма, на основе которого будут отображаться свечи на текущем; Number_of_Bars - предельное число баров, до которого будет производиться расчет индикатора; Color_Up - цветовое отображение бычьих свечей; Color_Down - цветовое отображение медвежьих свечей; Widht_lines - тол
FREE
This indicator draws a price area in which the volume percentage was traded the day before. The chart shows the days with vertical lines and two horizontal lines to indicate the upper price and the lower price of the percentage of volume was traded the day before. The upper/lower lines start and end with the day calculated. But they are referred with the values of the day before. NOT the day in which are. With this indicator you can see where the volume moved in the day before. It uses percenti
FREE

Teniendo una entrada de precios suavizados, los cuales son procesador por un ZigZag en tiempo real, dando como resultado un suavizador ajustado a un ZigZag. Con valores de entrada (periodo) mayores se vuelve un poco lenta en M1,, Ideal para H1, H4, D1 Trabaja bien con otros suavizadores, ya que su intersección es ideal Al iniciar empiza con mayor precisión desde el momento de activación, siendo el historial (anterior) de referencia ----------------------------------------------------------------

A useful scanner/dashboard that shows the RSI values for multiple symbols and Time-frames. It can be easily hidden/displayed with a simple click on the scanner man top left of the dashboard. You can input upper and lower RSI values and the colours can be set to show when above/below these values. The default values are 70 and 30. There are also input colours for when the RSI is above or below 50 (but not exceeding the upper/lower levels
Symbols and time-frames are input separated by commas.
S
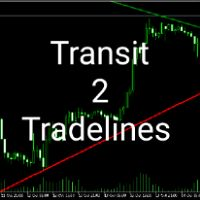
Transit2Trendline this indicator system is made to reduce the job of analyzing and to help those who can't or don't know how to draw trendlines.Transit 2 Trendlines draws only two important trendlines, support and resistance. The diagonal support is drawn in red color .The diagonal resistance is drawn in green color. Note this are very important trendlines which can easily be traded with the classic strategy of trendlines, breakout and retest. The Transit 2 Trendlines will draw patterns selected
It is a very simple indicator to display daily loss percentage, open position loss percentage, monthly loss percentage and monthly profit percentage. MT4 version
We assure you that we welcome any suggestions to improve this indicator and make the necessary changes to improve this indicator.
You can contact us via Instagram, Telegram, WhatsApp, email or here. We are ready to answer you.

MACD Scanner provides the multi symbols and multi-timeframes of MACD signals. It is useful for trader to find the trading idea quickly and easily. User-friendly, visually clean, colorful, and readable. Dynamic dashboard display that can be adjusted thru the external input settings. Total Timeframes and Total symbols as well as the desired total rows/panel, so it can maximize the efficiency of using the chart space. The Highlight Stars on the certain matrix boxes line based on the selected Scan M

Wizard Poverty Sanitizer is a moving average based indicator, using three EMA'S being 2OO EMA which is the slow EMA, the 21 EMA which is the median and the 10 EMA which is the fast. When the median and the fast EMA cross a signal is given, when the fast EMA goes above the Median EMA a buying signal is given and when the fast cross below the median a selling is given. Note that you can change the moving averages to you own choices of moving averages, allowing you to set your own MA strategy. an
FREE

Floating gain meter is the manual trading system that works with local trends and it's scalping. Histogram represents bull/bear floating trend gain. Green color histogram shows choppy market with bullish pressure, Orange - shows choppy market with bearish pressure. Lime and Red colors shows "boiled" places in market. As a rule buy arrow is placed after strong Down movement when it's power becomes weak and choppy market starts. And sell arrow is plotted after strong Up movement when it's power
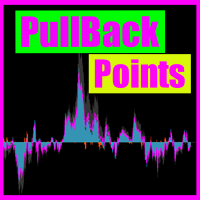
Pullback points indicator - is the manual trading system, that shows most popular market prices. Indicator measures bull/bear waves pressure and looks for "consensus" prices. As a rule these points are crossed up and down very often and opened trade has several chances to be closed in positive zone. Mainly, such points is the good base for "common profit" types of strategies. Indicator also represents "common profit" scalping method of trading as default one. Main Indicator's Features Signals

Noize Absorption Index - is the manual trading system that measures the difference of pressure between bears forces and bulls forces. Green line - is a noize free index that showing curent situation. Zero value of index shows totally choppy/flat market.Values above zero level shows how powerfull bullish wave is and values below zero measures bearish forces.Up arrow appears on bearish market when it's ready to reverse, dn arrow appears on weak bullish market, as a result of reverse expectation.
This indicator compares volumes from the same period to previous days instead of calculating the average of previous candles, so it is possible to detect volume anomalies more accurately.
I have always been bothered by seeing very large volumes at the beginning of a trading day and almost no volume throughout the day, making volume-based strategies very limited. This indicator can verify the strength of the volume of candles based on previous days, so it is possible to perceive volumes that are

Scanner and Dashboard for Money Flow Index MT5 The Money Flow Index (MFI) is a technical oscillator that uses price and volume data for identifying overbought or oversold signals in an asset. It can also be used to spot divergences which warn of a trend change in price. The oscillator moves between 0 and 100.
Advantages of the Scanner: - Full Alert Options. - Multi Timefrare - Works for all instruments including Currencies, Indices, Commodities, Cryptocurrencies and Stocks. - Fully customisabl
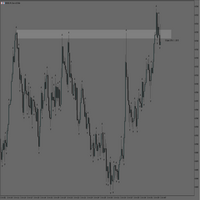
MT5 Rectangle Extender Indicator is a simple and easy tool that automatically extends any box/rectangle drawn on the chart to the right edge of the screen. This tool can be used for easy drawing of zones and can help with determining future areas of interest on the chart once price trades back to those levels. Very suitable for supply and demand, order blocks, POI's (Points of Interest) mapping on charts. Sometimes its better to have a zone than a single price level as price can shoot above or
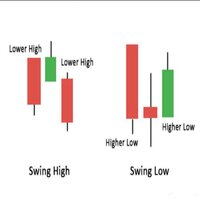
This indicator plots any and every swing high or swing low on your chart.
A swing high or low candle formation comprises of a minimum of 3 candles whereby the middle candles high/low is the highest or lowest point amongst the three candles. The direction (bullish/bearish) of the middle candle is irrelevant. Swings are very useful patterns that can be used to determine market structure as well as potential price reversal points on a chart.
This indicator is derived from the Bill Williams Fracta

This indicator draws the high intraday price and the low intraday price of the first n minutes of the day. The chart shows the days with vertical lines and two horizontal lines to indicate the max and the min close price of the n first minutes of the day. The max/min lines start and end with the day calculated. With this indicator you can see how starts the day compared with the previous days. It is valid for any market inasmuch as the start time is calculated with the data received.
Parameter
FREE

An easy indicator that simply shows the moment we connect to the market. We can easily see what has happened while we were gone because the line has two different colors that show the start time. It is only that, a visualization aid that allow us to mark the market behavior while it was night time in our country, or if we have stopped several hours. Input: Server start working date: Day of month Month Year Hour Minutes
FREE

MAC_iCHIMOKU is an Indicator best for Scalping and Swing Both. It can be used for: All Pairs: Forex, Cryptocurrencies, Metals, Stocks, Indices. All Timeframe All Brokers All type of Trading Style like Scalping, Swing, Intraday, Short-Term, Long-Term etc. Multiple Chart This Indicator is based on Upcoming Trend Probability made with an unique Combination of Moving average, Ichimoku Cloud, Price Action and Support Resistance zones. If you are a Scalper or Swing Trader, then this Indicator will

MACros is based on Exponential Moving Average Crossover:
It can be used for: All Pairs: Forex, Cryptocurrencies, Metals, Stocks, Indices. All Timeframe All Brokers All type of Trading Style like Scalping, Swing, Intraday, Short-Term, Long-Term etc. Multiple Chart
*** MT4 Version-->> https://www.mql5.com/en/market/product/87538
Notification Setting: All type of notifications and Pop-Up available with this Indicator. (Can manually ON/OFF the notification as per requirements.)
Special Note: It

This Indicator analyses the Trend and shows signals. When you open the Chart , Indicator shows you Buy or Sell Signal as Alert. Usage: Activate Algo Trading , Activate the Indicator and drag new currencies into chart. Indicator shows you Buy or Sell Signal as Alert.
Results
- Buy Signal
- Sell Signal
- No Signal For any question please don't hesitate to contact.
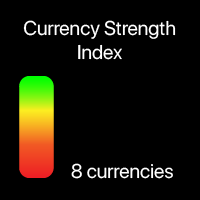
Мониторинг текущей силы 8 основных валют Моя #1 многофункциональная утилита: включает 66+ функций, включая этот индикатор | Свяжитесь со мной если у вас есть вопросы | Версия MT4 Индикатор отображается в отдельном окне, его можно переместить в любое место на графике. В настройках ввода вы можете настроить: Тема интерфейса : тёмная / белая; Префикс и суффикс, если валютные пары у вашего брокера их имеют:
(например, если символ "EURUSD .pro ", пожалуйста, установите " .pro " как суфф

Зоны спроса / предложения: значимые области, где цена неоднократно приближалась в прошлом. Многофункциональная утилита: 66+ функций , включая этот индикатор | Свяжитесь со мной по любым вопросам | Версия для MT4 Индикатор показывает, где цена может потенциально развернуться снова. Как правило, чем чаще цена отклонялась от уровня, тем более значимым он является. В настройках ввода вы можете настроить: Включить или отключить слабые зоны; Показывать или скрывать описание зон; Размер шрифт
Абсолютная волатильность для каждого дня за последние 4 недели Моя #1 многофункциональная утилита: включает 66+ функций, включая этот индикатор | Свяжитесь со мной если у вас есть вопросы | Версия для MT4 Индикатор отображается в отдельном окне, его можно переместить в любое место на графике. В настройках ввода вы можете настроить: Тема интерфейса : темная / белая; Метод расчета: цена, пункты, проценты изменения;
Размер панели Размер шрифта

The RFOC Mini Chart was created to project a macro view of the market, which the option to select the timeframe of interest other than the main chart, it is possible to include 2 indicators: 1 - Moving average channel On the mini chart, the moving average will be created based on the prices of the selected time frame for the RFOC Mini Chart. The moving average period must be selected in the indicator settings pannel.
2 - Boillinger Band In the mini chart, a boillinger band will be created based
FREE

The purpose of the Combo OnOff indicator is combine differerent tecniques and approachs to the market in order to spot signals that occur simultaneosly. A signal is more accurate if it is validate from more indicators as the adaptive expectations can be used to predict prices.The On-Off feature and alarms help to look for the better prices to enter/exit in the markets
Moving Averages are statistics that captures the average change in a data series over time
Bollinger Bands is formed by upper

Having trouble marking where the various forex sessions start and end? Or perhaps your strategy requires you trade only in a specific session, then this is for you.
The session indicator shades the session you require in a certain color so that you can identify it easily. The sessions shown include: London session, New York session, Asian Session, Asian - London overlap and London - New York Overlap.
Difference source give varying time ranges for the various session, mostly differing by not m
FREE

The RFOC Mini Chart was created to project a macro view of the market, which the option to select the timeframe of interest other than the main chart, it is possible to include 2 indicators:
In the full version it is possible to include 2 indicators: 1 - Moving average channel On the mini chart, the moving average will be created based on the prices of the selected time frame for the RFOC Mini Chart. The moving average period must be selected in the indicator settings pannel. 2 - Boillinger Ban
FREE

TPM Cross (trend power moving cross) - is a trend following strategy based on custom signal points. Indicator consists from main custom moving chart line and trend power line. Indicator defines up and down movements by it's trend power and custom moving direction. When current market's trend looses it's power and opposite trend starts - power trend line crosses moving and indicator plots an arrow. Main indicator's adjustable inputs : movingPeriod - period of moving line trendPeriod - period

Impulse fractals indicator - is counter-trend oriented complex market fractal pattern. Market creates bull/bear impulse, trend starts, fractals on impulsed wave are an agressive pullback signals. Buy arrow is plotted when market is bearish and it's impulse showed up-side fractal, and sell arrow is plotted when market is bullish and it's impulse showed dn-side fractal. Main indicator's adjustable inputs : impulsePeriod - main period of impulse histogram filterPeriod - smoothes impulse accordi

Floating peaks oscillator - it the manual trading system. It's based on Stochastik/RSI type of oscillator with dynamic/floating overbought and oversold levels. When main line is green - market is under bullish pressure, when main line is red - market is under bearish pressure. Buy arrow appears at the floating bottom and sell arrow appears at floating top. Indicator allows to reverse signal types. Main indicator's adjustable inputs : mainTrendPeriod; signalTrendPeriod; smoothedTrendPeriod; tre
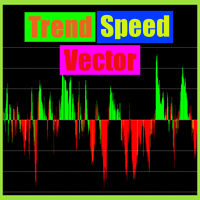
Trend speed vector - is the oscillator for manual trading. System measures trend direction and it's speed. Histogram shows 4 colors: Lime --> Strong up movement with good gain speed; Green --> Up movement with low gain speed Red --> Strong down movement with good gain speed; Orange --> Down movement with low gain speed Green and Orange histograms show weak market's movements and thуese places excluded from signal points. Buy arrow is plotted during strong down movement when bearish gain speed i

Fast Trade Detector (FTD) - Самый правдивый индикатор, который показывает истинное
настроение Большого Игрока.
На бирже есть Игрок, у которого есть всё для того, чтобы быть в первых рядах в книге торговых
приказов (биржевом стакане). Эти сделки как индикатор рыночного настроения сильного игрока.
Вы поймёте, что всё не совсем так, как представляли раньше. Вам откроются алгоритмы и стратегии
крупного участника рынка. Исполнение индикатора в виде гистограммы в подвале графика. Гистограмма п
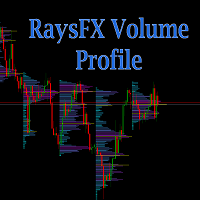
Calculation method The calculation method is summing the number of deals performed at a certain price. Alternatively, the volumes at a certain price can be summed if the real volume type is set in the parameters. The trade data is interpolated based on the most accurate terminal data available (М1 timeframe data). Each bar is divided into several trades based on the estimated price movement inside the bar. This is a distinguishing feature of the product setting it apart from other ones that hav

Ichimoku Aiko MTF is a collection of technical indicators that show support and resistance levels, as well as momentum and trend direction. It is a multi-timeframe indicator so you don't need to change the chart timeframe when you want to see the ichimoku clouds on a higher timeframe. eg. The chart timeframe is M15 and you want to see on the M15 timeframe chart the H1 ichimoku indicators (the ichimoku in Metatrader can't do that) that's why you need to use Ichimoku Aiko MTF.

KT Price Border создаёт трехполосный ценовой канал, который определяет потенциальные области разворота рынка. Эти уровни также могут использоваться в качестве динамической поддержки и сопротивления. Средняя полоса может использоваться для определения направления тренда. Таким образом, индикатор также выполняет функцию трендового инструмента. Кроме того, его простота использования и понятные торговые сигналы приносят значительную пользу начинающим трейдерам.
Особенности
Хорошо работает на больш

Профессиональный инструмент для торговли - индикатор дивергенции между RSI и ценой, позволяющий своевременно получать сигнал о развороте тренда или ловить движения откатов цены (в зависимости от настроек). Настройки индикатора позволяют регулировать силу дивергенции за счет угла наклона пиков RSI и процентного изменения цены, что даёт возможность тонко настроить силу сигнала. Код индикатора оптимизирован и в составе советника очень быстро тестируется. Индикатор не перерисовывает, стрелки для н
FREE

XFlow показывает расширяющийся ценовой канал помогающий определять тренд и моменты его разворота. Используется также при сопровождении сделок для установки тейк-профит/стоп-лосс и усреднений. Практически не имеет параметров и очень прост в использовании - просто укажите важный для вас момент истории и индикатор рассчитает ценовой канал. это демонстрационная версия, ограниченная валютными парами CHF. Предназначена для ознакомления с интерактивным использованием XFLow ОТОБРАЖАЕМЫЕ ЛИНИИ
ROTATE - т
FREE

XFlow показывает расширяющийся ценовой канал помогающий определять тренд и моменты его разворота. Используется также при сопровождении сделок для установки тейк-профит/стоп-лосс и усреднений. Практически не имеет параметров и очень прост в использовании - просто укажите важный для вас момент истории и индикатор рассчитает ценовой канал. ОТОБРАЖАЕМЫЕ ЛИНИИ
ROTATE - толстая сплошная линия. Центр общего вращения цены. Цена делает широкие циклические движения вокруг линии ROTATE. Положение цены окол

Профессиональный инструмент для торговли - индикатор дивергенции между AO и ценой, позволяющий своевременно получать сигнал о развороте тренда или ловить движения откатов цены (в зависимости от настроек). Настройки индикатора позволяют регулировать силу дивергенции за счет угла наклона пиков AO и процентного изменения цены, что даёт возможность тонко настроить силу сигнала. Код индикатора оптимизирован и в составе советника очень быстро тестируется. Индикатор не перерисовывает, стрелки для на
FREE

Индикатор Envelopes M основан на популярном техническом индикаторе Envelopes, применяемом для создания гибких каналов, внутри которых цены пребывают большую часть времени. Границами этих коридоров являются две скользящие средние. Но заявка на то, что цена в канале находится большую часть времени, не является до конца корректной, поскольку часто происходит пробой канала и цена вывалится далеко за пределы канала. Главное отличие данного индикатора состоит в том что при каждом новом пробитие канал

Trend TD – индикатор трендовый. Благодаря алгоритму данного индикатора, сигнал никогда не будет идти против тренда. Благодаря двум линиям формирующих узкий канал алгоритм анализа точек входа, алгоритм контролирует моменты разворота в тот момент когда верхняя линия канала развернулась и можно визуально нарисовать линию пересекающую верхнюю линию с самой собой в прошлом, при этом пересечив в одной точке нижнюю линию. Если данное правило будет зафиксировано, тогда будет четко указан сигнал на граф

Session Killzone Indicator
Indicator that helps you to identify the killzone times of both London and NewYork sessions which usually is the most times for high volatility and taking liquidity from the market. Killzone times are configurable through indicator parameters. The indicator adjusts the range of the killzones based on the daily trading range.
FREE
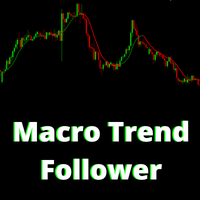
The Indicator assists in decision making along with the user's market reading. By drawing the trend, this indicator becomes very useful on days of high volatility in the market, that is, it offers strategic insights on days of economic data, news or pronouncements. On flat market days it becomes usual to identify possible market reversals. Follow Youtube to understand the most suitable scenarios for its use.
FREE

Средний дневной диапазон (ADR) - это индикатор, который показывает, как далеко валютная пара может продвинуться за день. Автоматически отображает верхний и нижний уровни ADR. Автоматически рассчитывает процент и расстояние ADR, достигнутый валютной парой за день. Меняет цвет и толщину линии ADR, при достижении его ценой. Расчет производится за 14 дней. Отображается на таймфреймах от М1 до М30.

Demarker pullback system - is the manual trading system for choppy markets. It show 2 colored histogram. When histogram is blue - market is quite bullish, when histogram ir orange - market is more bearish. Up arrow is plotted when histogram is in oversold zone but blue color. Down arrow is plotted when histogram is in overbought zone but orange color. These patterns shows false breakout and possible soon reverse(price is overbought but shows bearish signs and price is oversold but shows bullis

Данный индикатор показывает объем каждого бара (видимый диапазон) в пунктах. Гибкие настройки отображения значений. Возможна настройка параметров показа. Индикатор создавался для личного пользования, анализа графиков. Параметры: Color - цвет текстовых меток; Position - позиция метки: 0 - снизу, 1 - сверху; FontSize - размер шрифта; Angle - угол наклона текста; GapPoints - отступ по вертикальной оси.
FREE

KT Stochastic Alerts is a personal implementation of the Stochastic oscillator that provide signals and alerts based on six custom events: Bullish Crossover: When Stochastic main line cross above the signal line. Bearish Crossover: When Stochastic main line cross below the signal line. When Stochastic enter in an overbought zone. When Stochastic exit from an overbought zone. When Stochastic enter in an oversold zone. When Stochastic exit from an oversold zone.
Features
A perfect choice for tra
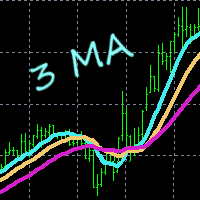
This indicator gives you a modified version of three Moving Averages. Great for scalping. Does not feature any alerts, and is best used manually after confirming multi line displays. Settings: Period1 Period2 Period3 Period4 How to use: Simply attach to any chart with default settings. Buy when the 4 lines converge below the price. Sell when the 4 lines converge above the price. Take note of the slope of Period4. See example pictures below. Best results when looking at three or more time frames
This indicator uses a special algorithm to plot the 4 lines for trading. Great for scalping. Features alerts. Settings for trend filters. How to use: Simply attach to any chart with default settings. Buy when the three pink lines converge below the green line. Sell when the three pink lines converge above the green line. Best results when looking at three or more time frames, and the three blue lines have just converged below or above the green line.
Use as you see fit for your strategy. Best re
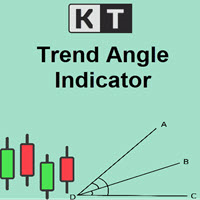
The KT Trend Angle helps to identify ranging and trending markets. The idea is to only enter a trade following the market trend if the slope is steep enough.
An angle is the ratio of the number of bars to the number of points: The bars mean the time offered by standard (M1, M5, etc.) and non-standard time frames. Points represent the unit of price measurement with an accuracy of 4 or 5 decimal places.
Input Parameters Period: An integer value to define the intensity of angled trendlines. Angl
MetaTrader Маркет - торговые роботы и технические индикаторы для трейдеров, доступные прямо в терминале.
Платежная система MQL5.community разработана для сервисов платформы MetaTrader и автоматически доступна всем зарегистрированным пользователям сайта MQL5.com. Ввод и вывод денежных средств возможен с помощью WebMoney, PayPal и банковских карт.
Вы упускаете торговые возможности:
- Бесплатные приложения для трейдинга
- 8 000+ сигналов для копирования
- Экономические новости для анализа финансовых рынков
Регистрация
Вход
Если у вас нет учетной записи, зарегистрируйтесь
Для авторизации и пользования сайтом MQL5.com необходимо разрешить использование файлов Сookie.
Пожалуйста, включите в вашем браузере данную настройку, иначе вы не сможете авторизоваться.