Смотри обучающее видео по маркету на YouTube
Как купить торгового робота или индикатор
Запусти робота на
виртуальном хостинге
виртуальном хостинге
Протестируй индикатор/робота перед покупкой
Хочешь зарабатывать в Маркете?
Как подать продукт, чтобы его покупали
Новые технические индикаторы для MetaTrader 5 - 61

Show Pip Value and Spread on Chart as Object or Comment. User can select to display Pip Value and/or Spread by object on main Chart, or show both only as Comment lines on chart. Object Color, Font face and Size and also which corner to show, may change by user. Pip Value calculated in accordance of input Lot size , Default is 1 lot . Can use at all currency pairs , Gold , Silver and most other charts.
FREE
Это торговая система построена на рыночных импульсах разной сложности.
Для формирования сигнала, индикатор использует моменты, когда направление импульса и необходимого участка тенденции совпадают. А также индикатор учитывает волатильность рынка в текущий момент. Метки Stop_Loss можно установить с параметром "0" или "1", тогда Stop_Loss будет учитывать волатильность на рынке.
Метки Take_Profit можно установить с параметром "0", тогда Take_Profit будет учитывать волатильность на рынке

The Haos oscillator coded for the MT5!
This oscillator allows to verify overbought / oversold regions in two periods (14 and 96, for example), making it possible to anticipate a reversal. Possibility to activate an audible alert when it reaches a defined level. Possibility to choose the alert sound by placing a .wav song in each asset or timeframe. (save a .wav file to the MQL5 \ Files folder) Possibility to activate / deactivate histogram and levels to make the screen cleaner. Customizable co

The Initial Balance (Initial Balance / Initial Balance) is a concept related to the study of volume (to learn more, study about Market Profile and Auction Market Theory. You can find some videos in English when searching for "Initial Balance Market Profile").
The IB defines a range in which prices were negotiated in the first hour of trading.The amplitude of the range is important and the break in the range defined by the Initial Balance may have occurred due to the movement of several players

The VTC Volatility indicator was written to support a Brazilian stock market strategy in the WDO (USDBRL), but it can be adapted to other strategies and markets.
In the new indicator update, it is now allowed to choose up to 4 levels to determine the range, and thus be more versatile.
The Brazilian stock exchange (B3) has the VTC which is a "Structured Exchange Rate Volatility Transaction" (more information on the B3 website).
At around 10:00 am, the VTC "Call" comes out and Brazilian
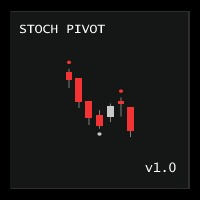
Stochastic Pivot draws a point on the chart at Stochastic overbought or oversold. During overbought periods, this indicator will draw the pivot point at the high of the highest candle and at the low of the lowest candle during oversold periods. NB : All pivots are updated 'on tick' and 'on any chart event' immediately Settings Name Description Upper Limit Set Stochastic Overbought Level
Lower Limit
Set Stochastic Oversold Level %KPeriod Set Stochastic K Period %DPeriod Set Stochastic D Per
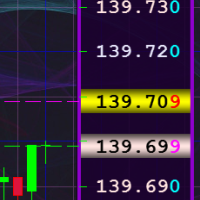
Индикатор предназначен для замены стандартной вертикальной ценовой шкалы, расположенной с правой стороны в окне графика клиентского терминала, на более удобную ценовую шкалу с возможностью детальной настройки параметров отображения этой шкалы. Кроме этого, индикатор позволяет делать фоновую заливку окна графика любым изображением по желанию пользователя и двухцветную сетку с элементами её тонкой настройки. В первую очередь, индикатор будет полезен трейдерам, обладающим не самым лучшим зрением,

O indicador precisa do times and trades (time and salles) para seu correto funcionamento.
O Volume é composto por ordens à mercado compradoras e vendedoras que agrediram o book de ofertas, o Delta é a diferença das ordens a mercado compradoras e vendedoras.
O CoioteDeltaCandle monitora o time and trades e à partir dos dados de agressão forma candles temporais em 4 formatos diferentes, possível selecionar à partir de configurações.
São elas:
Modo com acumulação.
Modo com pavio.
Modo

Станьте Breaker Trader и получайте прибыль от изменений структуры рынка по мере изменения цены.
Индикатор выключателя блока ордеров определяет, когда тренд или движение цены приближаются к истощению и готовы развернуться. Он предупреждает вас об изменениях в структуре рынка, которые обычно происходят, когда произойдет разворот или серьезный откат.
Индикатор использует собственный расчет, который определяет прорывы и ценовой импульс. Каждый раз, когда новый максимум формируется около возможн

Сканер ценового действия Koala - Раскройте силу ценового действия Введение: Откройте для себя новый сканер ценового действия Koala - универсальный инструмент для многовалютного и многотаймфреймного анализа, предназначенный для выявления основных паттернов ценового действия и их отображения в интуитивной таблице сканера. Аннотация: Этот индикатор выходит за рамки обычного, предоставляя пользователям возможность выявлять ключевые паттерны ценового действия на различных валютах и таймфреймах. Особе
FREE

Присоединяйтесь к Koala Trading Solution Channel в сообществе MQL5, чтобы узнать о последних сигналах, новостях по всем продуктам Koala. Ссылка для присоединения указана ниже: https://www.mql5.com/en/channels/koalatradingsolution Добро пожаловать в индикатор уровня BTC
Индикатор уровня Koala BTC
Этот индикатор создан для тех, кто любит покупать BTC, поскольку вы знаете, что BTC был одним из лучших инвестиционных элементов в последние годы, а также в наши дни, поэтому этот индикатор прост
FREE

Документация по подключению MetaTrader 5 к Python с использованием простого перетаскиваемого EA. Полное решение "от начала до конца", полностью протестированное, быстрое и эффективное!
Экосистема PyTrader состоит из скрипта на Python и версии EA для MT5 или MT4. Для лицензирования используется индикатор. Связь между скриптом на Python и EA осуществляется через сокеты. EA является сервером, а скрипт на Python - клиентом. Всегда запрос (функция / скрипт Python) и вывод (данные / сервер). EA

The moving average applied to the price chart is one of the most used technical analysis methods. There are several ways to use averages, among them, through the analysis of crossings.
The method consists of using two moving averages, one fast period and one slow period. The concept is very simple, when there is a crossing of the fast moving average upwards it indicates a high market trend and when the fast moving average crosses downwards it indicates a low trend in the market, combining t

Индикатор анализирует график и определяет японские свечи "Доджи". Показывает их появление и сигнализирует о появлении такой свечи (если разрешено в параметрах). Также, этот индикатор показывает силу разворота в виде столбиков разного цвета (чем больше зелёного цвета, тем вероятнее рост, чем больше красного - падение цены). Направление сигнала зависит от направления предыдущих свечей, так как "Доджи" сигнализирует о развороте или коррекции. В настройках индикатора можно изменять параметры свечи
FREE

Индикатор LTS для MT5(Level + Trends + Speed)
Индикатор LTS был создан для быстрого анализа консолидаций на графике, существенно облегчающий принятие решений при торговле. LTS выделяет точки напряжения и дает информацию о силах, влияющих на него, а так же текущую скорость и средний ход. Индикатор легко настраивается под любой стиль торговли и может анализировать любой таймфрейм. LTS использует уникальный алгоритм анализа трендов по 4м параметрам от глобального до локального.
Настройка индик

About the VWAP Custom Date This indicator can be calculated from a specified date and hour, being not only a Day Trading indicator but also Swing Trading indicator.
What is the VWAP indicator? The volume weighted average price (VWAP) is a trading benchmark used by traders that gives the average price a security has traded at throughout the day, based on both volume and price. It is important because it provides traders with insight into both the trend and value of a security. Large institutio

Описание
Volume Magic - это индикатор, который показывает значение относительного объема в сочетании с направлением текущего тренда. Отношение текущего объема к среднему объему за определенный период отображается в нижнем окне в виде осциллятора. Направление текущего тренда отображается в виде двухцветных линий тренда.
Как использовать?
Сначала с помощью двухцветных трендовых линий определяйте направление текущего тренда. Потом ищите зоны низкого объема и открывайте позиции в направлении

Indicators are professional data statistics, position orders, historical order analysis->>>>>> <This version is in Chinese -> English version please move>
Necessary for traders: tools and indicators Waves automatically calculate indicators, channel trend trading Perfect trend-wave automatic calculation channel calculation , MT4 Perfect trend-wave automatic calculation channel calculation , MT5 Local Trading copying Easy And Fast Copy , MT4 Easy And Fast Copy , MT5 Local Trading copying For DE
FREE

Trading Signal for MetaTrader5 PC platform
The Signal is based on the Investologic EA trend strategy . Trend following indicator’s and oscillator’s, can work with any symbol or market in MT5 platform FOREX, GOLD, OIL, STOCKS, INDEXES, NASDAQ SPX500 The strategy
the strategy uses multi time frame combination of indicators and moving averages to find the best entry point wen the fast MA slow MA Crossover And Stochastic , RSI , Average Directional Movement Index ,combined together
FREE

VWAP BAR It´s power full indicator of candle by candle when lined up with greate analysis, you have great opportunity, finder defense candle. Is a good ideia from order flow method, now your meta trader 5 inside you time frame chart .
What is the Volume Weighted Average Price (VWAP)?
The volume weighted average price (VWAP) is a trading benchmark used by traders that gives the average price a security has traded at throughout the day, based on both volume and price. It is important
FREE

O indicador CoioteAverageSpreed é uma releitura do indicador AverageSpreed. Ele mostra a relação de esforço x resultado entre o volume e a volatilidade do preço. Com o volume heatmap é possível identificar visualmente se o preço foi deslocado com uma quantidade maior de volume e se o deslocamento do preço apresentou maior resultado ou não. É possível identificar momentos de ignição e exaustão do movimento, além de injeções de fluxo para dar continuidade a um movimento.
KijunSen vs Price Ichimoku Strategy Description in English and Italian =
This Indicator is based on one of the Strategies with Ichimoku Indicator, in particular is the cross of the KijunSen with the Current Price; it will give you of Buy and Sell when they Cross, with Arrows and Alerts.
When you attach the indicator on the chart , a window will open where , in the INPUT section, you can also choose to change the main Ichimoku values.
SIGNAL INPUT =
· BUY = when Price cross above t

CoioteWeisWave é uma releitura do indicador de VSA WeisWave com indicação do estouro de fractal, método de analise dos TradersPiolhos e implementado originalmente pelo Trader Dario Junqueira. A versão Coiote foi reprojetada para indicação da volatilidade do volume no fractal. A coloração adicional (azul e magenta) dão sinais de entrada, saída e pontos de gerenciamento, podendo ser usados também como suporte e resistência.
Existem 3 modos de exibição do weis wave, por volume total, por range e p

The DYJ CandleShape contains 80 candlestick Patterns, such as MORNING STAR, DOJI STAR, HARAMI CROSS,INVERT HAMMER,ENGULFING..... candlestick is a valid form of market technical analysis. The recommended short stoploss is near the highest price of the first three to five candles The recommended long stoploss is near the lowest price of the first three to five candles Input
InpPeriodSMA =10 -- Period of averaging InpAlert =true -- Enable. alert InpCountBars =

Линия Koala Trend обновлена до версии 1.2
Улучшение последнего обновления: добавлен новый параметр, который позволяет пользователю подключать линию тренда ко 2-й, 3-й или X-й самой высокой или самой низкой точке.
Мой запрос :
** Уважаемые клиенты, пожалуйста, опубликуйте свой отзыв о Koala Trend Line, и позвольте мне улучшить ваши отзывы.
ПОЧЕМУ KOALA TREND LINE ЯВЛЯЕТСЯ БЕСПЛАТНЫМ ИНДИКАТОРОМ?
Я считаю, что бесплатный индикатор должен быть квалифицированным инструментом.
А что н
FREE

Premium Trend Entry Pro
TZ Trade Logics, представляет вам улучшенную версию входа в тренд Premium
Этот выпуск принесет вам гораздо более расслабленное состояние торговли с расширенными функциями для фильтрации тренда и временем входа премиального сигнала.
Для нас важно не создание продукта! но продолжали обслуживание и обучение пользователей. Благодаря нашим специальным средствам связи с нами вы получите подробное руководство по использованию продукта и другие соответствующие тренинги, св
FREE

Necessary for traders: tools and indicators Waves automatically calculate indicators, channel trend trading Perfect trend-wave automatic calculation channel calculation , MT4 Perfect trend-wave automatic calculation channel calculation , MT5 Local Trading copying Easy And Fast Copy , MT4 Easy And Fast Copy , MT5 Local Trading copying For DEMO Easy And Fast Copy , MT4 DEMO Easy And Fast Copy , MT5 DEMO «Кооператив QQ: 556024» "Сотрудничество WeChat: 556024" «Совместная электронная почта: 55602
FREE

Использовать индикатор New Topic очень просто, поскольку самый простой способ - это посмотреть на график и действовать согласно показаниям цветных стрелок.
Алгоритм учитывает измерение цен, также данном методе делается упор на измерение каждого из перепадов цены (H/C, H/O,LC,LO) - что дает более детализированную информацию но так же и более усредненную. Подобный вариант рассчета учитывает внутри дневные колебания цены и делает упор на измерение "свечной" доли в тренде.
При рассчете данног

Индикатор PRO Channel реализует канал а также сигналы для входа на границах канала. Торговля в канале является одной из самых популярных стратегий на форекс, её простота позволяет использовать данный вариант трейдинга даже новичкам. PRO Channel – классический индикатор семейства канальных индикаторов, применение которого позволяет трейдеру вовремя отреагировать на выход цены за границы установленного для нее канала. Этот коридор выстраивается на основании анализа нескольких свечей, начиная от п

Алгоритм работы индикатора Sup Trend заключается в определении господствующего направления движения цены путем алгоритмического анализа ценовых значений за определенный период времени. При рассчете данного индикатора сперва рассчитываются логорифмические приросты по цене закрытия, что позволяет отфильтровать тренд, сезонность и прочие вкрапления которые портят картину волатильности, затем по полученным данным строится стандартно-квадратическое отклонение. Алгоритм учитывает измерение цен, также
Least Square MA Описание: Индикатор Least Square Moving Average позволяет оценить направление движения рынка и его возможные развороты. Индикатор представляет собой линию, которая отображается в ценовом окне. Входные параметры: LSMA_Period - период расчета скользящей средней по методу наименьших квадратов; Prediction – число свечек, по которому строится прогнозная скользящая средняя по методу наименьших квадратов при условии, что скорость ее (падения или роста сохранится); Display_Bars - количе

Necessary for traders: tools and indicators Waves automatically calculate indicators, channel trend trading Perfect trend-wave automatic calculation channel calculation , MT4 Perfect trend-wave automatic calculation channel calculation , MT5 Local Trading copying Easy And Fast Copy , MT4 Easy And Fast Copy , MT5 Local Trading copying For DEMO Easy And Fast Copy , MT4 DEMO Easy And Fast Copy , MT5 DEMO
Strongly recommend trend indicators, automatic calculation of wave standard and MT5 ve
FREE

The Volume Heatmap indicator visually shows the INTENSITY of the volume taking into account the concept of standard deviation. Purpose of the Indicator: High volumes are common where there is a strong consensus that prices will increase. An increase in volume often occurs at the beginning of a new upward trend in the price of an asset. Some technical analysts do not rely on trend confirmations without a significant increase in volume. Low volumes usually occur when an asset is heading for a down
FREE

The Volume Heatmap indicator visually shows the INTENSITY of the volume taking into account the concept of standard deviation. Purpose of the Indicator: High volumes are common where there is a strong consensus that prices will increase. An increase in volume often occurs at the beginning of a new upward trend in the price of an asset. Some technical analysts do not rely on trend confirmations without a significant increase in volume. Low volumes usually occur when an asset is heading for a down

Хотели бы вы увидеть будущие линии индикатора ZigZag ? Этот индикатор поможет вам в этом, благодаря тому, что модель индикатора построена на основе двух индикаторов: Historical Memory и ZigZag . Благодаря этому индикатор предсказывает линии ZigZag'а. Весьма удобен в качестве помощника, служит ориентиром будущего характера движения цены. Прогноз рассчитывается методом поиска в истории наиболее похожего участка (паттерн) на текущий. Индикатор рисуется в виде линии, показывающей исторический и

В основе алгоритма индикатора Priority Argument лежат стандартные индикаторы а также собственные математические расчеты. Индикатор поможет пользователям определиться с направлением тренда. Также станет незаменимым советчиком для входа в рынок или для закрытия позиции. Этот индикатор рекомендуется для всех, как для новичков так и для профессионалов.
Как работать: Реализация индикатора тренда простая - в виде линий двух цветов. Покупаем, когда происходит смена цвета линии индикатора с розового

Индикатор Trend Active является сигнальным и обладает интересными свойствами. Нужно принять во внимание что данный индикатор отражает экстремумы и его следует использовать как дополнительный, а для точки входа использовать другой инструмент. Индикатор умеет передать все виды сигналов пользователю: сообщения, E-mail и Push!
Целью, которая преследовалась при его создании, является получение сигналов которые будут давать меньше шума и быстрее реагировать на изменение цены. Индикатор является тре

Индикатор Real Trends визуально «разгружает» ценовой график и экономит время анализа: нет сигнала – нет сделки, если появился обратный сигнал, то текущую сделку стоит закрыть. Это стрелочный индикатор для определения тренда. Индикатор сам оценивает, насколько сильный сигнал возникает на рынке, сигнализирует об этом, а трейдеру остается только принять торговое решение. Индикатор реализует стратегию для торговли по тренду, фильтрация и все необходимые функции, встроенные в один инструмент!
Пр
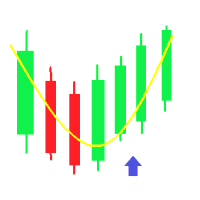
Arya Stochastic MA _MM Description in English and Italian=
This Indicator is based on a very simple logic: using 2 level of Stochastic Oscillator and two different Moving Avarage, give you Buy and Sell Signal with Alerts and drawing Arrows. It work on every timeframe or Symbol ;
This Indicator is for traders that have a multioperative approach on different asset , to controll the operativity in a simple and effective way .
SIGNAL INPUT=
· BUY= when Stochastic Oscillator c

Indicador en MQL5, que obtiene el promedio de 10 EMAS, que son alineadas según Fibonacci, obteniendo un promedio, que sera suavizado. Se puede ingresar un numero desde 2 a N, que multiplica a los EMA-Fibonacci. Funciona en cualquier criptomoneda, etc. etc... pudiendo calcular el futuro segun la tendencia de las EMAS. Funciona excelentemente en tramos largos, determinando exactamente el mejor inicio/salida.
El precio inicial por apertura sera por un periodo de tiempo, luego aumentará.

Индикатор Average Price производит расчет средних цен открытых позиций BUY и открытых позиций SELL, с учетом размера открытых позиций, комиссий и свопов. Индикатор строит среднюю линию открытых позиций BUY, после пересечения которой, ценой снизу вверх, суммарная прибыль по всем позициям BUY по текущему инструменту, становится больше 0. Индикатор строит среднюю линию открытых позиций SELL, после пересечения которой, ценой сверху вниз, суммарная прибыль по всем позициям SELL по текущему инструмен

Тарифный план Koala Engulf Pattern
Шаг 1: Бесплатно для первых 20 загрузок.
Шаг 2: Аренда 10 $ / год для следующих 20 загрузок.
Шаг 3: Аренда 20 $ / год для следующих 20 загрузок.
Step4; Закупочная цена за пожизненное использование для следующих 100 загрузок 39 $.
Шаг 5: Окончательная пожизненная цена этого продукта составляет 99 $.
Введение в шаблон "Поглощение коалы"
Профессиональный индикатор MT5 для обнаружения паттерна поглощения Price Action.
Полез

Necessary for traders: tools and indicators Waves automatically calculate indicators, channel trend trading Perfect trend-wave automatic calculation channel calculation , MT4 Perfect trend-wave automatic calculation channel calculation , MT5 Local Trading copying Easy And Fast Copy , MT4 Easy And Fast Copy , MT5 Local Trading copying For DEMO Easy And Fast Copy , MT4 DEMO Easy And Fast Copy , MT5
DEMO
砖图 Renko PRO->>>
The display of the brick map on the main map.
The Renko chart ideal
FREE

панель просмотра тренда;
Тенденция автосигналов
Индикатор отслеживает тренд на 5 разных графиках одного и того же актива, основываясь на 6 сигналах для каждого графика.
Основная цель индикатора - показать нам тренд большинства финансового актива, в который он был помещен. Система передает информацию о тенденциях в разное графическое время, таким образом, пользователь может иметь широкий обзор движения актива, этот тип инструмента позволяет пользователю иметь более высокий процент по

Индикатор автоматически строит значимые трендовые линии и отображает сигналы на покупку и продажу. Сигналы формируются на отражение и на пробой от линий поддержки и сопротивления. При появлении сигнала индикатор отображает его в виде стрелки заданного цвета а также отправляет заданный во входных параметрах тип сообщений. В настройках индикатора можно задавать тип сигнала, максимальное расстояние до трендовой линии, тип оповещений а также настройки линий и стрелок. Индикатор имеет панель на котор
FREE

Индикатор автоматически рассчитывает и отображает на графике уровень максимального реального объема Point Of Control (POC) профиля рынка ( Market Profile ) для массива свечей, выделенных прямоугольной областью. Этот заметно увеличит точность ваших входов в позицию при торговле отскоков от POC и разворотов. Внимание при тестировании демо версии! В тестере стратегий MT5 нет возможности перетаскивания прямоугольника и это проблема ограничений самого демо тестирования тестера стратегий MT5:( П

Necessary for traders: tools and indicators Waves automatically calculate indicators, channel trend trading Perfect trend-wave automatic calculation channel calculation , MT4 Perfect trend-wave automatic calculation channel calculation , MT5 Local Trading copying Easy And Fast Copy , MT4 Easy And Fast Copy , MT5 Local Trading copying For DEMO Easy And Fast Copy , MT4 DEMO Easy And Fast Copy , MT5 DEMO
Can set the cycle for other varieties of K line graph covered this window, fluctuations obse
FREE

Necessary for traders: tools and indicators Waves automatically calculate indicators, channel trend trading Perfect trend-wave automatic calculation channel calculation , MT4 Perfect trend-wave automatic calculation channel calculation , MT5 Local Trading copying Easy And Fast Copy , MT4 Easy And Fast Copy , MT5 Local Trading copying For DEMO Easy And Fast Copy , MT4 DEMO Easy And Fast Copy , MT5 DEMO Fibo: from KTrade 1. Automatically calculate and analyze the band. -> Get the desired band 2.
FREE

The Chaikin Money Flow (CMF) is an indicator created by Marc Chaikin in the 1980s to monitor the accumulation and distribution of a stock over a specified period. The default CMF period is 21 days. The indicator readings range between +1 and -1. Any crosses above or below 0 can be used to confirm changes in money flow, as well as buying or selling momentum, but many traders look for divergences to predict trend reversal based on volume. This indicator was developed not only to be used by man
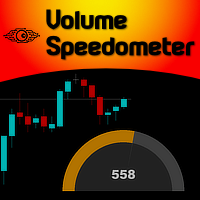
Imagine the ability to have Volume Speed second by second presented to you in the form of a speedometer... Well, imagine no more... Welcome to the new Minions Labs creation: Volume Speedometer . Volume Speedometer is a Minions Labs idea that was born trying to show in realtime what is happening with the Volume Flow of orders (or Ticks, if you don't have that) during the day. This indicator was created to be used in Intraday trading and the goal is to give you a "heads up" when the Volume flow is
Hi, I'm a Japanese EA developer.
I made an indicator for MT5. It can be used as a guide for trends and as a guide for entry / exit.
Please use it by pasting it on a chart of about 1 minute to 15 minutes.
If you like, please watch the video.
Various usages 1. It is used to recognize the environmental advantage of buying or selling with the color of the line. If the line is red, it is advantageous to buy. If it is blue, it is advantageous to sell. Neither if there is no line. 2. Used as

Pattern Trader No Repaint Indicator MT5 Version
Indicator searches for 123 Pattern, 1234 Pattern, Double Top, Double Bottom Patterns , Head and Shoulders, Inverse Head and Shoulders, ZigZag 1.618 and Father Bat Pattern.
Pattern Trader indicator uses Zig Zag Indicator and Improved Fractals to determine the patterns.
Targets and Stop Loss Levels are defined by Fibonacci calculations.
Those levels must be taken as a recommendation. The trader may use different tools like Moving Av

ATR Moving Average draws a moving average of the standard Average True Range( ATR ) in the same window.
Settings Name Description ATR period
Set Price per iod for ATR calculation
ATR level Set ATR value for thresholding( only whole number, ignore leading zeros e.g. 0.00089 = 89 ) MA Period Set moving Average Period MA Method Set moving average method( Simple, Exponential, Smoothed and Linear Weighted ) MA Shift
Set moving average shift
Enable Alerts ? Generate Alert when ATR crosses
FREE

O CoioteTradeDetector monitora o time and trades (time and salles), é possível criar filtros de alerta gráficos (plotagem de linha com qtd) com variações de agressões pré-definidas.
É possível monitorar grandes lotes, ordens diretas e alta frequência de trades. Para perfeito funcionamento do produto é preciso ter os dados de agressão da corretora (acesso completo ao times and trades).

Indicador en MQL5, recibe la información del precio SUAVIZADO, lo procesa anulando los picos inteligentemente, y el resultado lo envía al desarrollo de la escalera que iniciara y subirá o bajara según el peldaño o INTERVALO ingresado Ingreso PERIODO = 50 (variar segun uso) Ingreso MULTIPLICA AL PERIODO = 1 (variar segun uso)
Segun la configuración la escalera puede pegarse o separarse de los precios,,
Se aplica toda la linea de tiempo, y a todas las divisas, etc.

This is a combination of 3 customized indicators, to make chart clean, we only showing up or down arrows. This gives good result in 1 hour and above time frames. In one hour chart, please set sl around 50 pips. Once price moves into your direction, it would be good to trail your sl by 30 to 50 pips to get more profit as this indicator kinda trend follower. In four hour chart, set ls around 100 pips. Works in all major pairs and winning ration is around 70 % based on back test.

Продвинутая мультисимвольная/мультитаймфреймная версия индикатора "Candle Pattern Finder for MT5 " (Поиск свечных паттернов на основе книги Грегори Л. Морриса «Японские свечи. Метод анализа акций и фьючерсов»). Индикатор ищет свечные паттерны по всем символам окна "Market Watch" и по всем стандартным таймфреймам от M1 до MN1. При возникновении паттерна на любом символе/таймфрейме индикатор дает сигнал (текстовый, звуковой, отправка сообщения на мобильник и эл.почту).
Таким образом, размещая инд

Представляю Вам уникальный индикатор по разворотным зонам и по зонам, где цена очень часто дает реакцию. Индикатор является мультитаймфреймным. Его главная отличительная черта от других индикаторов это то, что он не перерисовывает зоны, а всегда показывает их заранее, до их возникновения (это показано на скриншотах). Часто бывает так, что зоны на нескольких таймфреймах совпадают и это только усиливает сигнал на разворот и такие сигналы отрабатывают очень часто. Также отличительной чертой данного

Описание
SuperCCI - индикатор, основанный на стандартном индикаторе CCI. Он определяет и отображает схождения/расхождения на рынке и формирует соответствующие точки входа. Также с помощью индекса торгового канала он определяет направление тренда и отображает уровни поддержки и сопротивления .
Features Не перерисовывается. Показывает точки входа. Показывает направление текущего тренда и уровни поддержки/сопротивления. Имеет оповещения. Рекомендации
Используйте конвергенцию/дивергенцию для

In this indicator you choice a data to be used from yesterday (high, low, open, close, etc) to automatically draw an line to be the zero. And, from that a percentage deviation ("Percentage to be used") is calculated and used to draw others line to both side until a limit be reached.
Both sides can have diferrent colours as show in screenshots. Also, more than one indicator can be used at same time.
FREE

Necessary for traders: tools and indicators Waves automatically calculate indicators, channel trend trading Perfect trend-wave automatic calculation channel calculation , MT4 Perfect trend-wave automatic calculation channel calculation , MT5 Local Trading copying Easy And Fast Copy , MT4 Easy And Fast Copy , MT5 Local Trading copying For DEMO Easy And Fast Copy , MT4 DEMO Easy And Fast Copy , MT5 DEMO
The homeopathic indicator is also called the CCI indicator. The CCI indicator was propos
FREE

"Spotting emerging trends, defining correction periods, and anticipating reversals can benefit your trading in many ways..." So be it: Higher Highs & Lower Lows indicator. This is an indicator created by Vitali Apirine and presented to the public through the article "Time To Buy. Time to Sell - It's a Stochastic, Higher Highs & Lower Lows" in the Stocks & Commodities magazine . This is a Momentum indicator that helps determine the direction of a trend. Higher Highs and Lower Lows are two indicat
FREE

FXC iDeM-DivergencE MT5 Indicator
This is an advanced DeMarker indicator that finds trend-turn divergences on the current symbol. The indicator detects divergence between the DeMarker and the price movements as a strong trend-turn pattern.
Main features: Advanced divergence settings
Price based on Close, Open or High/Low prices Give Buy/Sell open signals PUSH notifications
E-mail sending Pop-up alert Customizeable Information panel Input parameters: DeM Period: The Period size of the DeMarke

For those who feel that regular RSI is too fast and too noisy to be used on regular trades or in EAs and want to have an alternative to meter the Momentum of the Price, here is a solution presented on the great article of the Technical Analysis of Stocks & Commodities magazine (April, 2015), by Vitali Apirine, called: Slow Relative Strenght Index . Its reading is almost the same as the regular RSI, but its levels of Overbought and Oversold are 80 and 20 instead. SRSI is very powerful to show div
FREE

FXC iCCI-DivergencE MT5 Indicator
This is an advanced CCI indicator that finds trend-turn divergences on the current symbol. The indicator detects divergence between the CCI and the price movements as a strong trend-turn pattern.
Main features: Advanced divergence settings
Price based on Close, Open or High/Low prices Give Buy/Sell open signals PUSH notifications
E-mail sending Pop-up alert Customizeable Information panel Input parameters: CCI Period: The Period size of the CCI indicator.
C

A stochastic oscillator is a momentum indicator comparing a particular closing price of a security to a range of its prices over a certain period of time. The sensitivity of the oscillator to market movements is reducible by adjusting that time period or by taking a moving average of the result. It is used to generate overbought and oversold trading signals, utilizing a 0-100 bounded range of values. This indicator show 8 stochastic on one chart.
FREE

The Oscar, one of my favorite indicators. This is my enhanced Version of it with more options and better visuals. Many different averaging methods Oscar changes color on signal cross, but not too volatile (3% extra threshold) Adaptable Divisor, higher numbers lead to more signals, due to higher fluctuations. Its a fast but quite accurate trend direction indicator. Play around with the settings and make it match to your setup. GL trading Please follow me on Twitter https://twitter.com/semager and
FREE
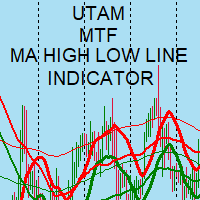
MTF Moving Average High Low line. I use it in my MT5 and MT4 robots in the round. Look at the robots and indicators I put up under my name. Good luck trading! :)
MTF Moving Average (Mozgó Átlag) High (felső) Low (alsó) line (vonala). MT5 és MT4 robotomban használom a fordulóban. Nézd meg a nevem alatt milyen robotokat és indikátort raktam fel . Sok sikert a kereskedéshez! :)

Projeção de alvos harmônicos com dois cliques, os alvos possuem melhor qualidade quando ancorados em candles climáticos, seja de ignição ou exaustão ou em pivôs de alto volume.
Funciona com qualquer ativo (volume real e volume tick), em qualquer tempo gráfico, ações, indicies, futuros, forex, criptomoedas, commodities, energia, mineiro e qualquer outro. As projeções devem respeitar os princípios de confluência e simetria, portanto não devem ser utilizados unicamente como critério de decisão, se

This indicator draws a vertical line repeatedly at the set time. The number of lines that can be set can be set arbitrarily. In addition, it is possible to set 4 types of lines. It is possible to change different times, colors, line types, etc. The time can be set to any time in minutes.
In the next version, we plan to display the high and low prices within the setting range.
FREE
MetaTrader Маркет - лучшее место для продажи торговых роботов и технических индикаторов.
Вам необходимо только написать востребованную программу для платформы MetaTrader, красиво оформить и добавить хорошее описание. Мы поможем вам опубликовать продукт в сервисе Маркет, где его могут купить миллионы пользователей MetaTrader. Так что занимайтесь только непосредственно своим делом - пишите программы для автотрейдинга.
Вы упускаете торговые возможности:
- Бесплатные приложения для трейдинга
- 8 000+ сигналов для копирования
- Экономические новости для анализа финансовых рынков
Регистрация
Вход
Если у вас нет учетной записи, зарегистрируйтесь
Для авторизации и пользования сайтом MQL5.com необходимо разрешить использование файлов Сookie.
Пожалуйста, включите в вашем браузере данную настройку, иначе вы не сможете авторизоваться.